Threshold and Availability
Thresholds are established preset values for monitored metrics, which, when exceeded, trigger alerts. This helps in promptly addressing performance issues. The platform's availability monitoring involves consistent checks on resource accessibility to ensure operational status (Up, Down, Trouble, Critical), with generated alerts notifying of any change via your preferred communication medium.
Add Threshold and Availability
To add a new threshold and availability profile,
- Log in to Site24x7.
- Click Admin > Configuration Profiles > Threshold and Availability.
- Click Add Threshold and Availability in Threshold and Availability screen.
- Specify the following details for adding threshold and downtime rules for the service:
- Choose Monitor Type: Select the desired monitor type from the drop down list.
- Display Name: Provide a label for identification purpose.
- Number of location to report monitor as down: Choose from the drop down to receive alert notification when the web service is down from specified number of locations.
- Threshold Configuration
The threshold configuration will be set based on the values you provide for the sections below. A combination of these will be available for configuration, according to the monitor type you choose.- Condition: Choose amongst <,>, =, <=, or>= to set the criteria to trigger alerts based on its operation with the input value.
- Threshold value: This is a value you can provide for any performance metric. For example, it can be CPU usage percentage, memory usage, or network latency. The values are compared against the conditions you've defined to determine whether an alert should be triggered.
- Poll Strategy: Poll strategy defines the interval at which Site24x7 sends requests to gather metrics. It varies depending on the resource type and the level of granularity you require in monitoring. For example, you might choose to poll a critical resource more frequently but poll less critical resources at much more extended intervals.
- Poll Value: The poll value represents the latest data point collected from a monitored resource during a polling interval. It's the actual measurement that is being monitored. This value is used to evaluate against the conditions you've set.
- Notify As: It defines the status under which alerts should be sent. It allows you to customize when you want to receive notifications about a resource's status change. For instance, based on the values you provide, you can opt to get notified immediately when the value is breached based on the criticality.
5.1 Zia-based threshold:
The AI-based threshold will track the abnormal spikes using anomaly detection and will offer a dynamic threshold which will be updated accordingly. If you're choosing AI-based threshold, choose associated anomaly severity and the status accordingly.
-
Advanced Threshold
Advanced thresholds allow users to combine multiple conditions across different attributes, ensuring that alerts are triggered only when meaningful patterns or anomalies occur. You can send customized alerts based on multiple dependent attributes for a single resource (for example, CPU and process metrics of a server) using the logical operators && (AND) and || (OR).
Conditions combining multiple real-time attributes can be set using logical operators. For example, consider a condition defined by the expression A &&(( B && C )|| D) is set to trigger a Critical alert. Here, you can configure:-
A as CPU Utilization and set its threshold as > 80%
-
B as Memory Utilization and set its threshold as >75%
-
C as Disk I/O wait time and set its threshold as 60 ms
-
D as Number of Active Processes and set its threshold as > 200
In the Advanced Threshold Configuration section, you can use the same attribute more than once across different threshold conditions within a single condition for precise alerting logic. For example, you can combine multiple response time boundaries or pair CPU and memory thresholds to reflect realistic operational scenarios.
When the same attribute is referenced in threshold conditions, the conditions are validated in real time to ensure the logic remains meaningful.
If the conditions are contradictory and cannot be satisfied together, the configuration cannot be saved. For example, configuring response_time_threshold > 90 and response_time_threshold < 90 creates a logical conflict because no value can satisfy both conditions simultaneously.
Redundant conditions are identified and a warning is delivered without blocking the configuration. For example, configuring CPU > 90 and CPU > 80 makes one condition unnecessary because the stricter condition already covers the broader one.
While setting advanced thresholds, Poll Strategy, Poll Value, Notify As, and Automation can be configured.
Note-
You can configure a condition to trigger one of the three statuses: Trouble, Critical, or Down.
-
For each status, only one condition can be configured. To add more than one condition for a different status, click the + icon on the right.
-
Advanced thresholds are available only for monitor-level attributes and not the child attributes.
Use cases
-
A DevOps team managing a data center needs to identify early signs of resource contention to prevent unnecessary scaling. Using advanced thresholds, they configure an alert that triggers when CPU Utilization exceeds 80% and Memory Utilization surpasses 85%, or when Swap Utilization exceeds 70%. This helps detect early resource contention while keeping the system operational.
Condition: ((a > 80 && b > 85) || c > 70%) -
When a web application experiences performance degradation due to high resource consumption, the IT operations team sets up a Critical alert that triggers if both CPU Utilization exceeds 85% and Memory Utilization exceeds 90%, or if Disk Space falls below 10% and Network Utilization surpasses 90%. This flags performance issues requiring immediate attention.
Condition: (a > 85% && b > 90%) || (c < 10% && d> 90%) -
A Down alert is activated when a database server nears a complete system failure. To prevent false positives from isolated spikes, a system administrator configures a Down alert to be triggered only when the system is in a complete overload state. It is triggered only when CPU Utilization > 90%, Memory Utilization > 95%, and Swap Utilization > 90% occur simultaneously, ensuring the system is truly at risk before raising an alert.
Condition: (a > 90 && b > 95 && c > 90%)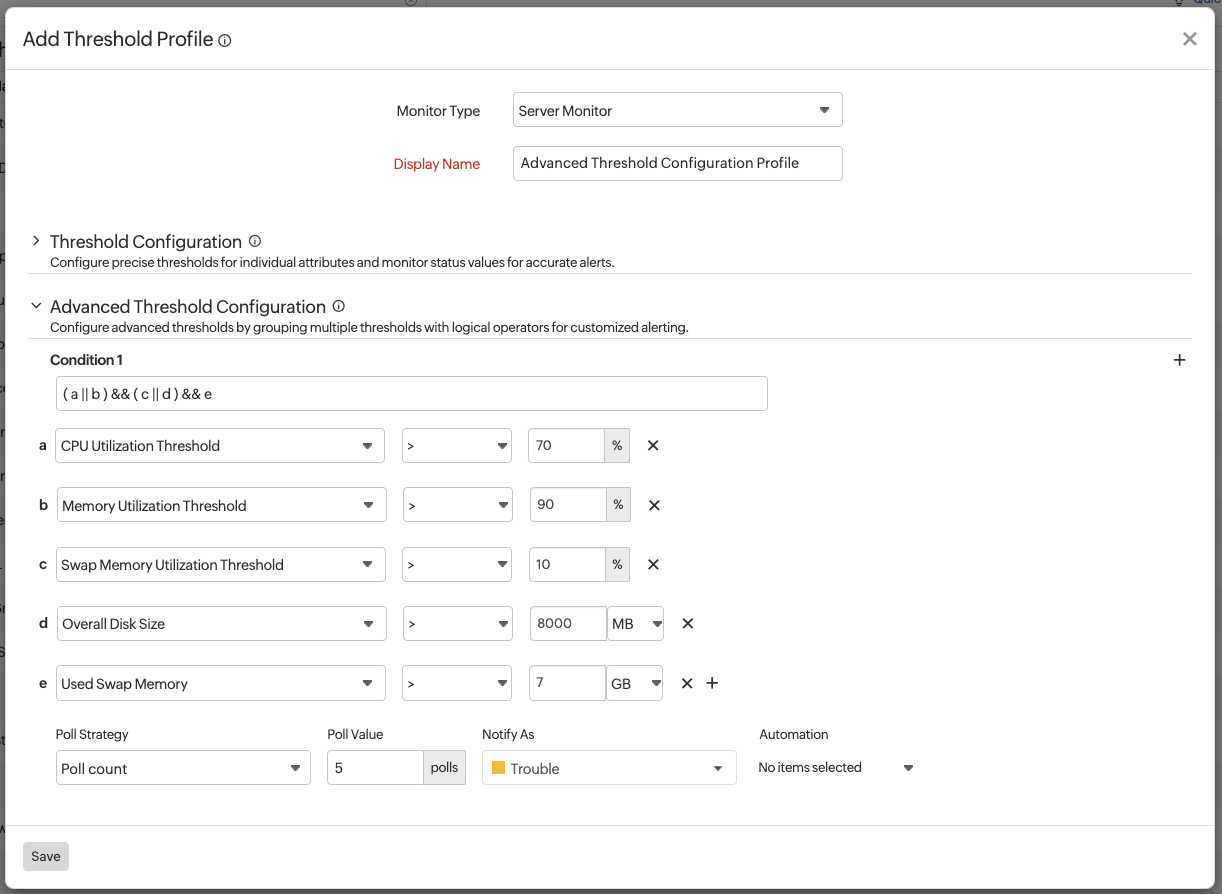
-
- Click Save.
- The threshold and availability profile created for the service will be automatically listed in Threshold and Availability screen along with the others already created.
NoteUsers with custom roles can use the View My Resources option to filter and view resources they created.
Edit Threshold and Availability
- Click the profile which you want to edit.
- Edit the parameters which needs to be changed in Add Threshold and Availability window.
- Click Save.
Delete the Threshold and Availability
- Click the profile in the Threshold and Availability screen which needs to be deleted.
- This will navigate to Add Threshold and Availability window.
- Click Delete.
You can always clone a threshold profile or delete it from the Threshold Profiles list by accessing the hamburger icon. Configure Downtime Rules to reduce false alerts for the following monitors:
Synthetic Transactions
Web Transaction | REST API Transaction | Web Transaction (Browser) | Synthetic Mobile Application
Internet Service Monitors
Website | Web Page Speed (Browser) | REST API | SOAP Web Service | DNS Server | SSL / TLS Certificate | Mail Delivery | Port (Custom Protocol) | POP Server | SMTP Server | Ping | FTP Server | NTP Server | FTP Transfer | ISP Latency | Application Cluster
Virtualization Monitoring
On-Premise Poller | VMware ESX/ESXi Server | VMware VM | VMware Datastore | VMware Resource Pool | VMware Snapshot | VMware Cluster
VMware VDI: Horizon
VMware NSX-T: VMware NSX-T Manager | VMware NSX-T Gateways | VMware NSX-T nodes
Nutanix: Nutanix Cluster | Nutanix Host | Nutanix VM | Nutanix Storage Container
XenServer: XenServer VM | XenServer host
Backup Monitoring
Veeam: Backup Server | Azure backup appliance
Commvault: Commvault Command Center
Zerto: Zerto Analytics monitor
AWS Monitoring
EC2 Instance | RDS Instance | S3 bucket | S3 object URL endpoint | DynamoDB table | Classic load balancer | Application load balancer | SNS Topic | Lambda | ElastiCache | Network load balancer | SQS | CloudFront | Kinesis services | Elastic Beanstalk | Direct Connect | VPC-VPN Connection | API Gateway | Route 53 Health Check | Route 53 Resolver | Route 53 Hosted Zone | Route 53 Hosted Zone Record Set | Gateway Load Balancer | Systems Manager | Amazon AppStream 2.0
Server Monitoring
Server Monitor | Server Monitor - Agentless |Plugin | Exchange | SQL | IIS | SharePoint | Office 365 | SMART Disk
Network Monitoring
Network Device | NetFlow Monitor | NCM Device | VoIP Monitor | WAN Monitor | IP address management (IPAM) | Wireless LAN Controller (WLC) | Cisco Meraki | Cisco ACI | VMware SD-WAN | Aruba Central | Cisco Catalyst SD-WAN
Application Performance Monitoring
Application Performance Monitor | Real User Monitor
Capacity Planning
SLO