Website monitor
Keep a constant watch over a specified website and track its availability and performance minute-by-minute. Verify the availability of specified, addressable, standard HTTP, and HTTPS URLs from over 130 global locations and also from behind-your-firewall using On-Premise Poller.
Also, scan your websites to check for the presence and absence of specified keywords. You can set up alerts and be notified via voice calls, emails, SMS, RSS, IM, and browser push notifications. Additionally, monitor your dual-stacked IPv4 and IPv6-enabled infrastructure with Site24x7.
Add a website monitor
- Log in to Site24x7 and go to Web > Website (+).
- Display Name: Provide an appropriate name for the website which you want to monitor.
- Webpage URL: Type the URL which needs to be monitored.
- Add Bulk URLs: If you wish to add more URLs in bulk for monitoring, you can do the same by clicking the link Add Bulk URLs next to the Webpage URL field.
- Continuous Check: Take for instance that you've a sitemap where many URLs are listed, you can submit the sitemap URL along with a Rediscovery Interval or frequency for the sitemap to be checked. This can help in automatically adding or removing the URLs that were added or removed. Moreover, the monitors added for the URLs will be suspended when the URL is removed from the sitemap. Also, the monitors will be added in bulk based on your license limit. When URLs are added, the URLs will be crawled for monitoring.
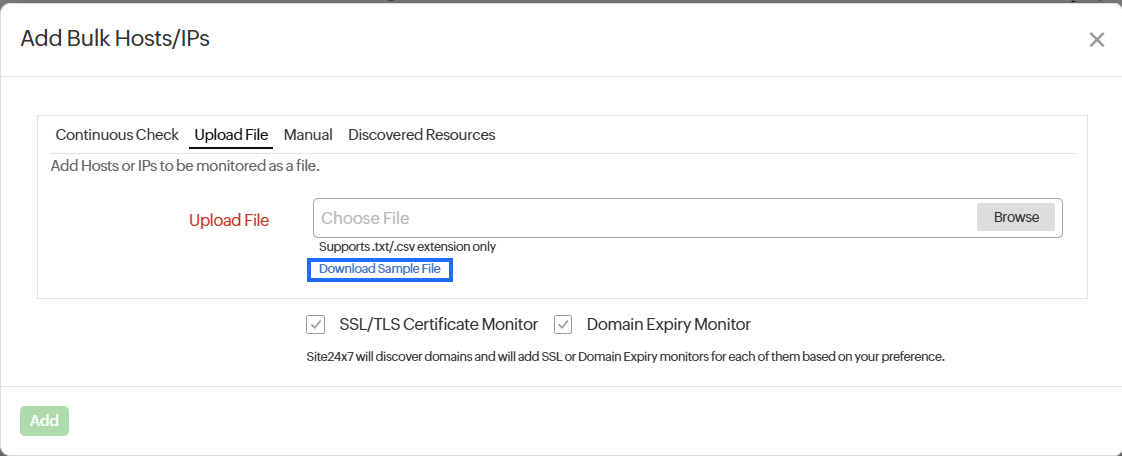
You can also submit your URLs in CSV format. Read this to know more about submitting in CSV format. To view the imported monitors, you can navigate to Admin > Import Monitors. On the Import Monitors page, you are provided with an option to disable or enable the import process. Monitors added using Continuous Check will be listed with System tag. - Upload File: This option allows you to submit your hosts or IP addresses together as a file. Click the Download Sample File link to download the sample file.

- Manual: You can opt to upload your URLs directly using this option.
- Discovered Resources: Click Discovered Resources to view a list of all the discovered resources available on your monitors. Select the desired URLs, then click Add.
You can opt to add SSL/TLS Certificate monitors to get the expiry or validity of your SSL Certificates checked, or can opt to check the expiration dates of your domains by adding a Domain Expiry monitor.

- Continuous Check: Take for instance that you've a sitemap where many URLs are listed, you can submit the sitemap URL along with a Rediscovery Interval or frequency for the sitemap to be checked. This can help in automatically adding or removing the URLs that were added or removed. Moreover, the monitors added for the URLs will be suspended when the URL is removed from the sitemap. Also, the monitors will be added in bulk based on your license limit. When URLs are added, the URLs will be crawled for monitoring.
- View Discovered URLs: Click on the View Discovered URLs link to view a list of all the discovered resources available in your monitors. Select the desired URLs, then click Add. Learn more about discovered resources.
- Check Frequency: Choose the required poll frequency. The frequency can be set from 10 seconds to one day. The frequencies of 10, 15, and 30 seconds can be configured if you're using Enterprise, Enterprise Web, Enterprise Plus Web, Elite, Elite Web Packs, Team 2024, Team, Team Web, and MSP. For all other users, one minute will be the minimum supported check frequency.
Note
- Configuring a 30-second check frequency will consume the license of two basic monitors.
- Configuring a 15-second poll frequency will consume the license of four basic monitors and can be configured only with the On-Premise Poller locations.
- Configuring a 10-second poll frequency will consume the license of six basic monitors and can be configured only with the On-Premise Poller locations.
- Monitoring Locations: Choose global locations from the drop-down list to set up monitoring of your website from these locations. You must configure atleast one primary location for monitoring. You can either pick IPv6/IPv4 locations or set-up an On-Premise Poller to serve as a monitoring station. The monitors with 10-second and 15-second poll frequencies will be supported only with On-Premise Poller locations. To know more, refer Location Profile.

-
-
Connection Timeout:Specify the time in seconds needed to establish a connection with the target server. If the connection is not established within the specified time, the website will be reported as down with "Could not establish connection" as the reason. Associate your monitor with multiple Monitor Groups by selecting the relevant monitor groups from the drop-down list. Learn more.
- Preferred Internet Protocol: You can use this option to perform monitoring over your preferred internet protocol. While IPv4 or IPv6 is used in locations where the respective protocol is supported, the IPv4 or IPv6 option will help in flexibly switching to the protocol that is supported in a particular location if one protocol fails.
IPv4 and IPv6 options will make two different connections to the configured URL. This will consume two basic monitor licenses.
- Store Data Fields: Check the HTTP Headers and the Response Content boxes if you wish to store the data for every data collection.
This field allows you to select the data that will be sent to AppLogs during each data collection. By clicking the respective entry of the Log Report, the selected data will appear in the Collection Summary report under the respective Log Report entry.
Note- Enabling the HTTP Headers and Response Content will store and retrieve your data in the AppLogs and display it in the Collection Summary report.
- The whole stored data can be viewed in the App Log query console, and you can perform query actions on the stored data.
- The data stored in AppLogs will consume an AppLogs license based on its size.

- Monitor Groups: Multiple monitor group support for monitors allow a monitor to be associated with multiple dependent resources in different monitor groups. If during a normal monitor status check, any one of these dependent resources' status is identified as DOWN, the alert for the monitor will be automatically suppressed. However, the dependency configuration at monitor level is always given the higher priority over any other monitor group level dependency configuration for suppressing alerts.
-
Dependent on Monitor: Select a monitor from the drop-down list to choose it as your Dependent on Monitor. Alerts to your monitor will be suppressed based on the DOWN status of your dependent monitor.
Configuring a dependent monitor and suppressing alerts based on the dependent monitor's status is part of providing you with better false alerts protection. Learn more about alert suppression at monitor level.
If you select "None" in the Dependent on Monitor field, alerting will progress as per your normal configuration settings. No alerts will be suppressed in this case as the monitor doesn't have any dependent monitor.
-
- HTTP Configuration:
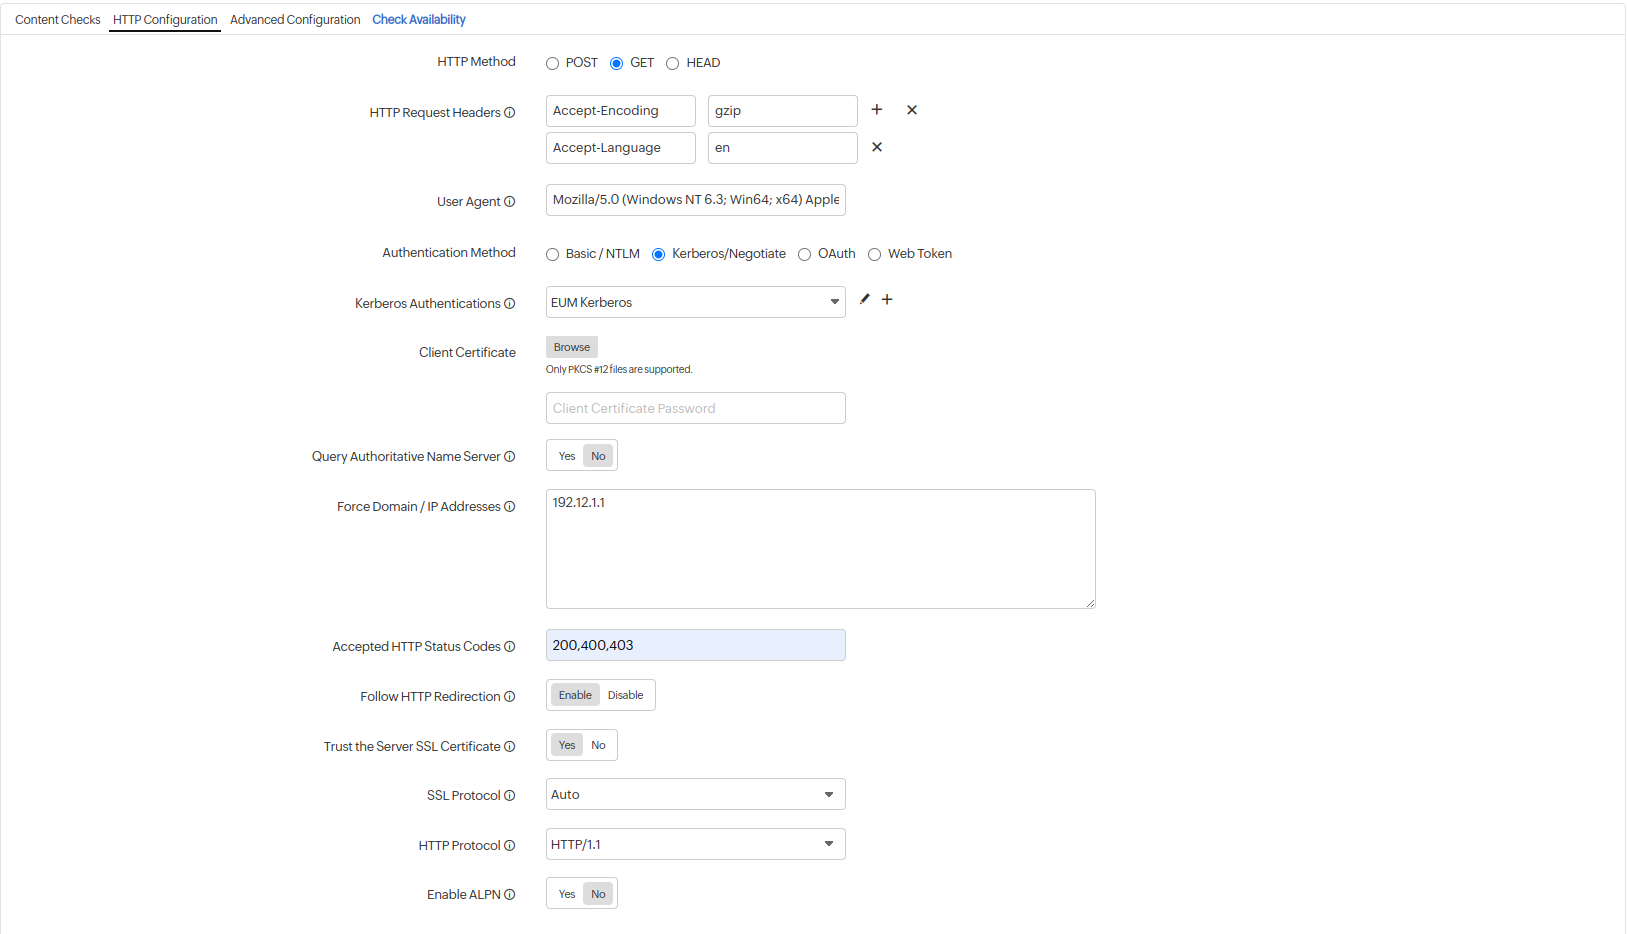
- HTTP Method: Specify the method to be used for connecting with the site– GET, HEAD or POST. Select the radio buttons to configure the form submission method and appropriate body type for the POST HTTP Method.
Note- POST method would submit the parameters to access the URL. POST submission method supports request sending in FORM, Text, XML or JSON formats.
- In the HEAD method, you'll be able to check the availability of the URL.
- In the GET method, the entire HTML response is fetched and checked for the presence of your configured keywords.
- HTTP Request Headers: Sometimes you might want to customize the default HTTP request header information. In such cases, the additional header name and header value can be added here.
NoteTo use a credential profile in HTTP Configurations, type $ and a list of available credential profiles will appear—select the desired one from this list. Learn more about credential profiles.

- User Agent: Set customized user agent (web browser) for sending your request and the HTTP headers. You can choose from the available user agents.
- Authentication Method: Specify the radio button and update the credentials accordingly.
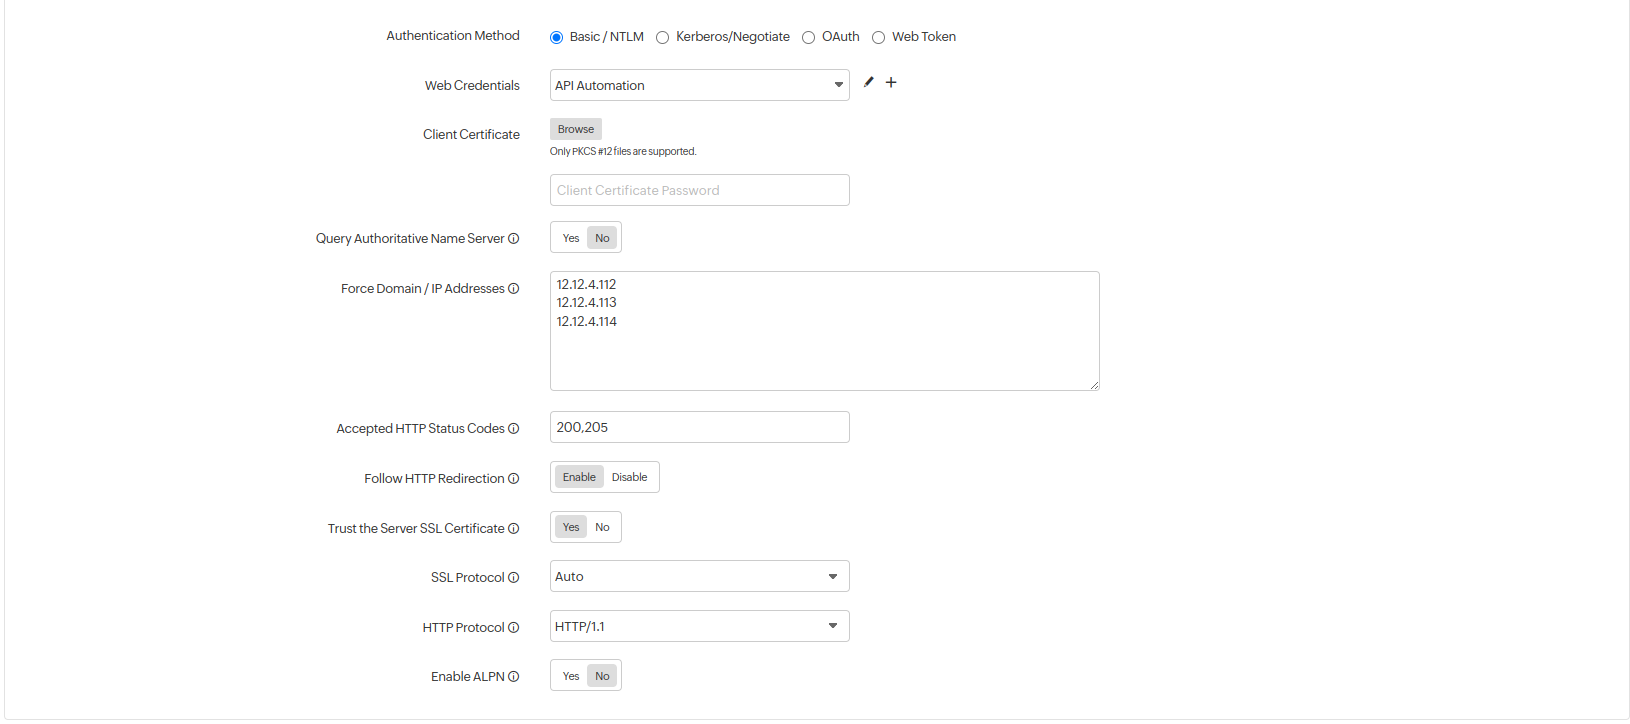
- Basic/NTLM Credentials: Configure your Basic/NTLM based authorization. Windows NTLM is the authentication protocol used on systems running on Windows OS.
- Web Credentials: Choose your web credentials for URLs requiring Basic/NTLM based authentication, from the drop down. Learn how to add/ edit credentials.
- Kerberos/Negotiation: If you are monitoring a resource secured by Kerberos authentication, select the Kerberos/Negotiation radio button.
- Kerberos Authentication: Select the Kerberos credential profile from your preconfigured list or create a new Kerberos authentication profile by clicking the (+) button.
Note- Kerberos authentication is supported only for On-Premise Poller locations.
- Learn how to configure a Kerberos credential profile.

- Kerberos Authentication: Select the Kerberos credential profile from your preconfigured list or create a new Kerberos authentication profile by clicking the (+) button.
- OAuth: Pick the OAuth radio button, if you're monitoring a resource that is secured by OAuth framework.
- OAuth Provider Name: Select the OAuth Provider Name from your preconfigured list or create a new OAuth profile by clicking the + button.
NoteLearn how to configure an OAuth Provider.
- OAuth Provider Name: Select the OAuth Provider Name from your preconfigured list or create a new OAuth profile by clicking the + button.
- Web Token: Register Site24x7 with your authentication server to monitor protected resources using web tokens.
- Web Token Name: Select the Web Token Name from your preconfigured list or create a new Web Token by clicking the + button.
NoteLearn how to add a Web Token.
- Web Token Name: Select the Web Token Name from your preconfigured list or create a new Web Token by clicking the + button.
- Client Certificate : For websites that require client certificate authentication, upload the client certificate (has to be a PKCS#12 file.)
- Basic/NTLM Credentials: Configure your Basic/NTLM based authorization. Windows NTLM is the authentication protocol used on systems running on Windows OS.
- Query Authoritative Name Server: Use the toggle button to decide if you want to resolve your domain name by an authoritative name server.
- Force Domain/IP addresses: You can provide the specific domain name or a list of IPv4 or IPv6 addresses to be used instead of the DNS resolved IP addresses.
NoteYou must enter one IPv4 or IPv6 address per line, in order of preference.
- Accepted HTTP status codes: Provide a comma-separated list of HTTP status codes that indicate a successful response. You can specify individual status codes, as well as ranges separated with a colon. Learn about Accepted HTTP Status Codes.
- Follow HTTP Redirection: Follow up to 10 HTTP redirections by enabling this option.
- Trust the Server SSL Certificate: Choose Yes to accept the certificate and to ignore the validation error. You can choose No to validate the certificate and to get alerted when the validation fails.
- SSL Protocol: Specify the version number of the TLS/SSL protocol (TLSv1.3, TLSv1.2, TLSv1.1, TLSv1 and SSLv3 supported) to validate proper SSL handshake. Use Auto mode to enable automatic detection and negotiation.
NoteSSL Protocol validation works only for HTTPS domains. If you've specified a different SSL protocol version than the actual one, the monitor status fails during the poll.
- HTTP Protocol: Choose the preferred version of the application-layer protocol (HTTP/1.1 or HTTP/2) to be used for negotiation.
- Enable ALPN: Enable ALPN to ensure that only supported application protocols are sent as part of the TLS handshake and ensure reduced round trip time. By default, it'll be set to Yes. Enable ALPN option isn't supported by On-Premise Poller. We'll be extending the support in the next update.

- HTTP Method: Specify the method to be used for connecting with the site– GET, HEAD or POST. Select the radio buttons to configure the form submission method and appropriate body type for the POST HTTP Method.
- Content Checks:
Here's a quick video that shows how you can add content checks while monitoring a website for its availability:
- Should contain string(s): Get alerted when the specified keywords are not present in the website. Mention the keywords in the check box and use the slider button to trigger the required kind of alert.
- Should not contain string(s): Get alerted when the specified keywords are present in the website content. Mention the keywords in the check box and use the slider button to trigger the required kind of alert.
NoteYou must adhere to the following conditions while adding keywords in the given field:
- A single string or keyword can be configured with/without any double quotes (ex: HTML).
- When you are choosing text as the response format, it can be configured in the below format, “{\”cache\":\"success\",\"WSF\":\"success\",\"bean\":\"success\",\"DB\":\"success\"}"
- If there are two strings, which comprise a single keyword–add a space in between the two strings and enclose it with double quotes. (ex: "HTML response").
- In case you have more than a couple of individual keywords configured, you will have to separate them with a space and also use double quotes for each of them ("monitor" "HTML").
- Case sensitive: Enable the toggle button for this option
- Should match regular expression: Configure your alert based on whether a particular pattern matches with the website content. For example when you consider the expression ^[a-z0-9_-]{3,15}$, your website content should contain alphabets from a to z,numbers from 0 to 9 , underscore and a hyphen. Also there should be minimum length of 3 characters and maximum length of 15 characters. When it is not matched, your website will be reported as "Regular expression"^[a-z0-9_-]{3,15}$" does not match" as a reason.
NoteLearn more about content checks and negative lookaheads in regular expression match.
- Should contain HTTP Response Headers: Enter the desired response header and values for your HTTP request and verify whether the HTTP headers are present or the values match with the desired response. Trigger a trouble or down alert during a check failure.
While configuring the response header check, you must add values based on the following conditions:
- You can add multiple headers and each header can accept multiple values.
- A single value can be configured with/without any double quotes (eg.: keep-alive or "keep-alive").
- In case you have multiple header values configured, you will have to separate them with a space and also use double quotes for each of them. (eg., "gzip" "br").
- Header value can also support regex validation. The regex pattern should be "${<regex>}". For example : ${\d{4}} can be used to search for four continuous digit numerical value in the value of the header configured in the header name.
- HTTP Response Header Severity: When the configured header name is missing or header value is not matching those in the response header received, an alert will be triggered. You can use the toggle button to specify the Alert Severity as DOWN or TROUBLE.

- Check Availability: Once you provide all the mandatory details related to the configuration, you can use this option to test the configurations you've created. Service testing helps you to drill deep into code and get hands-on experience.
- Configuration Profiles:
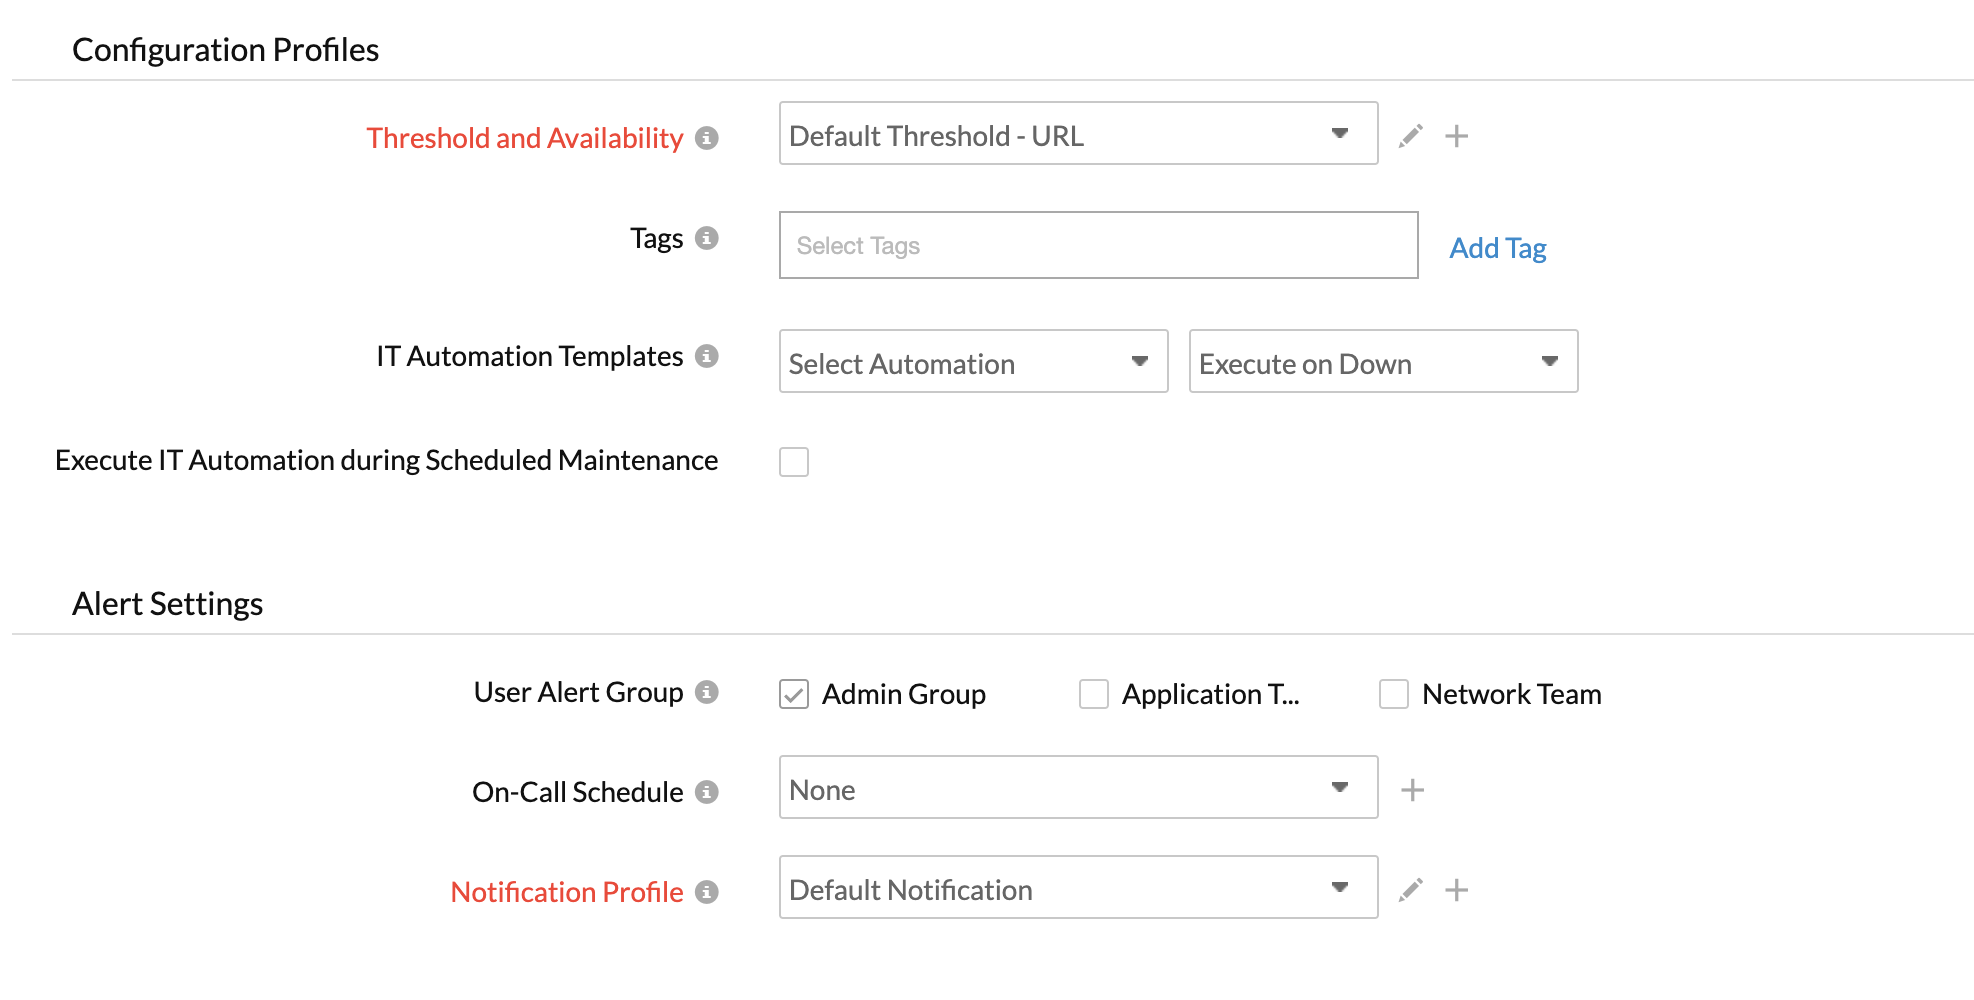
- Threshold and Availability: Select a threshold profile from the drop-down or choose the default threshold set available and get notified when the resources cross the configured threshold and availability. Learn more.
To create a customized threshold and availability profile, refer Threshold and Availability. - Tags: Associate your monitor with predefined Tag(s) to help organize and manage your monitors creatively. Learn more.
- IT Automation Templates: Select automation to be executed when the website is down/trouble/up/any status change/any attribute change. The defined action gets executed when there is a state change and selected user groups are alerted. Learn more.
- Execute IT Automation during Scheduled Maintenance: Configuring a scheduled maintenance window allows you to suppress alerts for select IT resources during routine maintenance tasks. Select the check box to enable the option to execute IT automation—script executions, server commands, and more—during this period.

- Threshold and Availability: Select a threshold profile from the drop-down or choose the default threshold set available and get notified when the resources cross the configured threshold and availability. Learn more.
- Alert Settings:
- User Alert Group: Select the user group that needs to be alerted during an outage. Learn more.
- On-Call Schedule: The On-Call Schedule option helps you to ensure that the notifications are sent to assignees in specific shift hours, helping them to quickly respond to alerts or incidents. Choose an On-Call of your preference from the drop-down.
- Notification Profile: Choose a notification profile from the drop-down or select the default profile available. A notification profile helps to configure when and who needs to be notified in case of downtime. Learn more.
NoteYou can receive alerts if the monitors are associated with user groups, irrespective of the On-Call shift you've configured.
- Third-Party Integrations: Associate your monitor with a pre-configured third-party service. It lets you push your monitor alarms to selected services and facilitates improved incident management.
Note
If you haven't set up any integrations yet, navigate to Admin > Third Party Integration to create one. Tell me more.
- Click Save.You can click Check and Save if you want to run the configurations and seewhether the monitor is performing well and then get the monitor saved. In case of an error, the monitor will not be saved.
Once the monitor setup is completed, the Site24x7 deep discovery wizard scans your domain and auto-detects all related internet resources for your domain that can be added to your account for comprehensive internet services monitoring. Explore more about internet services deep discovery.
Learn more about the various performance metrics of an Internet Service monitor. To understand the distinction between various internet service monitoring features, read more.
Read more about Site24x7 website monitoring.
Troubleshooting Tips
- Default ports for both inbound and outbound connections in various website and internet services monitors
- In Google analytics, exclude traffic from Site24x7 to track actual user visits to my web application
- Monitor issues at database level for websites developed using OpenCart or Joomla
- Monitor websites that require a HTTP POST to determine availability
- Website unavailability as reported by Site24x7
- Observe a spike in my website response time
- Meaning of the trouble message "Content Length Modified"
