Collecting CloudWatch logs using the Lambda Function
Amazon CloudWatch logs works as a centralized system from which you can store logs from multiple AWS services and applications. By integrating CloudWatch logs with Site24x7, you can search for specific error codes or fields and analyze them for troubleshooting. Learn more about log management with Site24x7.
Create a Log Profile
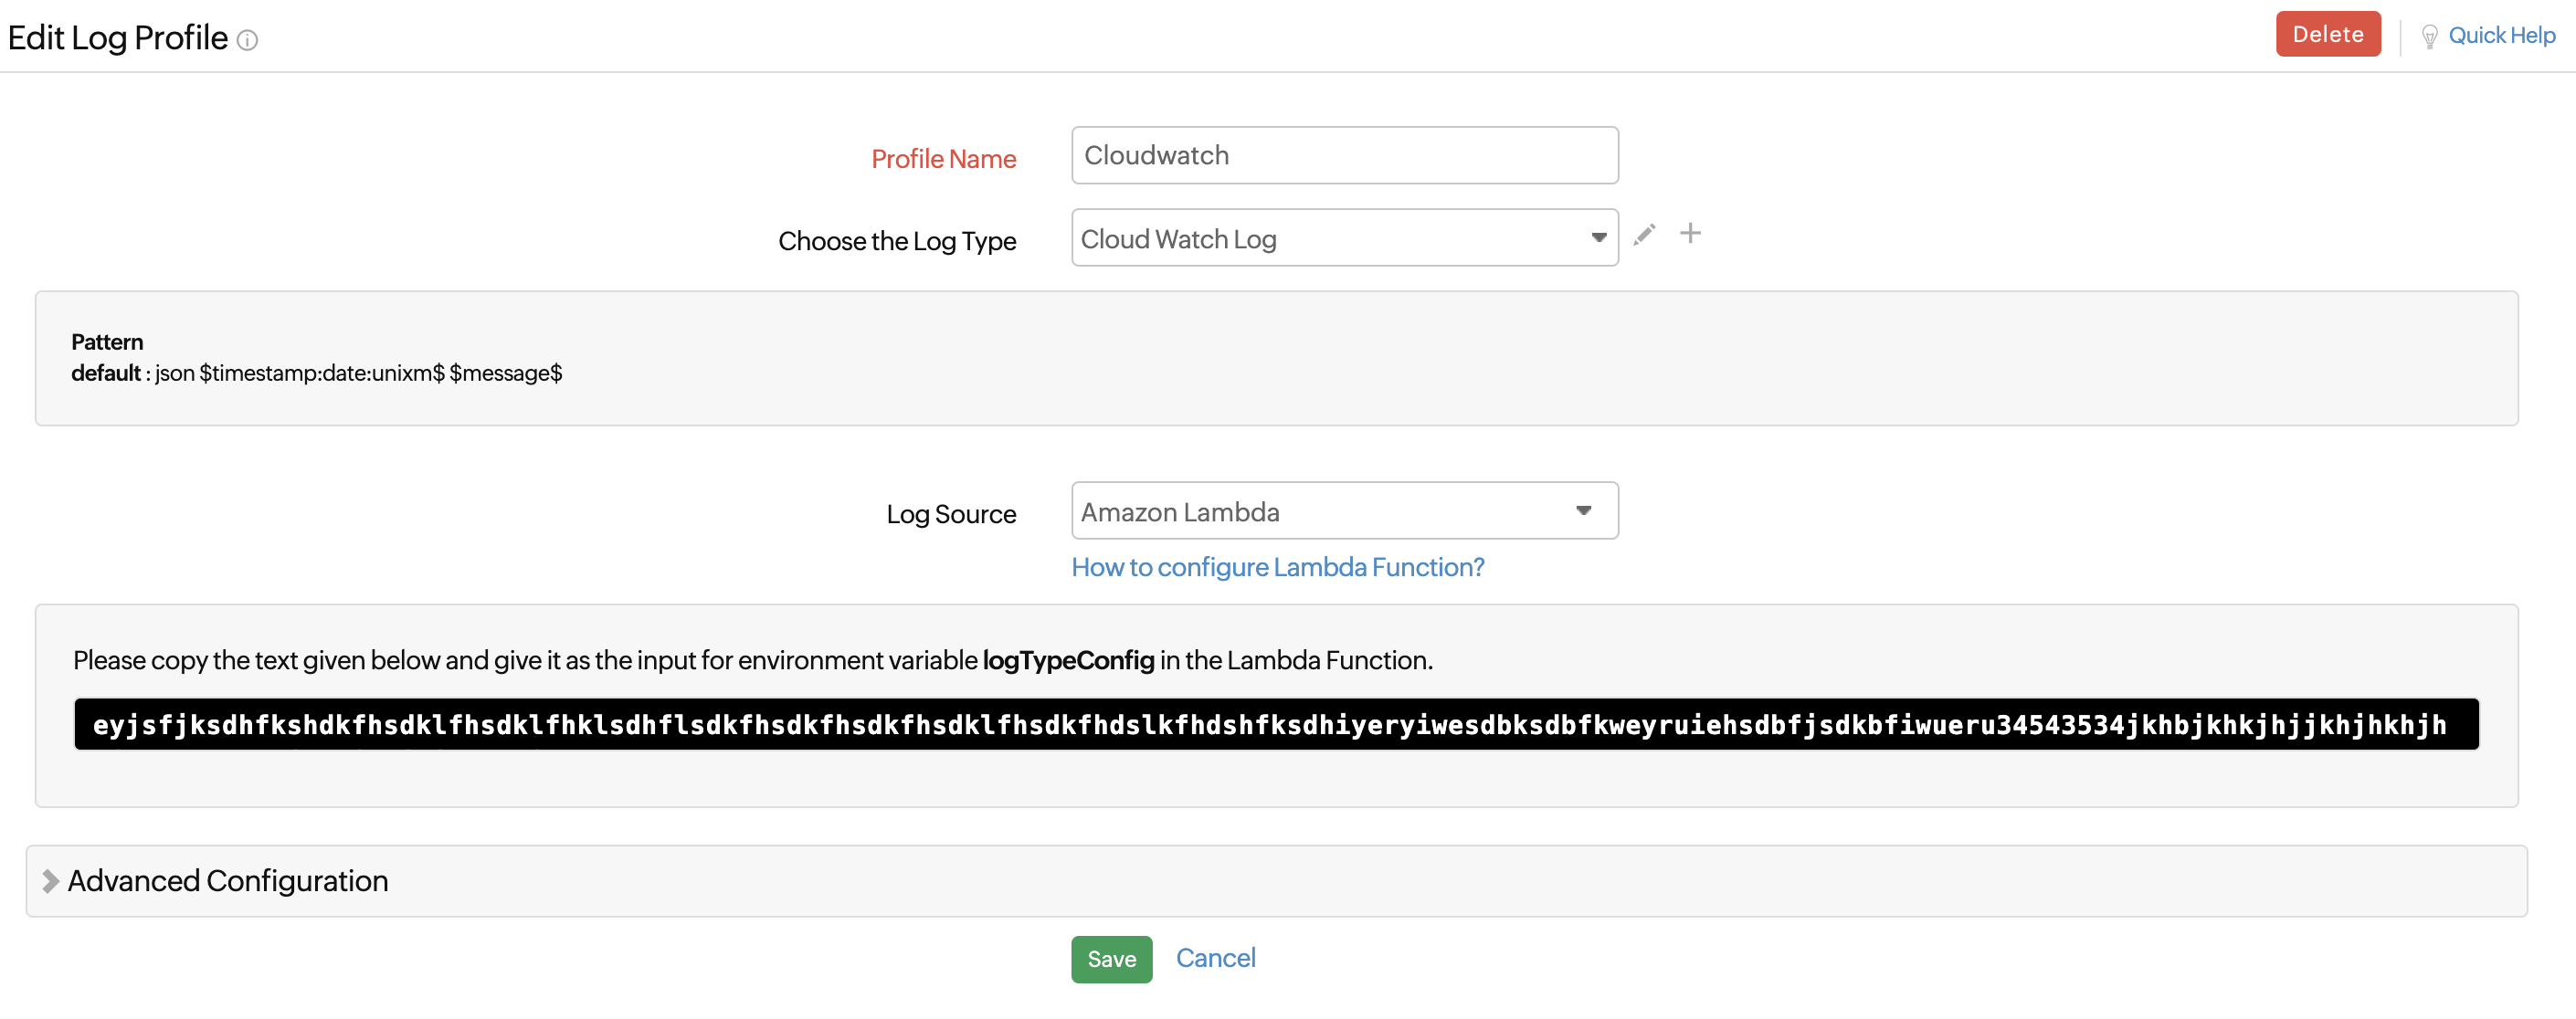
To collect the CloudWatch logs you will first need to create a Log Profile. Navigate to Admin > AppLogs > Log Profile > Add Log Profile, and follow the instructions below:
- Profile Name: Enter a name for your Log Profile.
- Log Type: Choose CloudWatch logs.
- Log Source: Choose Amazon Lambda.
- Click Save.
- Configure the Lambda function as described here.
AWS setup
1. Get the Lambda code
Use this link to obtain the code required for the Lambda Function:
https://github.com/site24x7/applogs-aws-lambda/blob/master/cloudwatchlogs/cloudwatchlogs-sender.py
2. Configure the Lambda Function
- Choose Lambda from the Services drop-down list, and choose Create Function. Select Author from scratch, define a name for the function, and choose Python 3.7 or above as the Runtime.
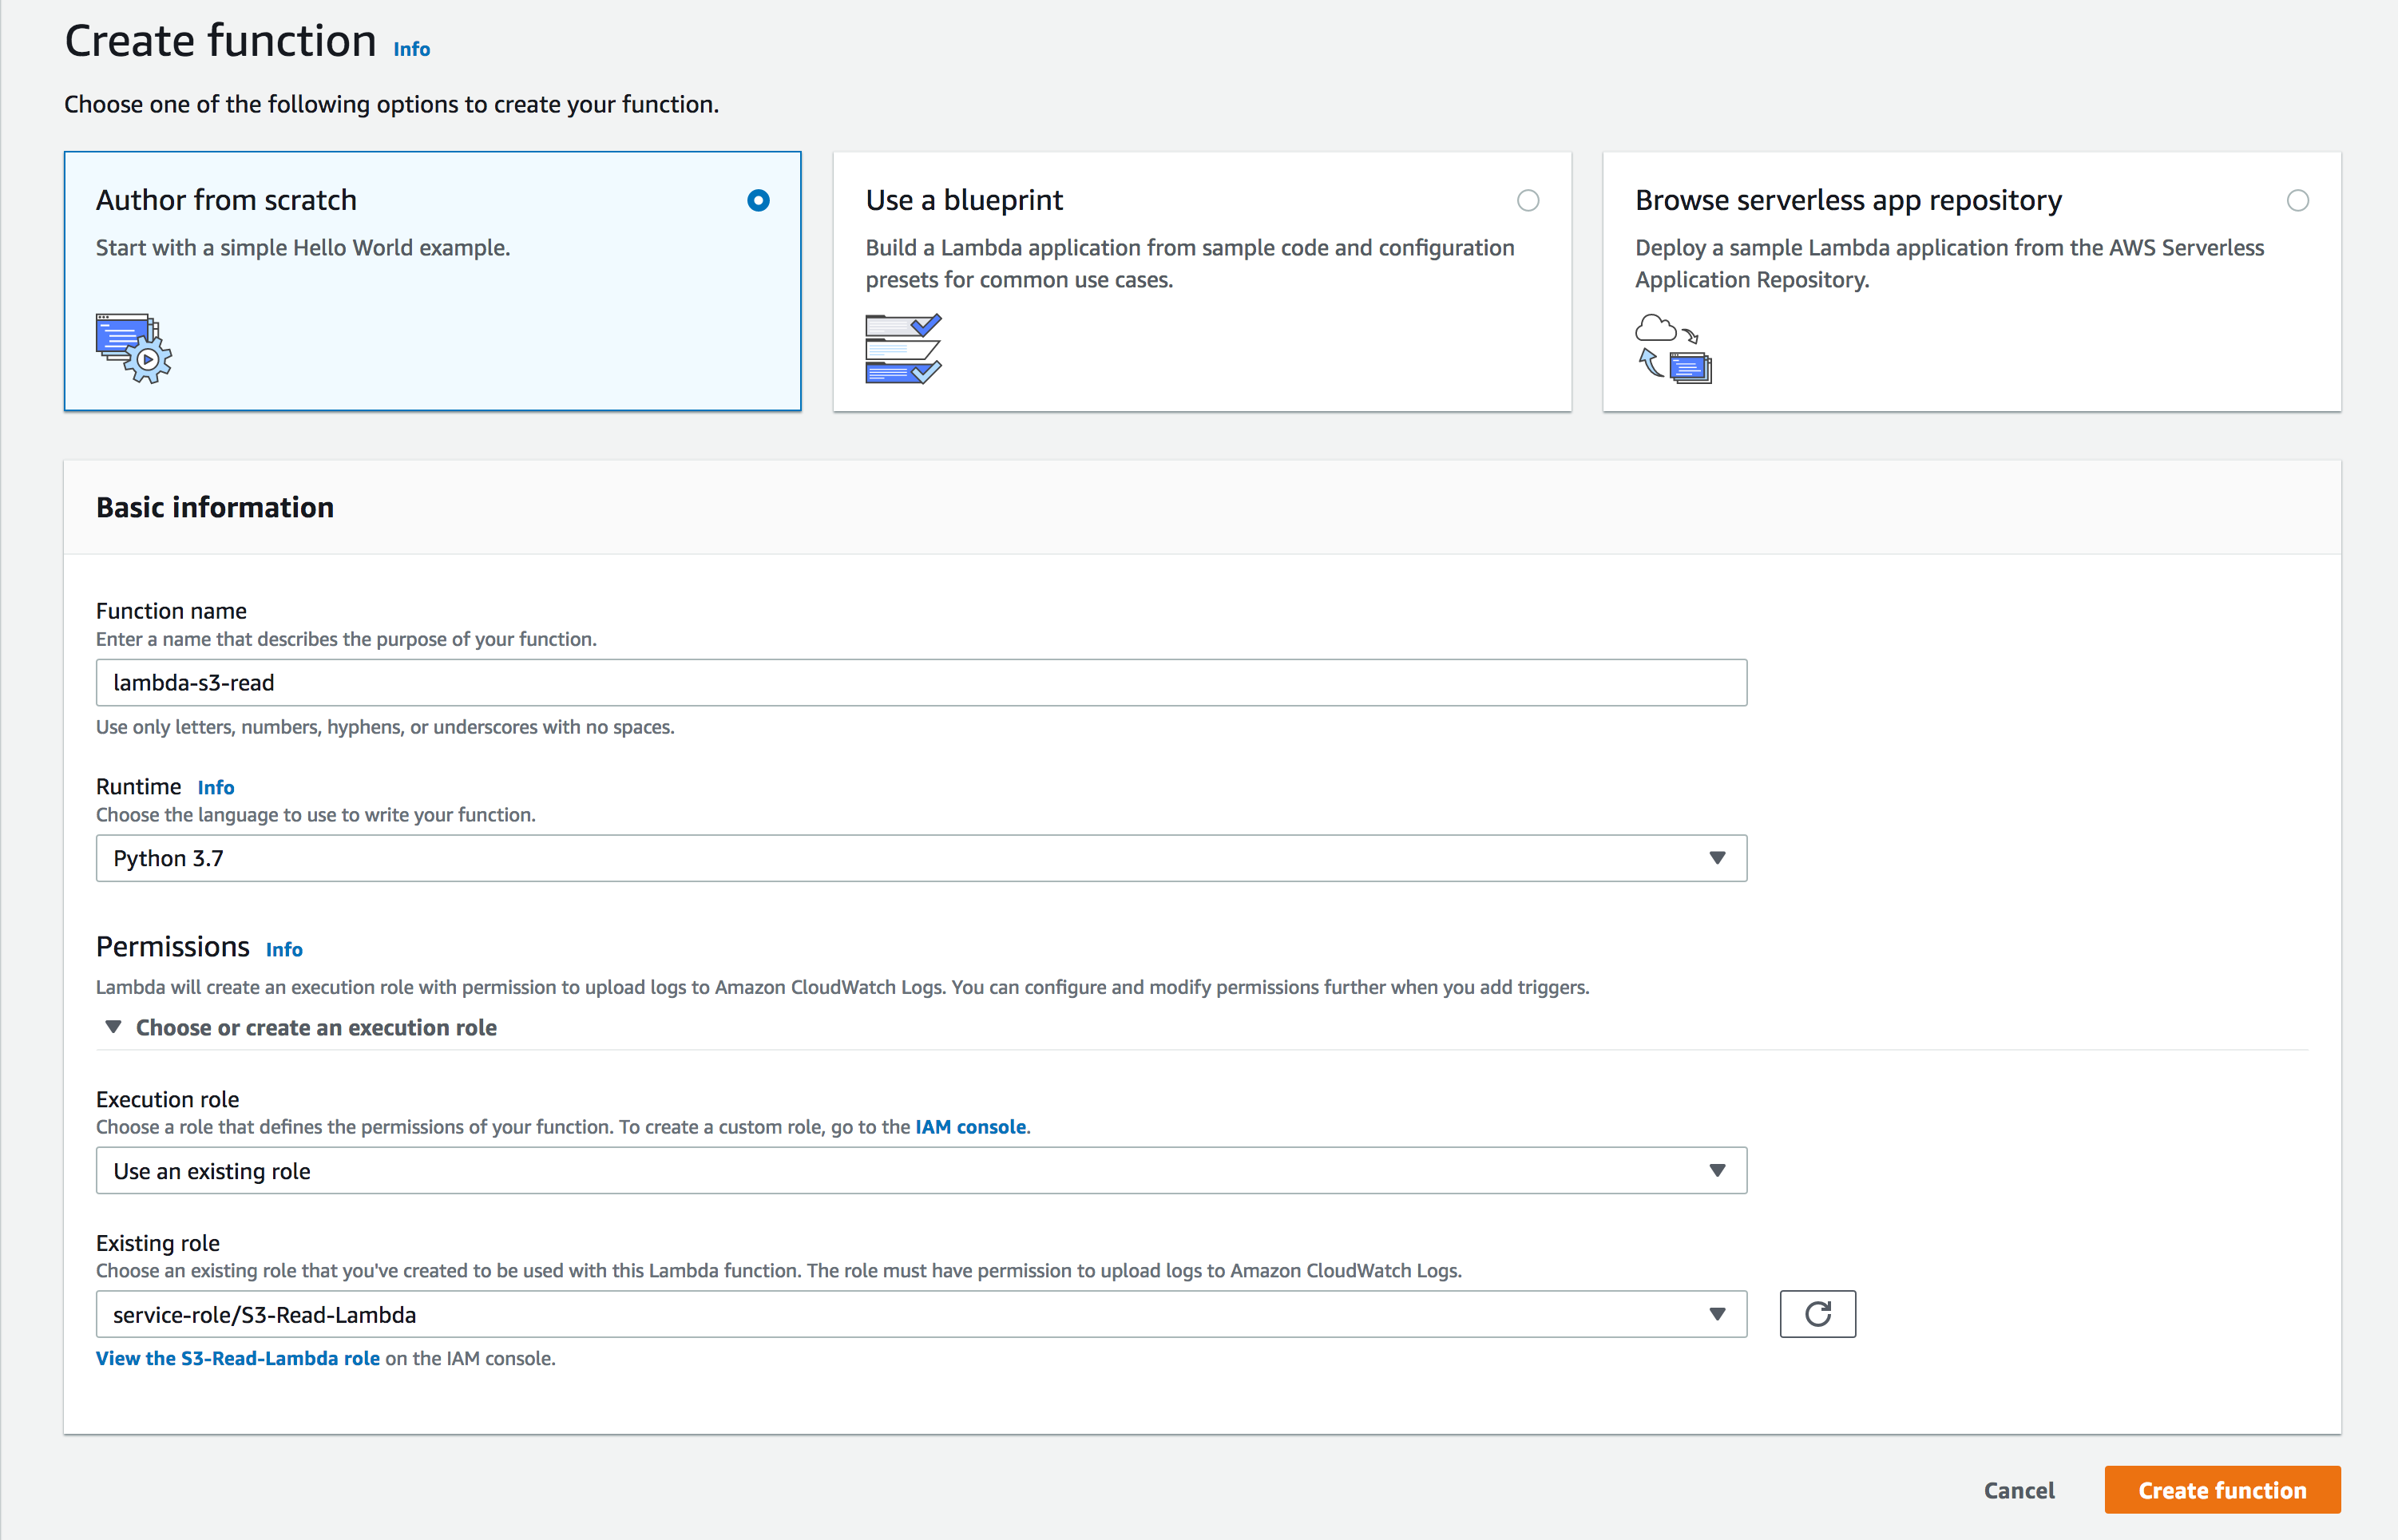
- Permissions: You can choose an existing IAM role or Create a new role with basic Lambda permissions. You also have the option to create a new user role and extend permission to other services as well.
- Add triggers: Scroll down to choose CloudWatch Logs. Any log file added, will be sent to Site24x7 by the Lambda Function.
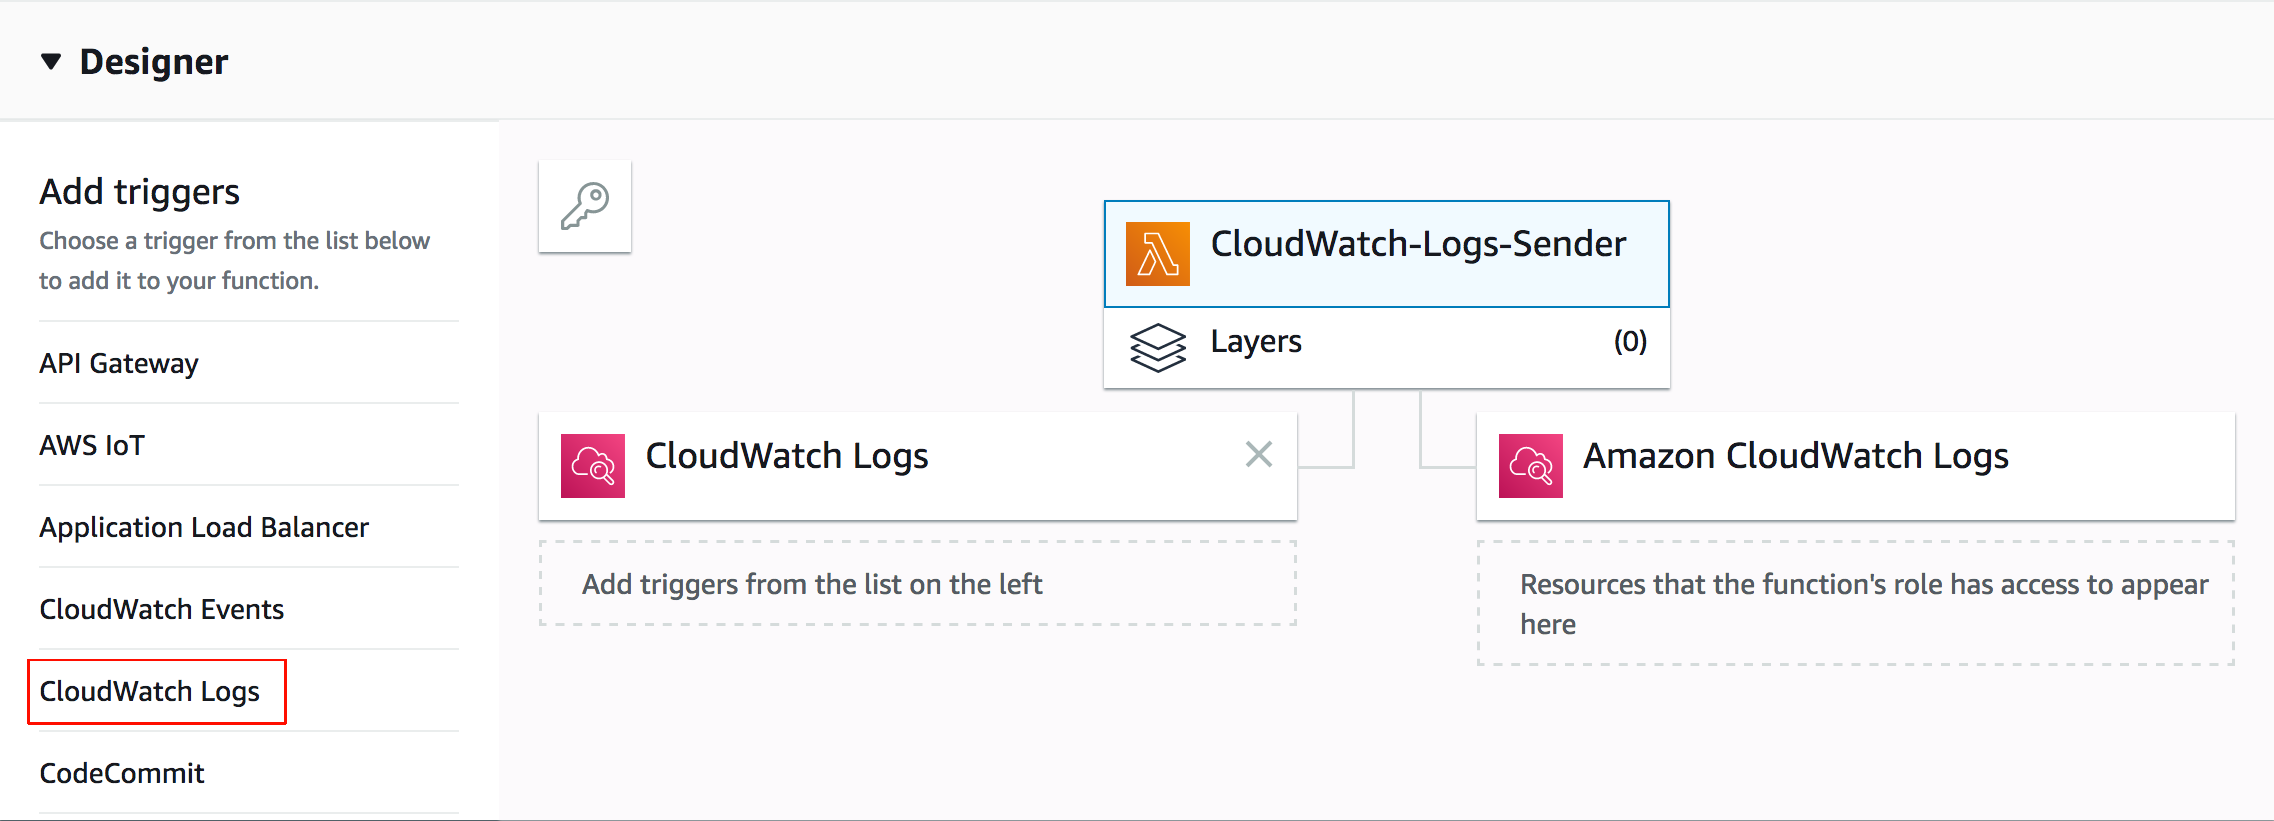
- Configure Triggers
- Log group: Select the CloudWatch log group that acts as the source. Any event triggered in the selected group will call the Lambda Function.
- Filter name: Choose a name for your filter.
- Select the check box for enable trigger and click Add.
- In the window that opens, click on the Lambda Function as shown:
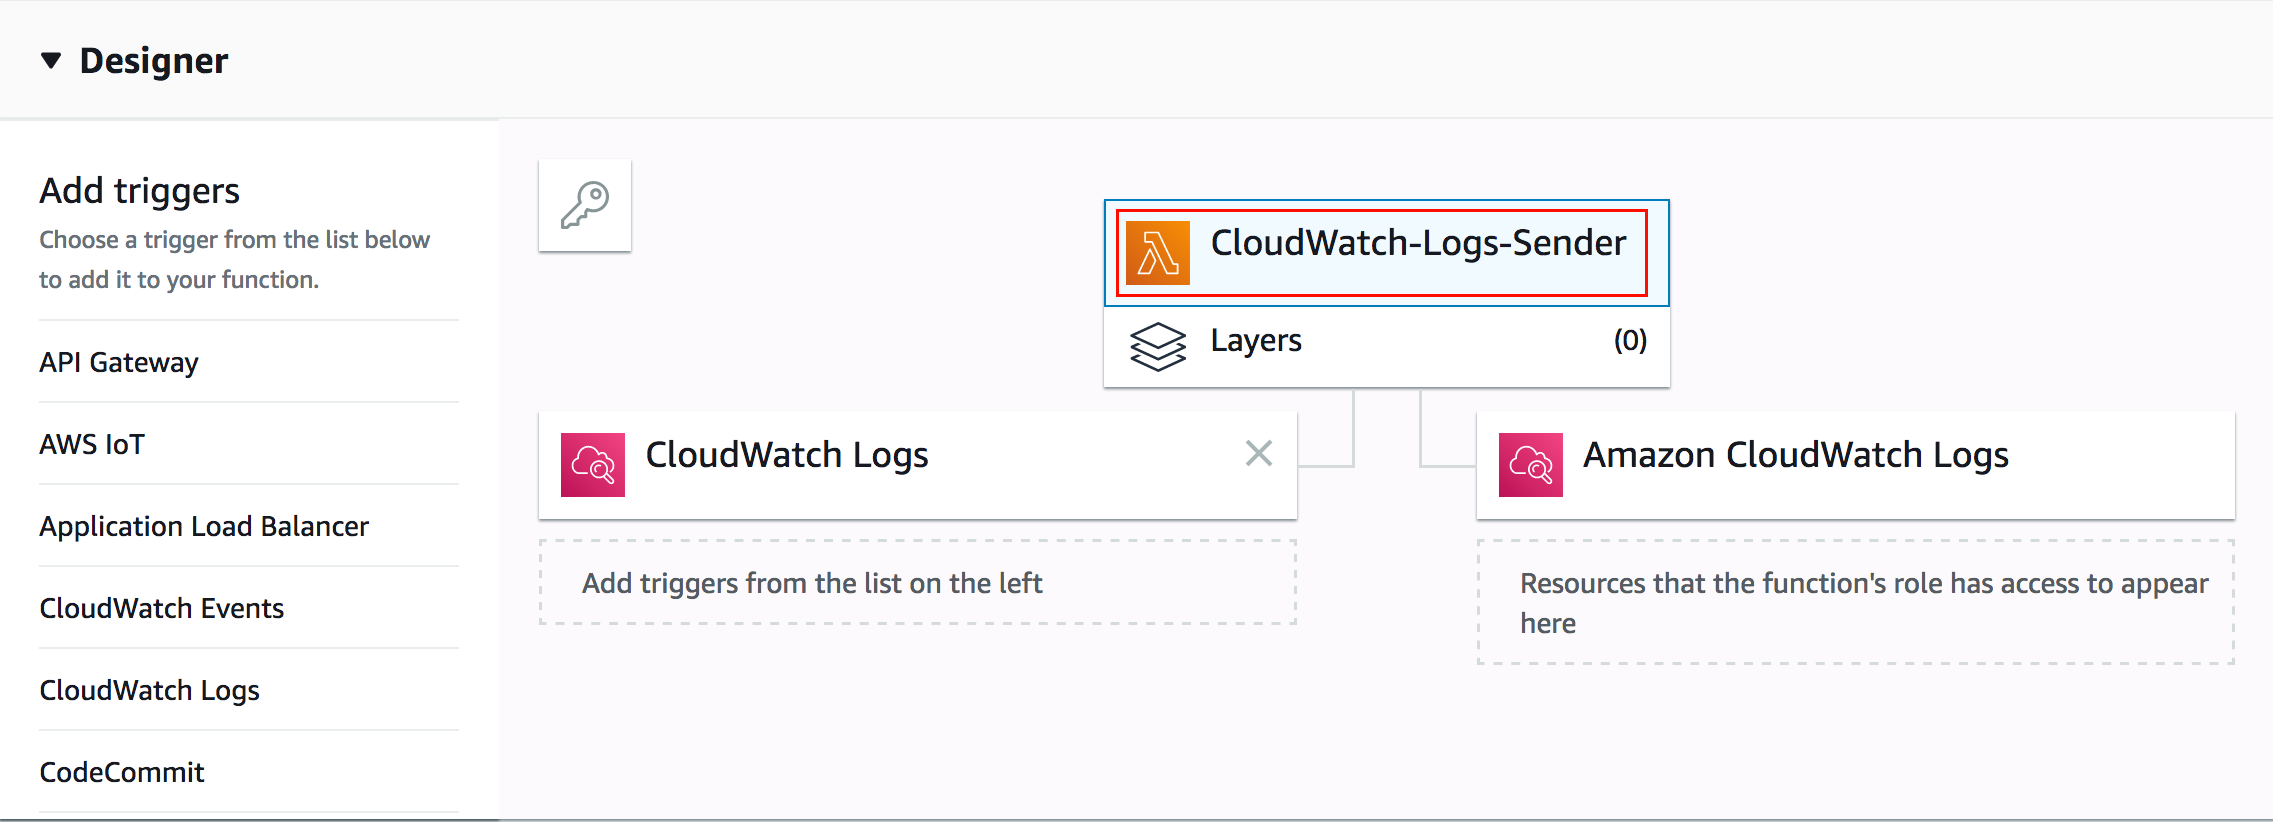
- Scroll to the editor, and place the code provided in the link below:
- After entering the code, navigate to the Site24x7 web client, select Admin > Applogs > Log Profile, then select the created Log Profile, and copy the code that appears on the screen as the input for the variable logTypeConfig under the field Environment variables.
CloudWatch logs dashboard
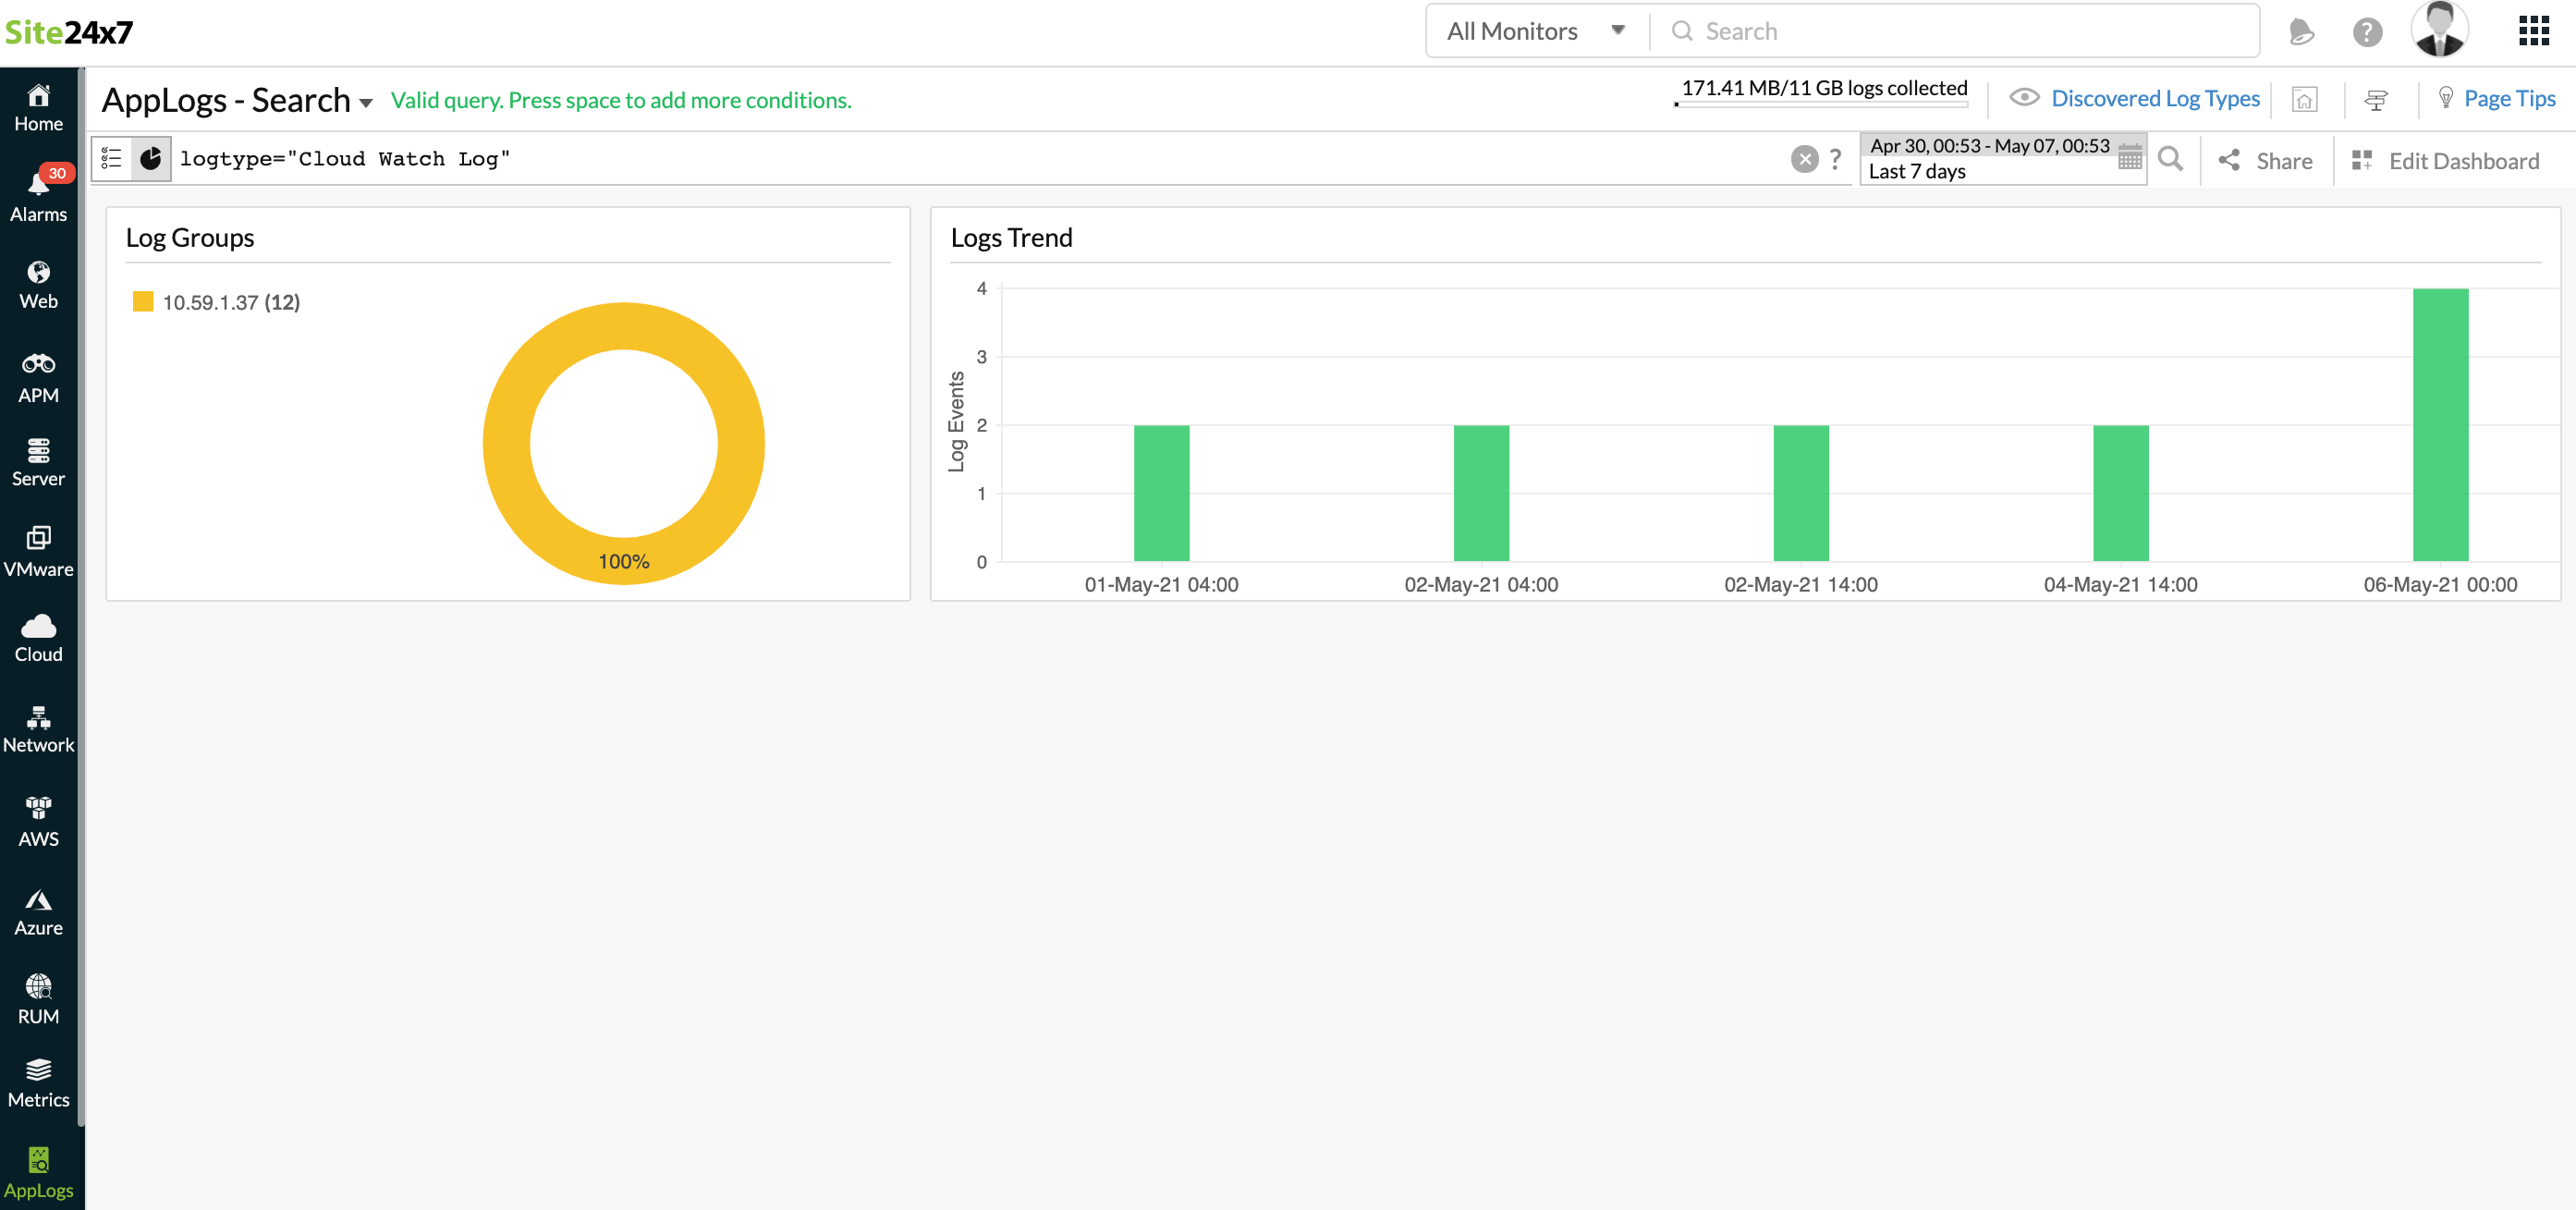
AppLogs creates an exclusive dashboard for every Log Type, and shows a few widgets by default. Here's a list of the widgets available in the CloudWatch logs dashboard:
- Log Groups
- Logs Trend
In addition to the default widgets, your saved searches will also be added to the dashboard automatically.
