Server Monitoring
Site24x7 Server Monitoring is agent-based and the agent needs to be downloaded and installed on every server that needs to be monitored. Also, ensure to always run the latest version of the agent for maximum performance.
- Agent security and release notes
- Add a server monitor
- Bulk installation methods
- Monitor applications
- Plugin integrations
- Server monitoring integrations
- Performance metrics: OS platforms | Applications
- Set thresholds
- Performance reports and dashboards
- IT automation
- Uninstall agent
- Troubleshooting tips
- Licensing
Agent Security and Release Notes
When a software needs to be installed on your servers, it is important to know how secure it is and what is its resource utilization. Also, for best performance, it is recommended to have the latest version of the agent running in your servers.
Add a Server Monitor
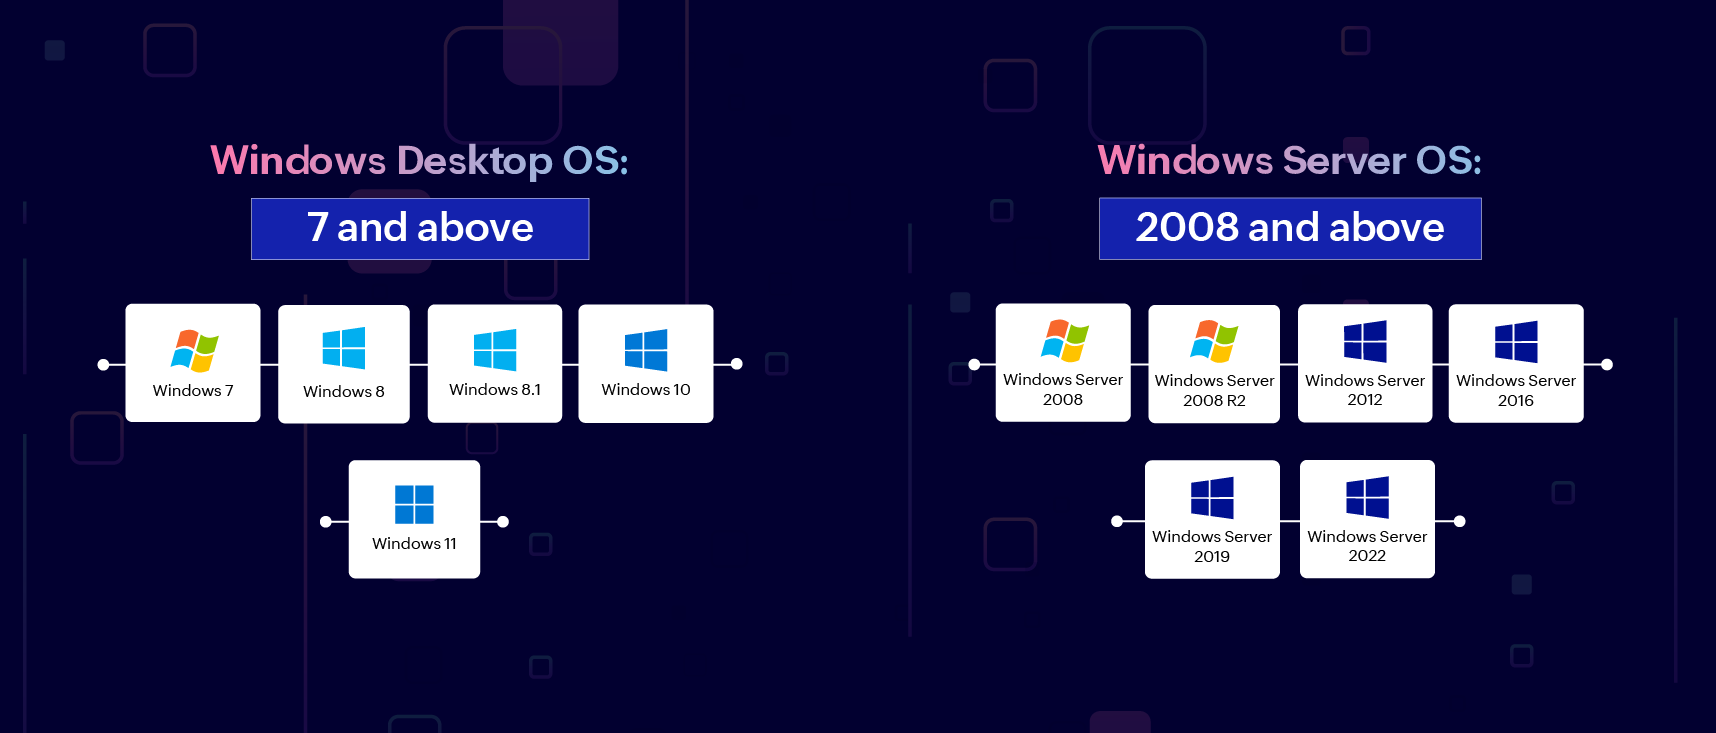
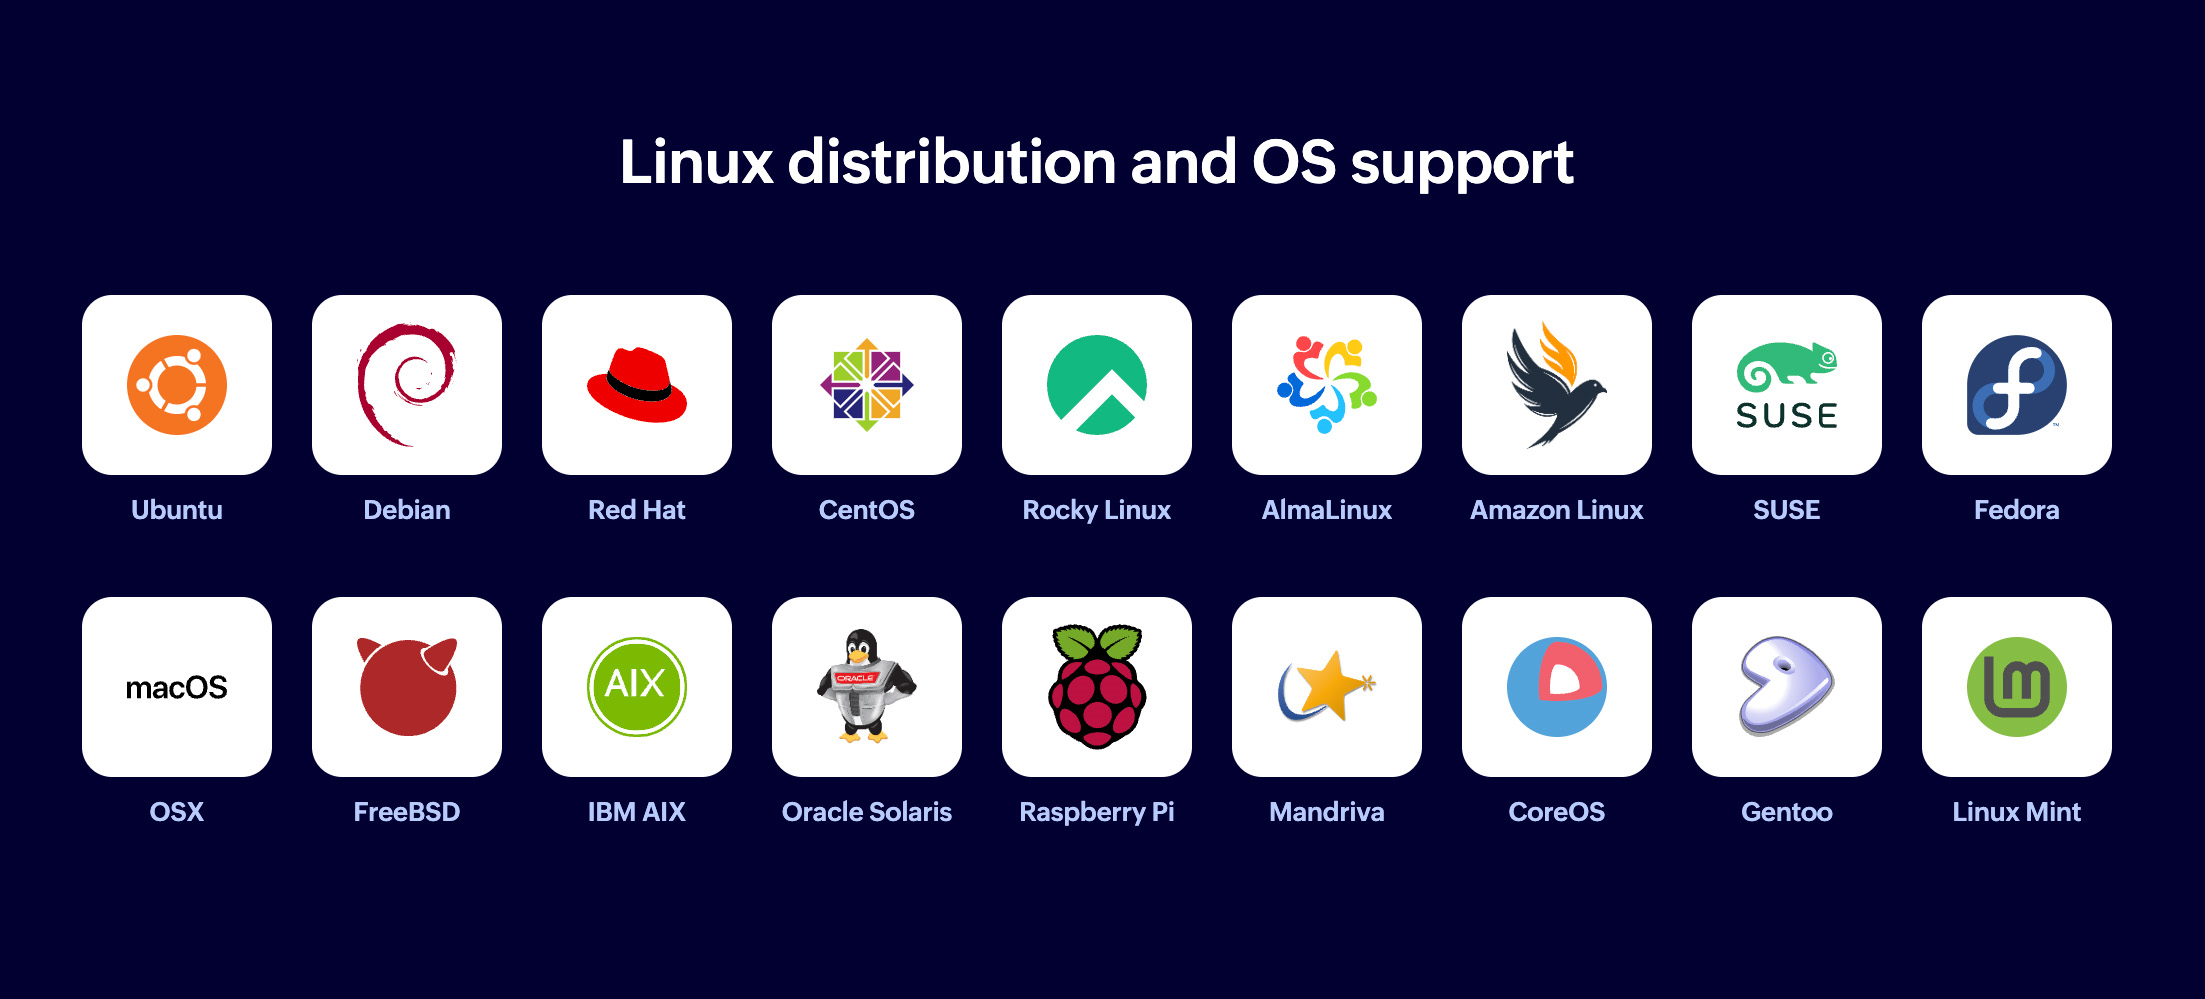
Based on the OS platform, download and install the server monitoring agent and start monitoring your servers and applications.
- Windows - Server OS: 2008, 2008 R2, 2012, 2012 R2, 2016, 2019, 2022 and Desktop OS: Windows 7 and above
- Linux flavours - Debian, Ubuntu, CentOS, RedHat, Madriva, Fedora, Suse, Amazon Linux, Gentoo, CoreOS, Raspberry Pi, ARM Processor, RancherOS, Linux Mint
- Docker
- FreeBSD - 9 and above
- OS X - 10 and above
Bulk Installation Methods
| OS | Bulk Installation Methods |
| Windows | |
| Linux | |
| Docker | |
| Azure VM Extensions |
Monitor Applications
Not just your servers, the server monitoring agents automatically discover and monitor applications running in it.
For Windows, the following Microsoft applications are auto-discovered and added for monitoring:
Go agentless to monitor your Office 365 servers.
For Linux, Docker hosts and containers, Hadoop clusters, and SMART disks are auto-discovered and added for monitoring.
Performance Metrics
From the services and processes running on your servers to the files, directories, and event/syslogs, monitor all resources from one console.
OS Platforms:
Applications:
Performance Reports & Dashboards
The first step in resolving a server downtime is to know the reason behind it. The Root Cause Analysis (RCA) report gives you the reason behind the downtime and the route map analysis to diagnose connectivity issues.
Presenting performance data in easy-to-understand reports and dashboards is important to analyze trends and identify performance degradation issues. In addition to the common reports available for all monitors in Site24x7, some exclusive reports on disk usage, network adapter details, agent inventory, and top n reports for CPU, memory, and disk are available for server monitoring.
While the server inventory dashboard gives a quick count of all the servers, applications, resource checks, and plugins in your environment, the server health dashboard lists down the top servers based on CPU, memory, network, and disk usage. In addition, you can also create your own dashboard and view data the way you want.
Plugin Integrations
Not just servers and applications, you can monitor your entire IT environment with our ready-to-install plugin integrations. If you don't find what you're looking for, build your own plugin. Like servers, you can set thresholds and be alerted when they exceed.
Server Monitoring Integrations
Integrate the server monitoring agent with Azure VMs, Amazon EC2 instances, and VMware virtual machines.
IT Automation
Automate repetitive manual tasks and integrate tools, people, processes, and more. Add an automation.
Add Thresholds
Once you have added a server monitor or any of the Windows/Linux application monitors, define threshold values for each of the performance metrics monitored and be instantly notified when there is a breach.
Uninstall Agent
Based on the OS platform, follow the steps given to uninstall the Linux, FreeBSD, and MacOS agents.
Troubleshooting Tips
Having trouble with the agent or using any of our features? Check out our FAQs for easy troubleshooting.
Licensing
A server monitor consumes two basic monitor licenses. Know what you can get for each server monitor configured. Also, have a look at the performance metrics provided for one Windows or Linux monitor.