CloudWatch and Server agent integration for EC2 instances
Introduction
Go beyond the limitations of CloudWatch and remove the silo approach of monitoring EC2 instances, all in one go. Our Enhanced EC2 monitoring combines infrastructure measures from CloudWatch with agent driven application and system metrics to solve the complexities of your dynamic EC2 environment in a much more efficient manner. Some notable enhancements:
- While defining an action in configuration rules, along with the EC2 actions, view all the server actions when the EC2 instance is integrated with the standalone server agent.
- Utilize the actions applicable for both EC2 and the server agent. When both are integrated, the AWS tags (System tags) applicable at the EC2 monitor will be mapped with the server monitor. When they are disintegrated, the tags will be unmapped from the server monitor only.
- See all your EC2 related performance metrics, both CloudWatch and agent driven system and application metrics in the same unified dashboard.
- Charting and graphs for CPU, memory, system load, idle/busy time and EBS disk utilization can be seen with the CloudWatch data charts
- Two different threshold profiles, one pertaining to agent metrics and other pertaining to CloudWatch metrics, can be associated to the Integrated EC2 instance monitor.
- Combining the EC2 metadata from the native CloudWatch integration with the system level performance counters will help you solve the inherent efficiencies associated with both CloudWatch and standalone server agents.
- The ability to differentiate between intentional instance termination and instance crash
- Contextual alerting in the event of Auto-scaling instance termination or during agent network communication failure.
Unified monitoring for EC2 instances
- Enable EC2 CloudWatch and server agent integration
- Enhance your EC2 monitoring by deploying an agent on the instance
- Connect your existing EC2 CloudWatch monitor with the server monitor
- UI pages for the integrated EC2 instance monitor
- Agent Threshold Profile configuration
Enable EC2 CloudWatch and server agent integration
Connect your AWS account
To enable this integration, you need to first connect your AWS account with Site24x7. This can be done either by creating Site24x7 as an IAM user or by creating cross-account IAM role between your AWS account and Site24x7's AWS account. Site24x7 leverages the CloudWatch API and discovers all your available EC2 instances running in each availability zone and creates an EC2 CloudWatch monitor for each running EC2 instance.
- To enable access to your AWS account
- To connect your AWS account and create your AWS EC2 CloudWatch monitor
Server agent deployment
Next you will have to install the agent on the instance. Once the agent gets deployed, all the agent generated system and application metrics will be seen in the integrated EC2 instance monitor UI. Currently the integration is supported for Windows and Linux based EC2 instances. To know more about the agent version compatibilities and installation steps, read our agent installation document given below.
Installation
To view the data , navigate to the integrated EC2 instance monitor UI (AWS >"Monitored AWS account" > EC2 instnace > Select the EC2 instance)
Licensing
As far as licensing is concerned, the integrated EC2 instance monitor (an EC2 CloudWatch monitor with the server agent deployed) will be considered as two basic monitors. For example, if you are using 12 basic monitors out of the 30 active monitors available, 11 will be EC2 instances and one will be an integrated monitor. You can view this by hovering on the tool tip of Basic Monitors in the AWS > Monitor Status page.

Enhance your EC2 monitoring by deploying an agent on the instance
If your are currently monitoring EC2 instances via our CloudWatch API integration, then you can extend your monitoring capabilities by deploying our server agent on the instance. Once the agent gets deployed, the integration will automatically start to add system level attributes like memory, disk usage, application metrics (via plugins) and other agent generated metrics to the existing CloudWatch data. So you get to view all your agent driven metrics along with the CloudWatch data from the integrated EC2 instance monitor UI.
Installation
To view the data , navigate to the integrated EC2 instance monitor UI (AWS >"Monitored AWS account" > EC2 instnace > Select the EC2 instance).
(Important!) Automatic integration
Going Forward, this integration will be handled automatically in the Site24x7 console. For example, imagine a scenario where you are monitoring a group of 5 EC2 instances via our CloudWatch integration. To gain more insight into the performance, you decide to deploy the agent on the instance. Once done, all the agent generated data and dashboard tabs like CPU, memory, plugins, disk utilization, resource checks etc,. will be ported to the integrated EC2 instance monitor UI. (The normal behaviour of server monitor creation will not occur)
This is applicable vice versa as well , where you are currently monitoring EC2 instances standalone with our server agents and decide to connect your AWS account with site24x7. Once done, all the monitoring data from the existing server monitor(metrics, configuration profiles and thresholds) will be ported to the newly created integrated EC2 instance monitor and once that is done, the server monitor will cease to exist.
To view the data , navigate to the integrated EC2 instance monitor UI (AWS >"Monitored AWS account" > EC2 instnace > Select the EC2 instance). Consider a case where there is an EC2 Instances, and you have to install a server agent on it. When you specify the monitor group name by using the GN parameter, the EC2 Instance will be added under the same monitor group.
During integration, monitor groups and any maintenance for EC2 monitors are mapped to server monitors. But, during the maintenance state of an EC2 monitor, no server integration is allowed.
Connect your existing server monitor with the EC2 instance CloudWatch monitor
Current users who are monitoring EC2 instances using both our CloudWatch API integration and server agents can integrate the two monitors into a single unified EC2 instance monitor. To know more, refer our product documentation.
UI pages for the integrated EC2 instance monitor
Depending on the type of instance, the integrated EC2 instance monitor will have additional dashboard tabs, charts and graphs, pertaining to attributes like memory, disk utilization etc. To learn more, please refer our product documentation
You can collect your logs for monitoring with the Site24x7 AppLogs.
Agent Threshold Profile configuration
To set a threshold profile for an agent to be integrated, you can follow either method 1 or 2 below. Method 3 explains how to configure a threshold profile for an agent that is already integrated.
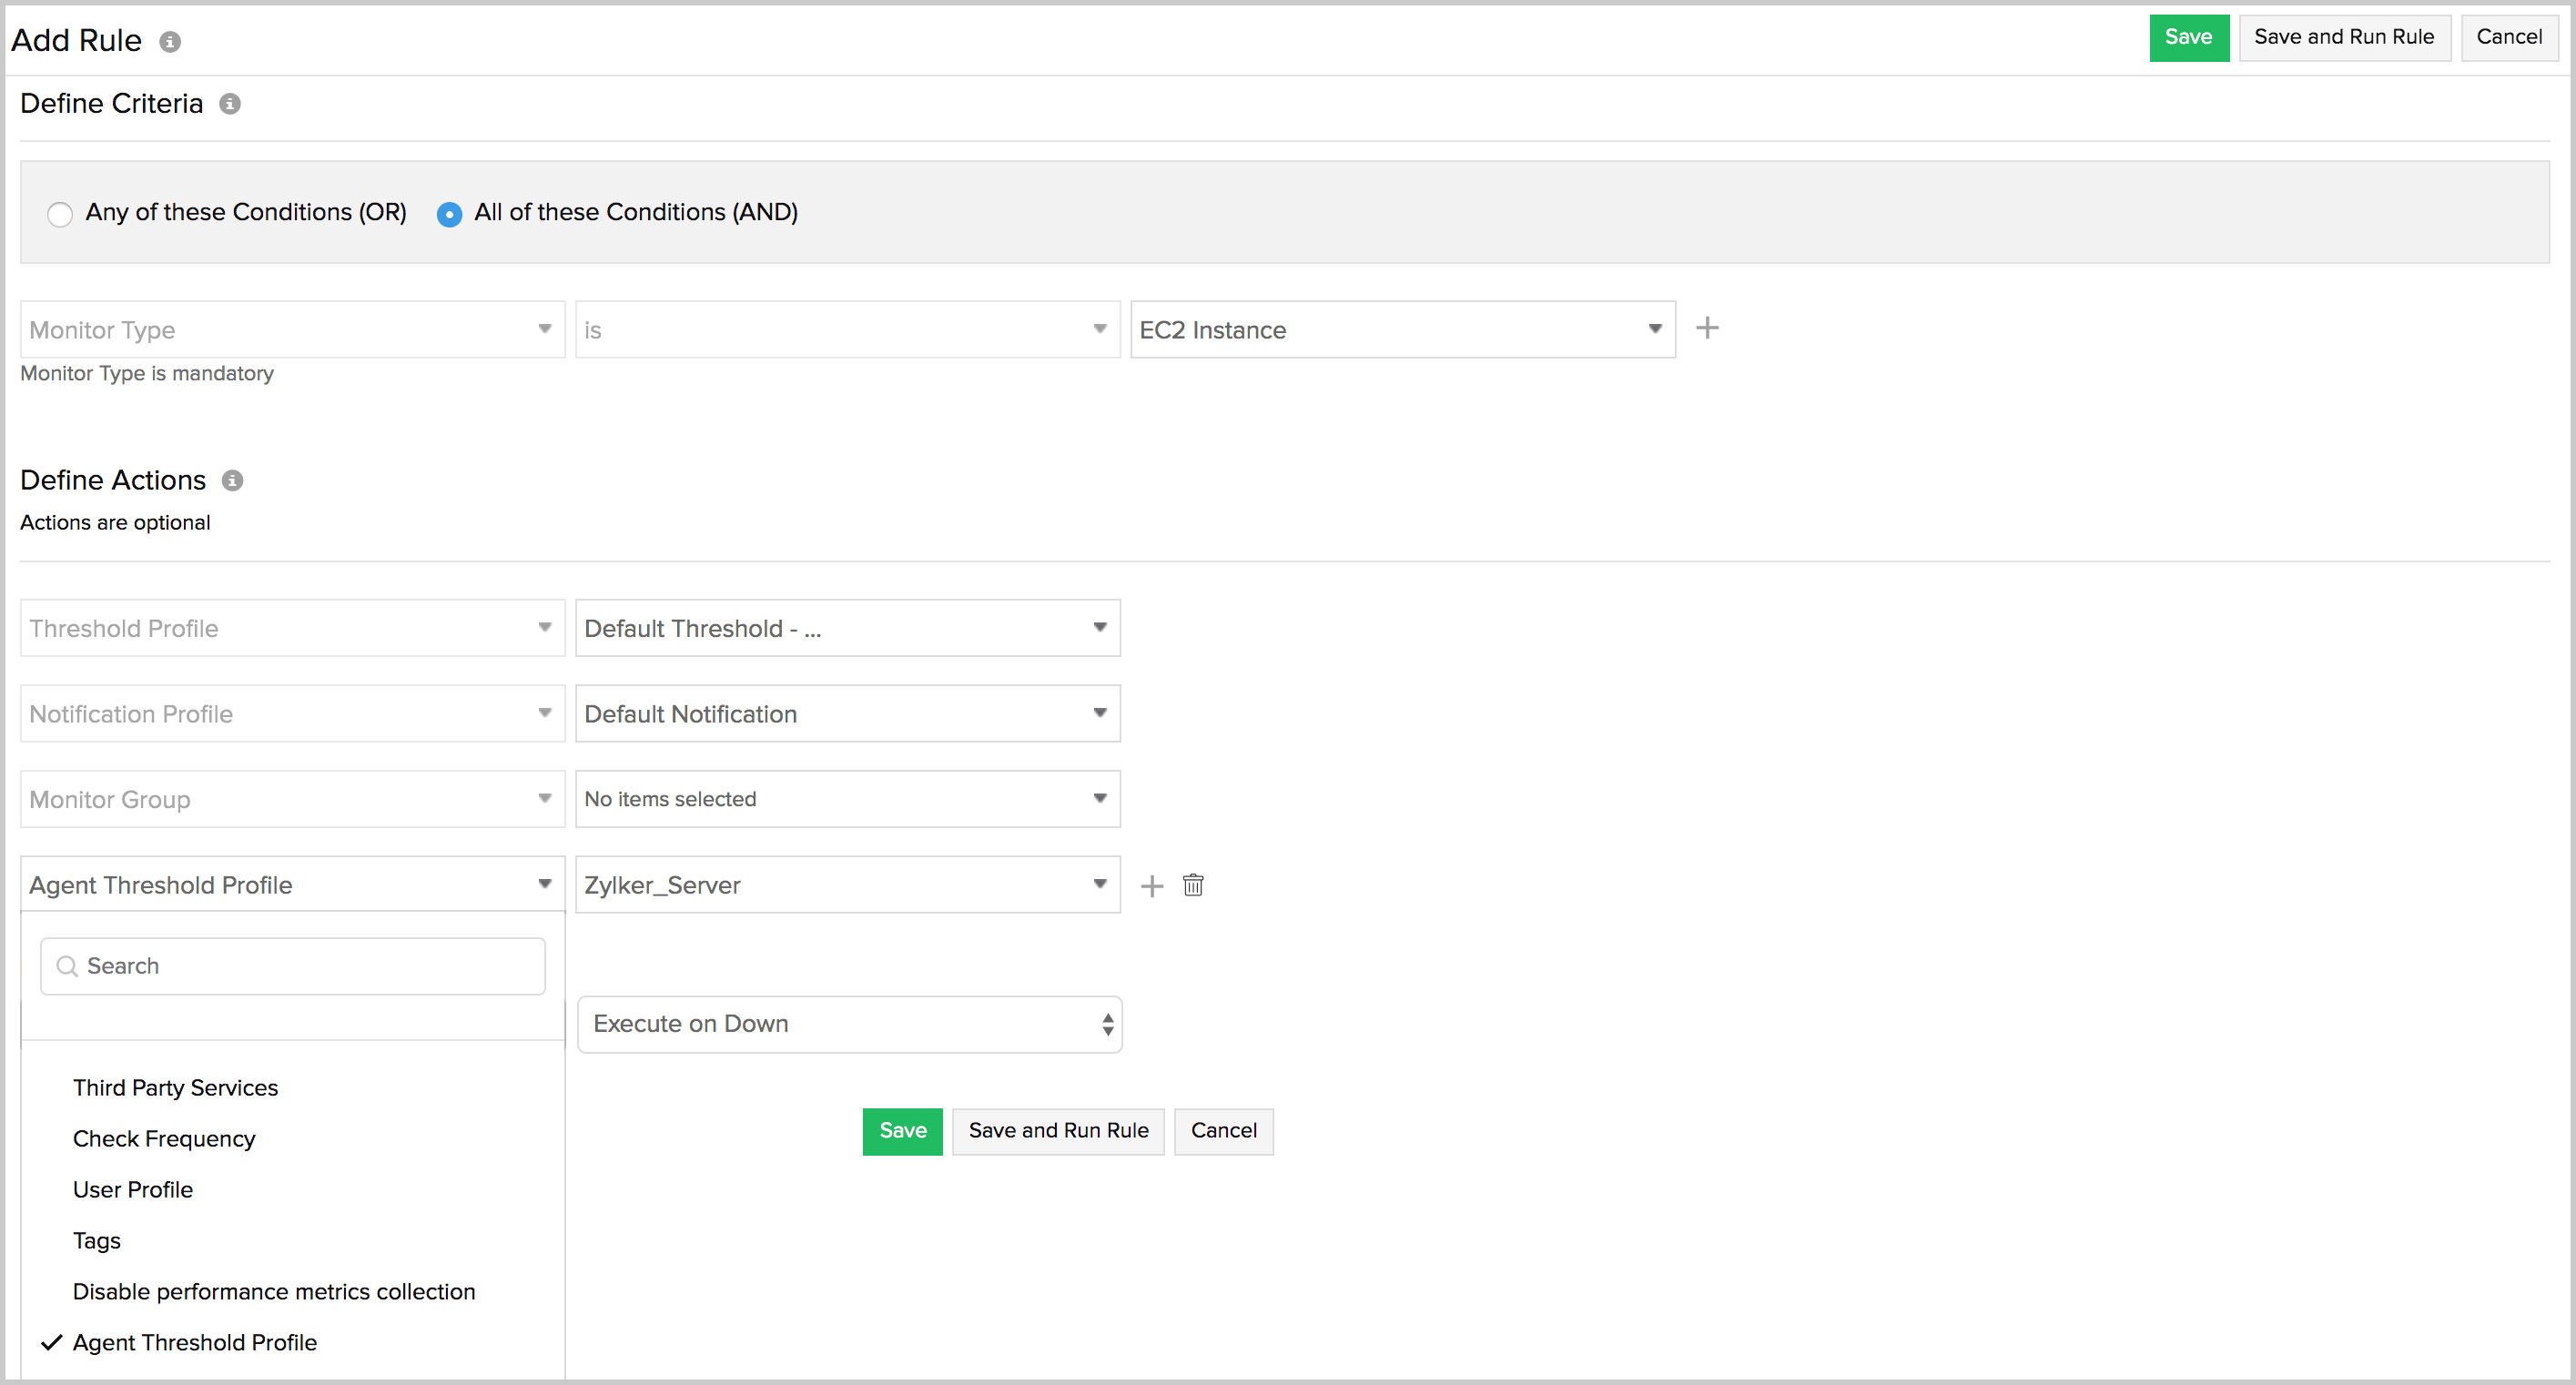
1. Add a Configuration Rule
Follow the initial steps for adding a Configuration Rule listed here. Select the monitor type as an EC2 Instance. When you define an action from the drop-down menu, select Agent Threshold Profile, and choose the desired threshold profile to be configured for a server.
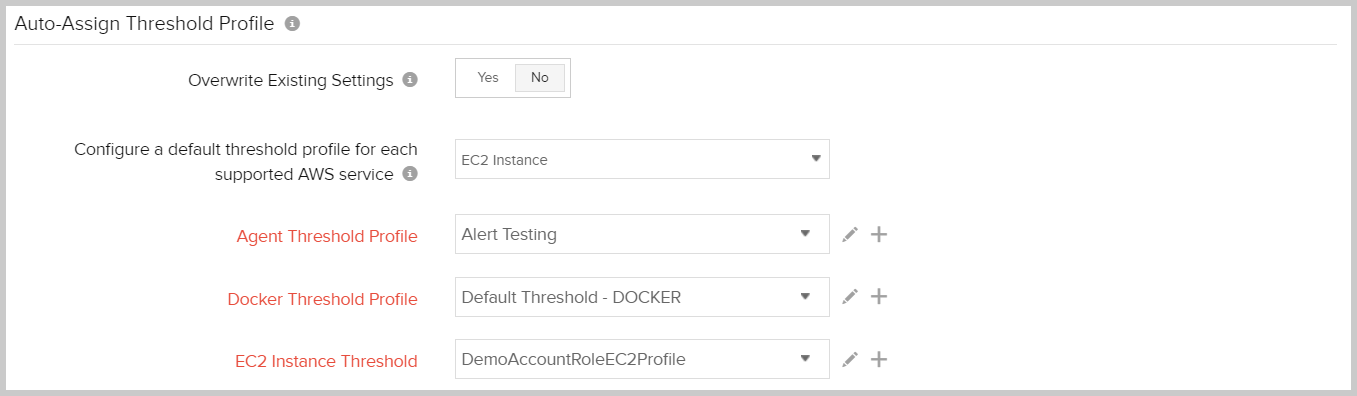
2. Auto-Assign Threshold Profile in Advanced Configuration
In the Advanced Configuration section of an Amazon Web Services (AWS) monitor, navigate to Auto-Assign Threshold Profile. Select EC2 Instance as your desired service. Choose the desired threshold profile from the drop-down menu beside Agent Threshold Profile.
3. Editing a monitor
To configure a threshold profile for a server monitor that is already integrated, you can edit the monitor, and follow the steps below:
- In the Site24x7 console, navigate to the Edit Monitor Details page of the integrated EC2 Instance monitor.
- Under the Configuration Profiles option, navigate to Agent Threshold Profile, where you can choose the desired threshold profile for a server from the drop-down menu.
-
On this page
- Introduction
- Unified monitoring for EC2 instances
- Enable EC2 CloudWatch and server agent integration
- Enhance your EC2 monitoring by deploying an agent on the instance
- Important Automatic integration
- Connect your existing server monitor with the EC2 instance CloudWatch monitor
- UI pages for the integrated EC2 instance monitor
- Agent Threshold Profile configuration