Site24x7 Server Monitoring (Agent Based)
Monitor your servers with our light weight, easy-to-install agent. Stay ahead of outages and performance degradation issues with over 60 performance metrics, intuitive dashboards, RCA, IT Automation, and instant alerting mechanisms.
- Agent architecture - U.S. data center
- Resource consumption by the agent
- Agent security
- OS and features
- Plugin integrations
- Reports, dashboards, & IT Automation
- Troubleshooting tips
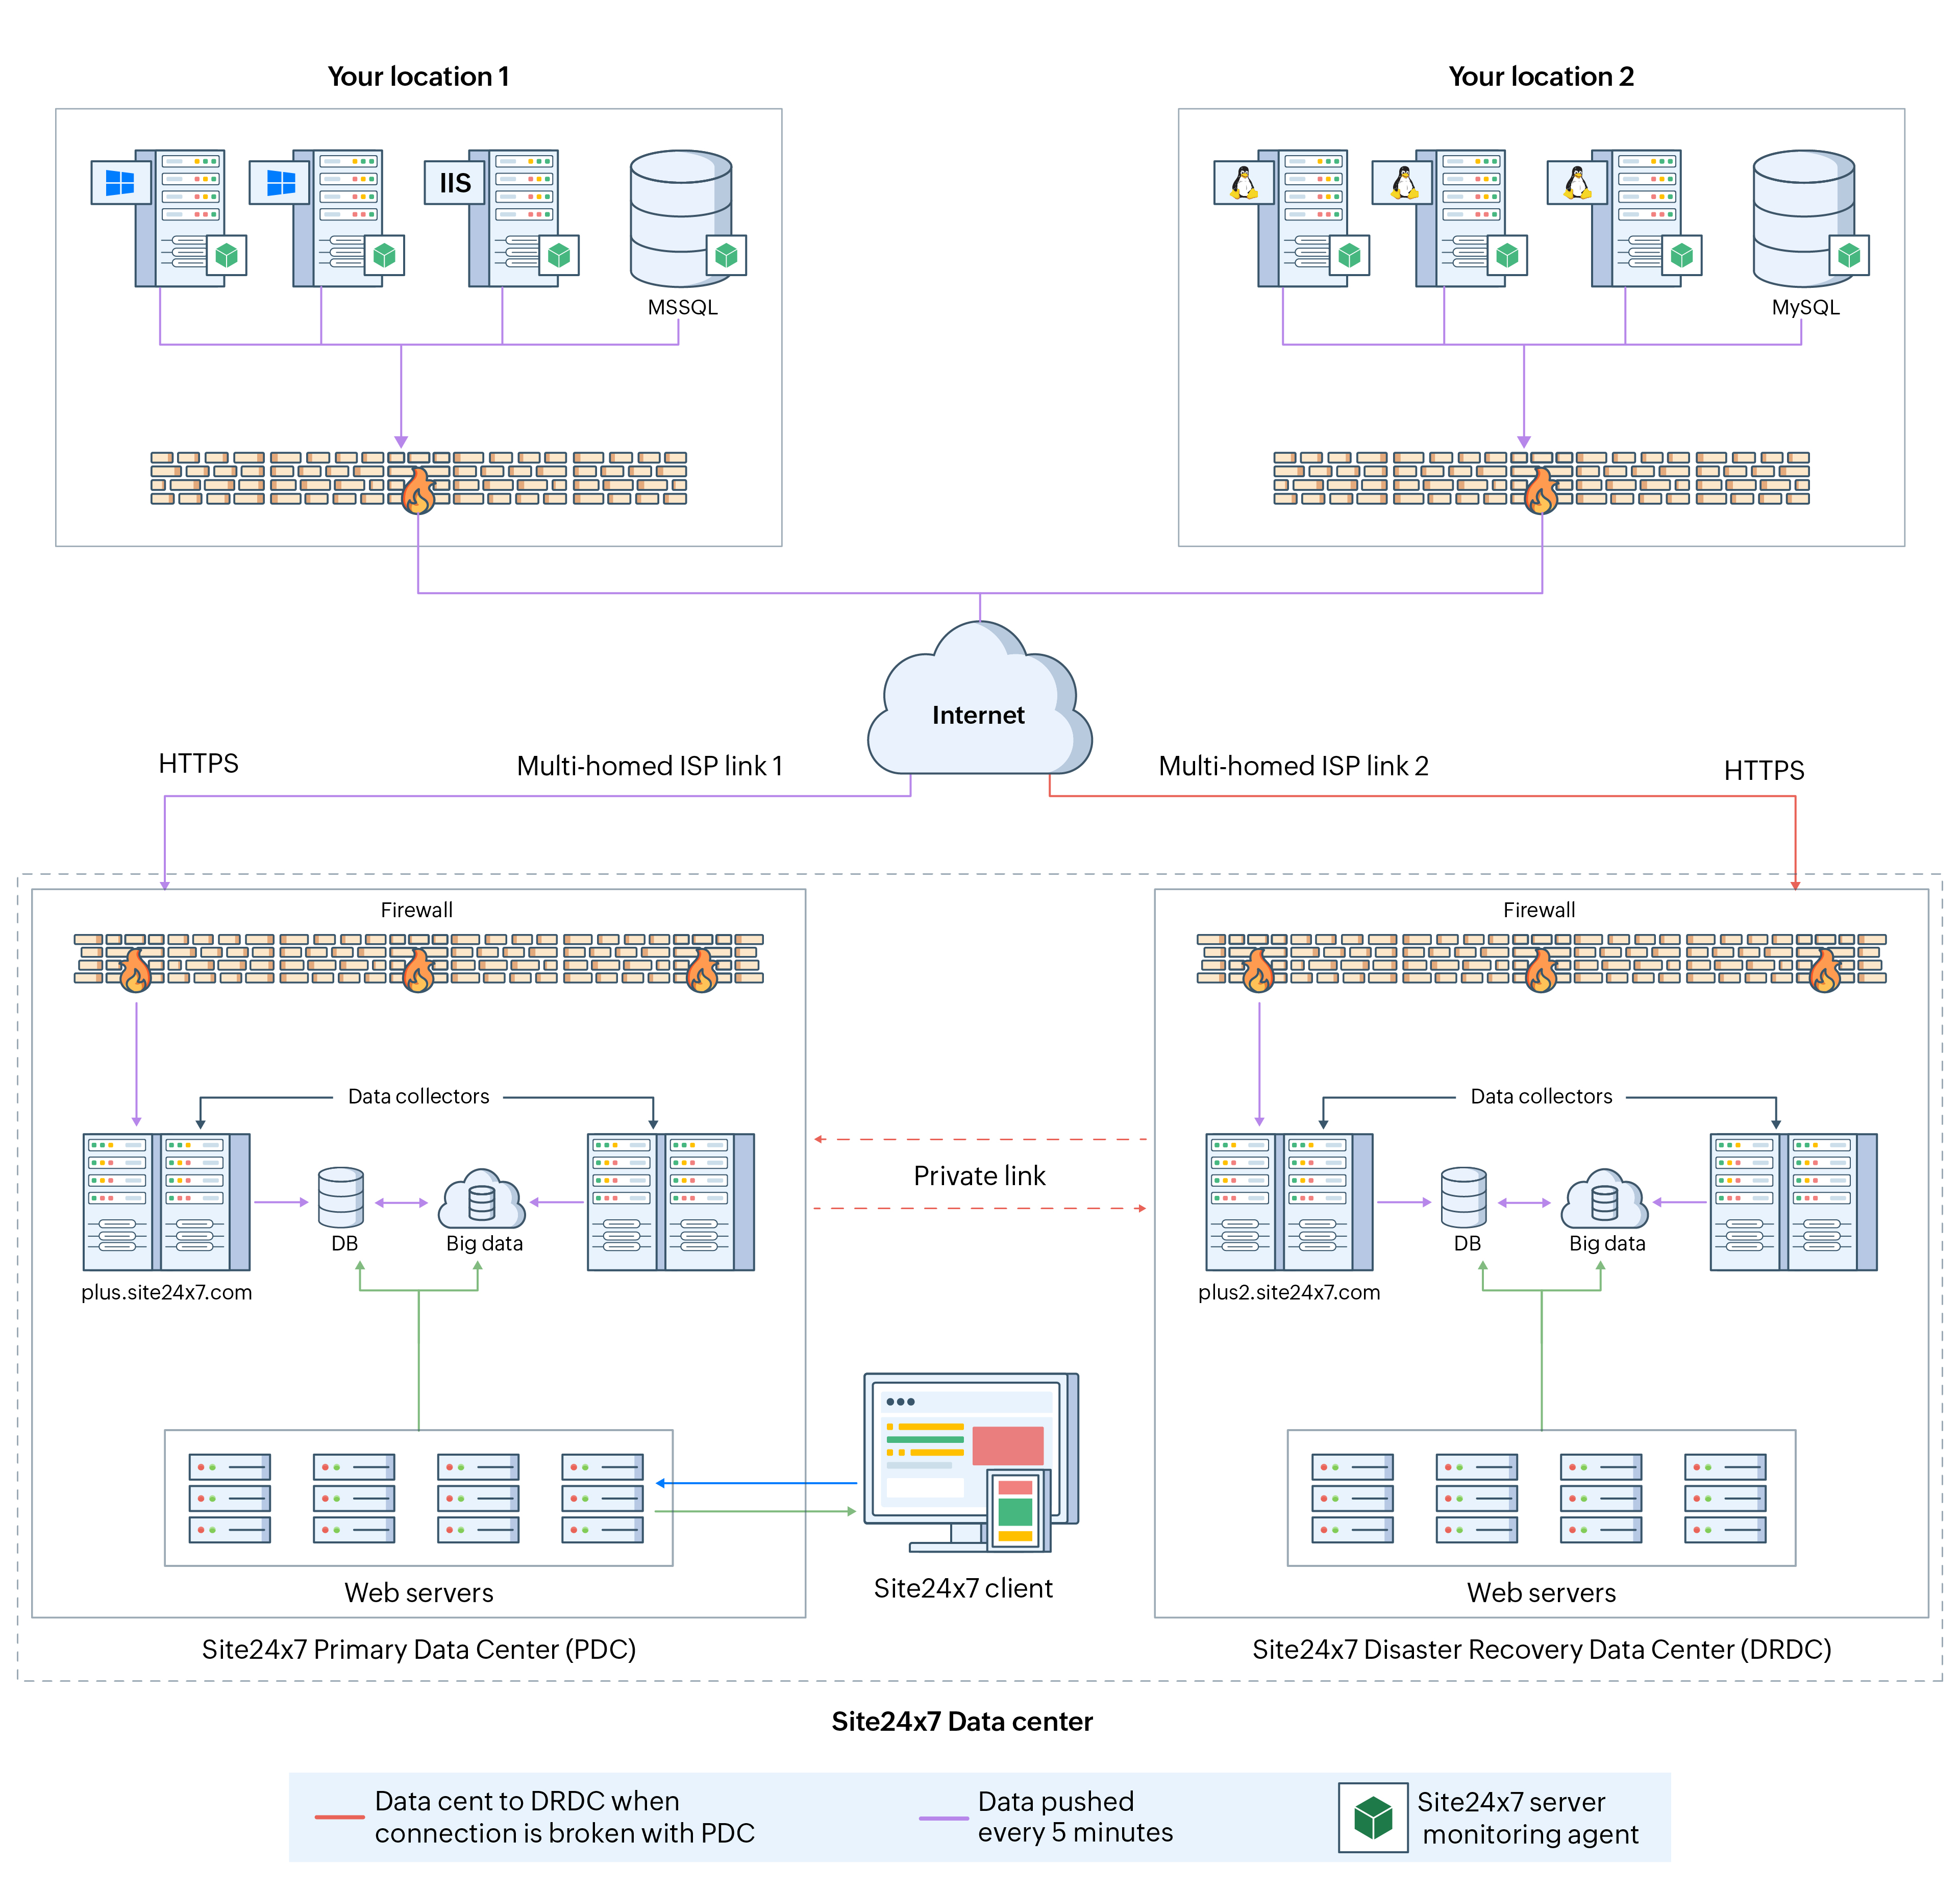
Learn how our server monitoring agent collects and displays data via three (one primary and two secondary) data centers, set up at different locations to ensure monitoring services remain uninterrupted in the event of a data center failure.
- Primary Data Center (PDC) - plus.site24x7.com
- Disaster Recovery Data Center (DRDC) - Primary (plus2.site24x7.com) and Secondary (plus3.site24x7.com)
In case of any error in the PDC, status information via heartbeat check is automatically sent to the Primary DRDC, thus avoiding false alerts due to intermittent network failure. If there occurs an error in the Primary DRDC, the Secondary DRDC will still receive the heartbeat check to ensure continued monitoring. Server shutdowns under normal circumstances is clearly communicated by the agent to our data centers.

Data collection
Once the agent is successfully installed in the user machine, its communication to the PDC is initiated using a one-way HTTPS connection. The agent collects and sends three types of data.
- Heartbeat check: Performed every minute. Sends alerts if no data is received for seven minutes by default.
- Server metrics: Collected based on user-set intervals (one minute to one day). Data is pushed to data centers every five minutes. In case of network failure, data is stored in ZIP files and sent as backlogs when connectivity is restored.
- Device messaging system: Collects real-time data for actions like starting or stopping a process along with agent upgrades.
Heartbeat Check:
This is a status information check done every minute by the agent to the PDC. The server's uptime is decided by how long it's been since Site24x7 received a heartbeat check from the agent running on your server. If the agent is unable to communicate with the PDC, it will try contacting the primary DRDC and then the secondary DRDC.
If the heartbeat check has not occurred for a continuous time interval of seven minutes, the Server Availability Watcher will alert the user about possible network communication failure or system crash. You can also customize this time interval in the Admin > Server Monitor > Settings page and set an appropriate value for Set Threshold for Heartbeat Check. Learn more.
For the other data centers (AU, IN, CN, EU), the agent will communicate with the PDC and in case of a connection failure, it will contact the primary DRDC. For the complete list of domains in the other DCs, refer this document.
Data Collection with a Polling Interval of One Minute:
The server monitoring agent will collect data every minute, consolidate it and communicate it to the Site24x7 data center every five minutes. Only in case of any threshold violation, the agent will immediately communicate to the data center and trigger an alert to the user. In addition, you can also set polling interval from a range of 1 min, 2 min, 3 min, 5 min, 10 mins, 15 mins, 30 mins, 1 hour, 3 hours, 6 hours, 12 hours, and one day.
Device Messaging System (DMS):
This ensures real-time communication to the monitored servers. Communication to the DMS happens and the agent performs several actions triggered by the user like starting/stopping a process, discovering a service/process, upgrading the agent, root cause analysis, adding a port, URL, file, directory, and event log/syslog checks.
Before reporting an outage, Site24x7 checks the availability status of its own internal network by performing a Network Sanity Check. This is to make sure that it is the resource that's down and not its network. Check out the possible outage scenarios and steps to troubleshoot them.
Agent's average resource consumption
The Site24x7 Linux Server monitoring agent v19.2.0 underwent resource consumption testing on a basic Linux server with a 1-core Intel i7 processor, 4GB RAM, and 100GB disk space. The results were as follows:
- 0.6% CPU utilization
- 200MB of memory utilized (RSS)
- 500MB of disk space occupied
- Maximum 1500 Bytes/s network bandwidth consumed
- 120 calls to Site24x7 data center per hour
Similarly, Windows server monitoring agent v20.6.0 was tested on a basic Windows Server 2019 Datacenter edition with a 1-core Intel Xeon Platinum 2.6GHz processor and 4GB RAM. The results were as follows:
- 0.15% CPU utilization
- 150MB of RAM utilized (to monitor one Windows application and three plugins)
- 250MB of disk space occupied
- Maximum 1500 Bytes/s network bandwidth consumed
- 120 calls to Site24x7 data center per hour
Logs generated by the agent
Agent operations are logged and stored in the following OS-specific locations:
- Linux: <Installation_Directory>/site24x7/monagent/logs
- Windows: <Installation_Directory>/Site24x7/WinAgent/Monitoring/Logs
Learn more about the description, maximum size, and the count of each log file here.
Upgrade the agent to the latest version
Upgrade the server monitoring agent either automatically through Site24x7's web-client in the settings page or manually by following our installation procedures. Learn more about our agent upgrade process here.
OS specific agent details and actions
Windows
Agent services
There are five services run by the agent:
- Site24x7 Agent Helper: Manages the Windows agent
- Site24x7 APP Monitoring Agent: Collects application data
- Site24x7 Applog Agent: Collects logs
- Site24x7 Plugin Agent: Integrates plugins
- Site24x7 Windows Agent: The primary Windows server monitoring agent
Supported OS versions
- Windows: 7 and above
- Windows Server: 2008 and above
Agent actions
Perform agent actions from the system tray. Open the system tray to find the Site24x7 icon. Right click to perform the following agent actions:
- View agent logs
- Perform connectivity check
- Access troubleshooting tips
- Start agent
- Stop agent
- Restart agent
- View the proxy configuration
- View agent details
- View agent status
- Bulk install the server monitoring agent
Linux
Agent processes
There are four services run by the agent:
- Agent Watchdog: Manages the Linux agent
- Applog Agent (optional): Collects logs when AppLogs is enabled
- Metrics Agent (optional): Runs when StatsD and Prometheus are enabled for monitoring
- Linux Agent: The primary Linux server monitoring agent
Supported Linux flavors
| Linux OS flavor | Versions supported |
|---|---|
| Ubuntu | 14.04 and above (x86_64) 16.04 and above (Armv8 64bit) |
| Debian | Debian 7 Wheezy, Debian 8 Jessie, Debian 9 Stretch, and above |
| Red Hat | 6 and above |
| CentOS | 6 and above |
| CentOS Stream | 8 and above |
| Rocky Linux | 8 and above |
| Oracle Linux | 6.8 and above |
| AlmaLinux | 8 and above |
| Amazon Linux | 2 |
| SUSE | SUSE 11 and above, SLES 12 and above, open SUSE 15 and above |
| Fedora | Fedora 26 and above (x86_64) Fedora 27 and above (ARM v8 64bit) |
| OSX | 10 and above |
| FreeBSD | 9 and above |
| IBM AIX | 6.1, 7.1, and 7.2 *** |
| Oracle Solaris | 10 and above (x86_64) *** |
| Raspberry Pi | Feb. 21, 2023 version and later |
| Mandriva Linux | 21.1 and above |
| CoreOS | 37.20230205.3.0 and above |
| Gentoo Linux | 3.0.31 and above |
| *** Indicates that the metrics shown as of now are limited. | |
Agent actions
Perform agent actions from your terminal. Run the following commands for performing agent actions. Replace with the preferred agent action command parameter.
Agent installed as root
- /opt/site24x7/monagent/scripts/AgentManager.sh <option>
Agent installed as non-root
- /<installed_directory>/site24x7/monagent/scripts/AgentManager.sh <option>
| Command parameter | Action performed |
|---|---|
| -ziplogs | Archives the Site24x7 agent logs and stores in the agent's temp directory (<installed_directory>/site24x7/monagent/temp/) |
| -newmonitor | Creates a new monitor for the same UUID/hostname servers |
| -createmonitor | Creates a new monitor for the server monitor deleted in Site24x7 |
| -cpu_sar | Enables SAR utility for monitoring CPU |
| -version | Displays the version of the server monitoring agent |
| -cpu_limit | Sets the maximum CPU utilization the server monitoring agent can utilize |
| -mem_limit | Sets the maximum memory space the server monitoring agent can occupy |
| <option> --view | Displays a report for the specified option |
MySQL monitoring specific actions
| Command parameter | Action performed |
|---|---|
| mysql --add_instance | Adds a MySQL instance for monitoring |
| mysql --update_instance | Updates the MySQL instance's credentials |
| mysql --remove_instance | Removes a MySQL instance from monitoring |
Agent Security
As the agent has to be downloaded and installed on every server that needs monitoring, it is important to understand about its security, its resource usage and the prerequisites for successful installation. Learn more.
OS and Features
Learn more about the platforms supported, the bulk deployment options available for installing the agent in 100's of servers in one go, and the various performance metrics provided for each of these platforms.
Licensing tip: What do I get with each server monitor?
Plugin Integrations
Monitor your databases, applications, web servers, caches, message brokers and keep track of data that matters the most. Take a look at our 100+ out-of-the-box plugins. If you don't find the one you wish to monitor, write your own using Python and Shell script for Linux and VB, Powershell, Batch and DLL for Windows.
Reports, Dashboards, & IT Automation
Receive a detailed root cause analysis report for every server downtime, view your entire server environment in one dashboard, and automate fault resolution with exclusive IT Automation tools.
Troubleshooting Tips
Having a trouble with any of the servers or applications installed? Check our troubleshooting tips.
What's next for you
- Install the server monitoring agent: Windows | Linux | OSX
- Install the server monitoring agent on multiple servers at once (bulk install): Windows | Linux
- Monitor your entire IT infrastructure: Applications | Databases | Kubernetes
- Manage your logs: AppLogs