Amazon EC2 monitoring integration
Amazon EC2 provides resizable compute capacity to help you run and scale business applications in the cloud. With Site24x7's monitoring capabilities, you can monitor your EC2 instances both at the hypervisor level(CloudWatch) and at the system level(Agent).
Overview
Site24x7 supports the below modes of monitoring for Elastic Compute Cloud (EC2) instances:
- CloudWatch EC2 integration: Monitor basic infrastructure measures like CPU usage, disk I/O stats for instance store volumes, network traffic metrics, and CPU credits usage.
- Enhanced EC2 monitoring (CloudWatch integration + Agent based approach): Monitor deep system level metrics like memory utilization, EBS disk usage, CPU steal, process level information and application metrics by deploying our lightweight agent on your EC2 instance.
- Monitor Capacity Reservations: Monitor the on-demand capacity reservations of EC2 instances.
- CloudWatch agent and Amazon EC2 server integration
Setup and configuration
- If you haven't done it already, enable access to your AWS resource by creating Site24x7 as an IAM user or by creating a cross-account IAM role between your account and Site24x7's AWS account. Learn more.
- Next, In the Integrate AWS Account page, please make sure the EC2 Instance checkbox is selected in the Services to be discovered field. Learn more.
Site24x7 will discover only the instances that are in the running state.
Policies and permissions
Please ensure the following read level actions are present in the policy document assigned to the Site24x7 IAM entity. Learn more.
- "ec2:DescribeAddresses",
- "ec2:DescribeInstances",
- "ec2:DescribeSnapshotAttribute",
- "ec2:DescribeInstanceAttribute",
- "ec2:DescribeSnapshots",
- "ec2:DescribeInstanceCreditSpecifications",
- "ec2:GetConsoleOutput",
- "ec2:DescribeImages",
- "ec2:DescribeVolumeStatus",
- "ec2:DescribeAvailabilityZones",
- "ec2:DescribeVolumes",
- "ec2:DescribeAccountAttributes",
- "ec2:DescribeElasticGpus",
- "ec2:DescribeInstanceStatus",
- "ec2:DescribeVpcs",
- "ec2:DescribeFlowLogs",
- "ec2:DescribeNatGateways",
- "ec2:DescribeSubnets",
- "ec2:DescribeVpcEndpoints",
- "ec2:DescribeVpnConnections",
- "ec2:DescribeVpcPeeringConnections",
- "ec2:DescribeRouteTables",
- "ec2:DescribeNetworkAcls",
- "autoscaling:DescribeAutoScalingInstances",
- "autoscaling:DescribeAutoScalingGroups"
For capacity reservation,
- "ec2:DescribeAddresses",
- "ec2:DescribeCapacityReservations",
- "ec2:DescribeInstances",
- "ec2:GetCapacityReservationUsage"
Polling frequency
Basic infrastructure measures are collected as per the poll frequency set (1 minute to one day), by querying the CloudWatch API. learn more.
Supported configuration tags
Configuration tags are labels, typically consisting of key-value pairs, that are used to identify, categorize, and manage configuration details of EC2 resources. They can significantly enhance the IT automation and maintenance scheduling by enabling targeted, efficient, and flexible workflows.
The supported configuration tags for EC2 monitoring are given below:
- aws_instance_id: EC2 Instance ID
- aws_region: Resource region
- aws_ipaddress: Public IP Address of EC2 Instance
- aws_instance_type: Instance type of EC2
IT automations
You can add automations for the AWS services supported by Site24x7. Log in to Site24x7 and go to Admin > IT Automation Templates (+) > Add Automation Templates. Once automations are added, you can schedule them to be executed one after the other.
You can now start, stop, stop with hibernate, and reboot EC2 instances using Amazon EC2 automations.
Resource-Level Topology
The Topology View tab in the EC2 integrated monitor delivers a live, resource-centric dependency map. It dynamically traces how your EC2 resource is connected to its surrounding AWS infrastructure in real time, enabling faster root cause isolation when alerts fire. If any connected component is in a critical state, it is marked accordingly within the topology view, along with the outage reason, so engineers can pinpoint the exact failure point without needing to navigate away from the monitor page. Unlike account-wide topology views, this tab scopes visualization to a single resource, answering the precise question: What does this EC2 monitor connect to, and what breaks if it does? You can trace the full dependency chain from the individual resource up through its primary parent entities to the Service type, Region, and AWS account levels.
Security findings
Fortify your Amazon EC2 instances against cyber attacks by integrating Amazon Inspector and EC2; and Amazon GuardDuty and EC2 in a single console. Inspector and GuardDuty findings for Amazon EC2 can be grouped according to its severity level. The group by feature lets you sort the severity categories and lists the corresponding Rules Package Name and comments if any.
In addition to adding these threshold configurations for your monitored EC2 instance, you can also choose to set thresholds and get notified for:
- Security findings based on the severity level like high, low, medium, informational, or total count under the Inspector/GuardDuty threshold configuration.
- Accelerator configurations like GPU memory utilization, accelerator memory usage, and accelerator utilization.

Supported metrics for CloudWatch EC2 integration
CPU credit metrics
| Attribute | Description | Statistics | Data type |
|---|---|---|---|
| CPU credit usage | Measures the number of consumed CPU credits consumed by the instance | Average | Count |
| CPU credit balance | Measures the number of earned CPU credits accrued by the instance | Average | Count |
| CPU surplus credit balance | Measures the number of surplus credits that have been consumed by the T2 unlimited instance. | Average | Count |
| CPU surplus credits charged | Measures the number of consumed surplus credits that are not paid down by earned CPU credits | Average | Count |
Resource usage metrics
| Attribute | Description | Statistics | Data type |
|---|---|---|---|
| CPU utilization | Measures the percentage of allocated CPU units that are currently in use by the instance. | Average | Percent |
| Disk read ops | Measures the number of completed read operations on all your instance volumes. | Average | Count |
| Disk write ops | Measures the number of completed write operations on all your instance volumes. | Average | Count |
| Disk read bytes | Measures the bytes read from all instance store volumes. | Average | Bytes |
| Disk write bytes | Bytes written to all instance store volumes. | Average | Bytes |
| Network in | Measures the number of bytes received on all network interfaces. | Average | Count |
| Network out | Measures the number of bytes sent out all network interfaces. | Average | Count |
| Network packets in | Measures the number of packets received on all network interfaces. | Average | Count |
| Network packets out | Measures the number of packets sent out all network interfaces. | Average | Count |
| Metadata No Token | The number of times the instance metadata service was successfully accessed using a method that does not use a token. | Sum | Count |
EBS metrics for Nitro-based instances
| Attribute | Description | Statistics | Data type |
|---|---|---|---|
| EBS Read Ops | Completed read operations from all Amazon EBS volumes attached to the instance in a specified period of time. | Average | Count |
| EBS Write Ops | Completed write operations to all EBS volumes attached to the instance in a specified period of time. | Average | Count |
| EBS Read Bytes | Bytes read from all EBS volumes attached to the instance in a specified period of time. | Average | MB |
| EBS Write Bytes | Bytes written to all EBS volumes attached to the instance in a specified period of time. | Average | MB |
| EBS IO Balance Percent | Provides information about the percentage of I/O credits remaining in the burst bucket. | Average | Percentage |
| EBS Byte Balance Percent | Provides information about the percentage of throughput credits remaining in the burst bucket. | Average | Percentage |
Volume metrics
The supported volume metrics for EC2 instance are provided here.
Accelerator metrics
Elastic Inference metrics
Amazon Elastic Inference (EI) is a resource you can attach to your Amazon EC2 instances to accelerate your deep learning (DL) inference workloads. Monitor the connectivity and performance of your Elastic Inference connected to your EC2 Instance.
| Attribute | Description | Statistics | Data type |
|---|---|---|---|
| Accelerator Health Check | Reports whether the Elastic Inference accelerator has passed a status health check in the last minute. A value of zero (0) indicates that the status check failed. A value of one (1) indicates a status check passed. | Minimum | Count |
| Accelerator Connectivity Check | Reports whether connectivity to the Elastic Inference accelerator is active or has failed. A value of zero (0) indicates a connection failure. A value of one (1) indicates a successful connection. | Minimum | Count |
| Accelerator Memory Usage | Measures the memory of the Amazon Elastic Inference accelerator. | Sum | Bytes |
Elastic Graphic metrics
Amazon Elastic Graphics provides flexible, low-cost, and high performance graphics acceleration for your Windows instances. Monitor the connectivity and performance of your Elastic Graphics accelerator connected to your EC2 Instance.
| Attribute | Description | Statistics | Data type |
|---|---|---|---|
| GPU Connectivity Check | Reports whether connectivity to the Elastic Graphics accelerator is active or has failed. A value of zero (0) indicates a connection failure. A value of one (1) indicates a successful connection. | Minimum | Count |
| GPU Health Check | Reports whether the Elastic Graphics accelerator has passed a status health check in the last minute. A value of zero (0) indicates that the status check failed. A value of one (1) indicates a status check passed. | Minimum | Count |
| GPU Memory Utilization | Measures the GPU memory used. | Sum | MiB |
Instance status checks
| Attribute | Description |
|---|---|
| Status check failed | Reports whether the instance has passed both the instance reachability and system reachability check in the last 1 minute. |
| Status check failed_instance | Reports whether the instances has passed instance reachability check in the last 1 minute. |
| Status check failed_system | Reports whether the instance has passed the system reachability check in the last 1 minute. |
| Status check failed_AttachedEBS | Reports whether one or more of the EBS volumes attached to the instance are unable to complete the I/O operations. |
Configuration details:
| Parameters | Description |
|---|---|
| Public Host Name | Shows the host name of the instance |
| Public IP Address | Displays the IP address of the instance |
| Instance Type | Indicates the type of the EC2 instance |
| Instance Launch Time | Shows the time when this EC2 instance was launched |
| Region | Name of the region where an instance is running |
| Instance State | Denotes the functional state of the instance |
| Image ID | Lists the Image ID of the AMI used to launch the instance |
| AMI Launch Index | Can be used to find an instance within the launch group |
| Private DNS Name | The private DNS name assigned to an instance |
| Private IP address | The private IP address of an instance |
| Availability Zone | The availability zone of an instance |
| Architecture | The architecture of the image |
| RAM Disk ID | RAM disk associated with an instance |
| Kernel Identifier | Kernel associated with an instance |
| Root Device Type | The root device type used by the AMI |
| Root Device Name | The name of the root device used by the AMI |
Add a threshold profile for your monitored EC2 instance. Learn more.
Enhanced EC2 monitoring (EC2 CloudWatch and agent integration)
You can also deploy the agent on your EC2 instance to gain more granularity into its performance. Once deployed, you can view system attributes (memory/swap usage), Process attributes (thread/handle count), disk attributes (free/used disk space) and network attributes (errors/dropped packets) side by side with the basic instance level EC2 attributes (mentioned above) obtained from cloudWatch.
If you want to learn more about on how you can enable this EC2 CloudWatch and agent integration for your EC2 instances, refer our product documentation. The documentation will also detail about the prerequisites, added benefits, UI features and agent deployment steps.
You can also get notified for integrated server alert groups. Learn more.
The additional attributes you'll be gaining with the integration are listed below.
Poll frequency
The system level metrics are collected every minute or every 5 minutes.
System level attributes
| Parameters | Description |
|---|---|
| Physical CPU usage | Overall CPU utilisation in percentage. |
| Memory utilization | Overall memory utilisation in percentage. |
| Load average 1 minute | Over the last minute, the average number of tasks or processes that are waiting for CPU time. |
| Load average 5 minutes | Over the five minutes, the average number of tasks or processes that are waiting for CPU time. |
| Load average 15 minutes | Over the fifteen minutes, the average number of tasks or processes that are waiting for CPU time. |
| Memory total | The total memory available in bytes |
| Memory free | The portion of the total memory that is free now. |
| Memory used | The portion of the total memory in use |
| Swap total | The total swap space available |
| Swap free | The portion of the swap space which is currently free |
| Swap used | The portion of swap space currently in use. |
| Disk used | Disk space in use, in percentage |
| Disk free | Free disk space, in percentage. |
| System busy time | The amount of time the CPU spend in user or kernel space. |
| System Idle time | The amount of time the CPU spends in idle state. |
Process level attributes
| Parameters | Description |
|---|---|
| Process ID | The unique process identification number for the process. |
| CPU utilization | The amount CPU usage used by the process. |
| Memory utilization | The amount physical memory consumed by the process. |
| Thread count | The number of active threads for the process. |
| Handle count | The number of object handles. |
Network attributes
| Parameters | Description |
|---|---|
| Network interface card name | The interface name for the Elastic network interface card. |
| Error packets | The number of dropped network packets. |
| Transmitted bytes | The number of bytes transmitted per second on a elastic network interface. |
| Received bytes | The number of bytes received per second on a elastic network interface. |
| Transmitted packets | The number of packets transmitted per second on a elastic network interface. |
| Received packets | The number of packers received per second on a elastic network interface. |
Additional configuration details
| Parameters | Description |
|---|---|
| Host Name/IP | The host name/IP for the EC2 host. |
| IP Address | The IP address of the EC2 host. |
| Operating System | The type of operating system currently running on the EC2 host. |
| OS Architecture | The Processor architecture – 32bit or 64bit. |
| Installed Memory (MB) | The installed memory on the EC2 host. |
| Number of CPU Cores | The number of logical CPU cores on the EC2 host. |
| Processor | The specification of the processor in use. |
- Add a threshold profile for your integrated EC2 instance monitor. Learn more.
- Toggle the Notify for Integrated Server Alert Groups option to Yes to receive the respective integrated server alerts and notifications to the configured server User Alert Group. You have to enable the Display Server Monitor After Integration setting on the Advanced Configurations page to view your server monitor in the Servers tab (Server > Server Monitor) and also in the respective EC2 instance after integration.

Disintegrating a Server monitor from an EC2 monitor
To disintegrate a Server monitor from an EC2 monitor, follow the below steps:
- Navigate to Cloud > AWS > EC2 instance.
- Click the hamburger icon
 next to the EC2 monitor name that you wish to disintegrate.
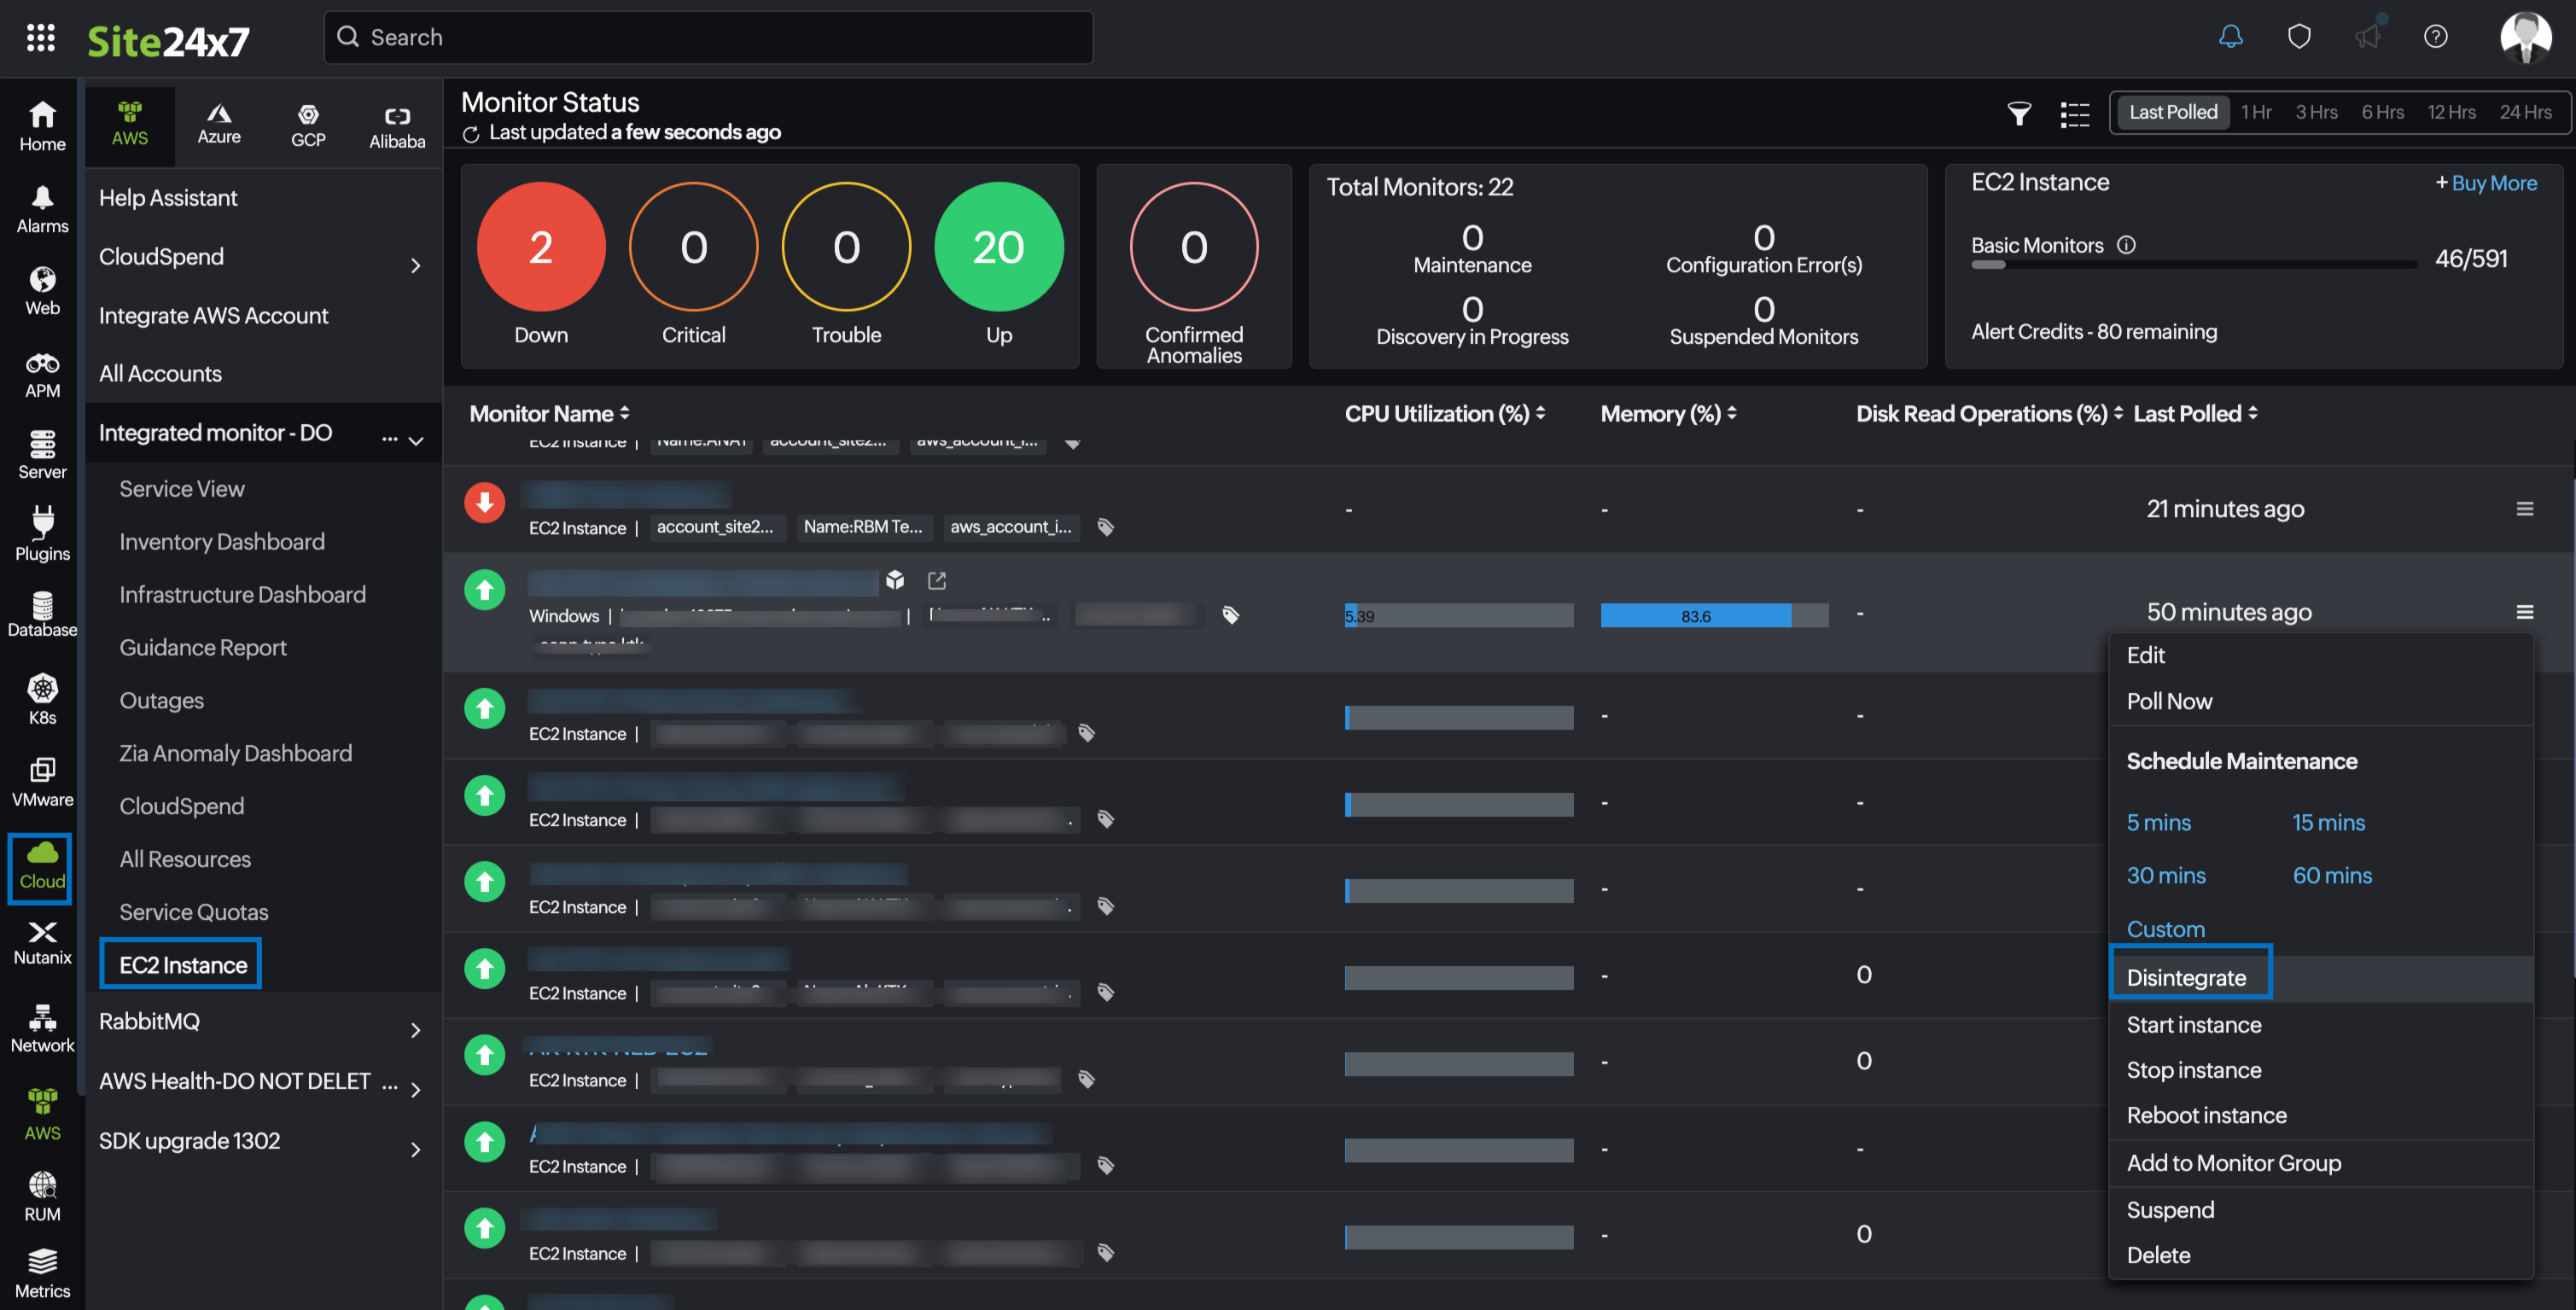
- Click Disintegrate.
Monitoring Capacity Reservations
You can now monitor the usage of the reserved capacity of AWS EC2 instances in specific availability zones and identify the used/unused capacity when there is a breach in the threshold. View the associated EC2 instances with their status under Monitored Resources tab and set thresholds to be notified when any of these instances fail.
Performance metrics for Capacity Reservations
| Attribute | Description | Statistics | Data type |
|---|---|---|---|
| Used instance count | The number of instances that are currently in use. Note: This metric is available in the account level also if the resource is shared. |
Maximum | Count |
| Available Instance Count | The number of instances that are available. | Minimum | Count |
| Total Instance Count | The total number of instances you have reserved. | Maximum | Count |
| Instance Utilization | The percentage of reserved capacity instances that are currently in use. | Average | Count |
Use-cases
- While running a batch workload at a particular time, monitoring the unused capacity can help avoid accruing additional charges.
- Monitor and set thresholds for the used instance count at the account level to identify the capacity used.
Forecast
Estimate future values of the following performance metrics and make informed decisions about adding capacity or scaling your AWS infrastructure.
- CPU Utilization
- Network In
- Network out
- CPU Credit Usage
- CPU Credit Balance
- CPU Surplus Credit Balance
Similarly, you can also view the forecast for the following metrics of EC2 Monitor Capacity Reservations:
- Instance Utilization
CloudWatch agent and Amazon EC2 server integration
Integrate your EC2 server with the CloudWatch agent and obtain detailed performance metrics.
-
On this page
- Overview
- Setup and configuration
- Policies and permissions
- Polling frequency
- Supported configuration tags
- IT Automations
- Resource Level Topology
- Security Findings
- Supported metrics for CloudWatch EC2 integration
- Volume metrics
- Accelerator Metrics
- Disintegrating a Server monitor from an EC2 monitor
- CloudWatch agent and Amazon EC2 server integration