
Databricks Workspace Monitoring
Monitor the health and performance of resources within your Databricks workspace, directly from Site24x7.
Prerequisites
- A Databricks service principal with a generated client secret. The secret is shown only once. Store it securely before proceeding.
- Administrator access to the Databricks workspace you want to monitor.
- The Workspace URI of your Databricks environment (for example,
https://adb-<workspace-id>.azuredatabricks.net).
Add a Databricks Workspace Monitor
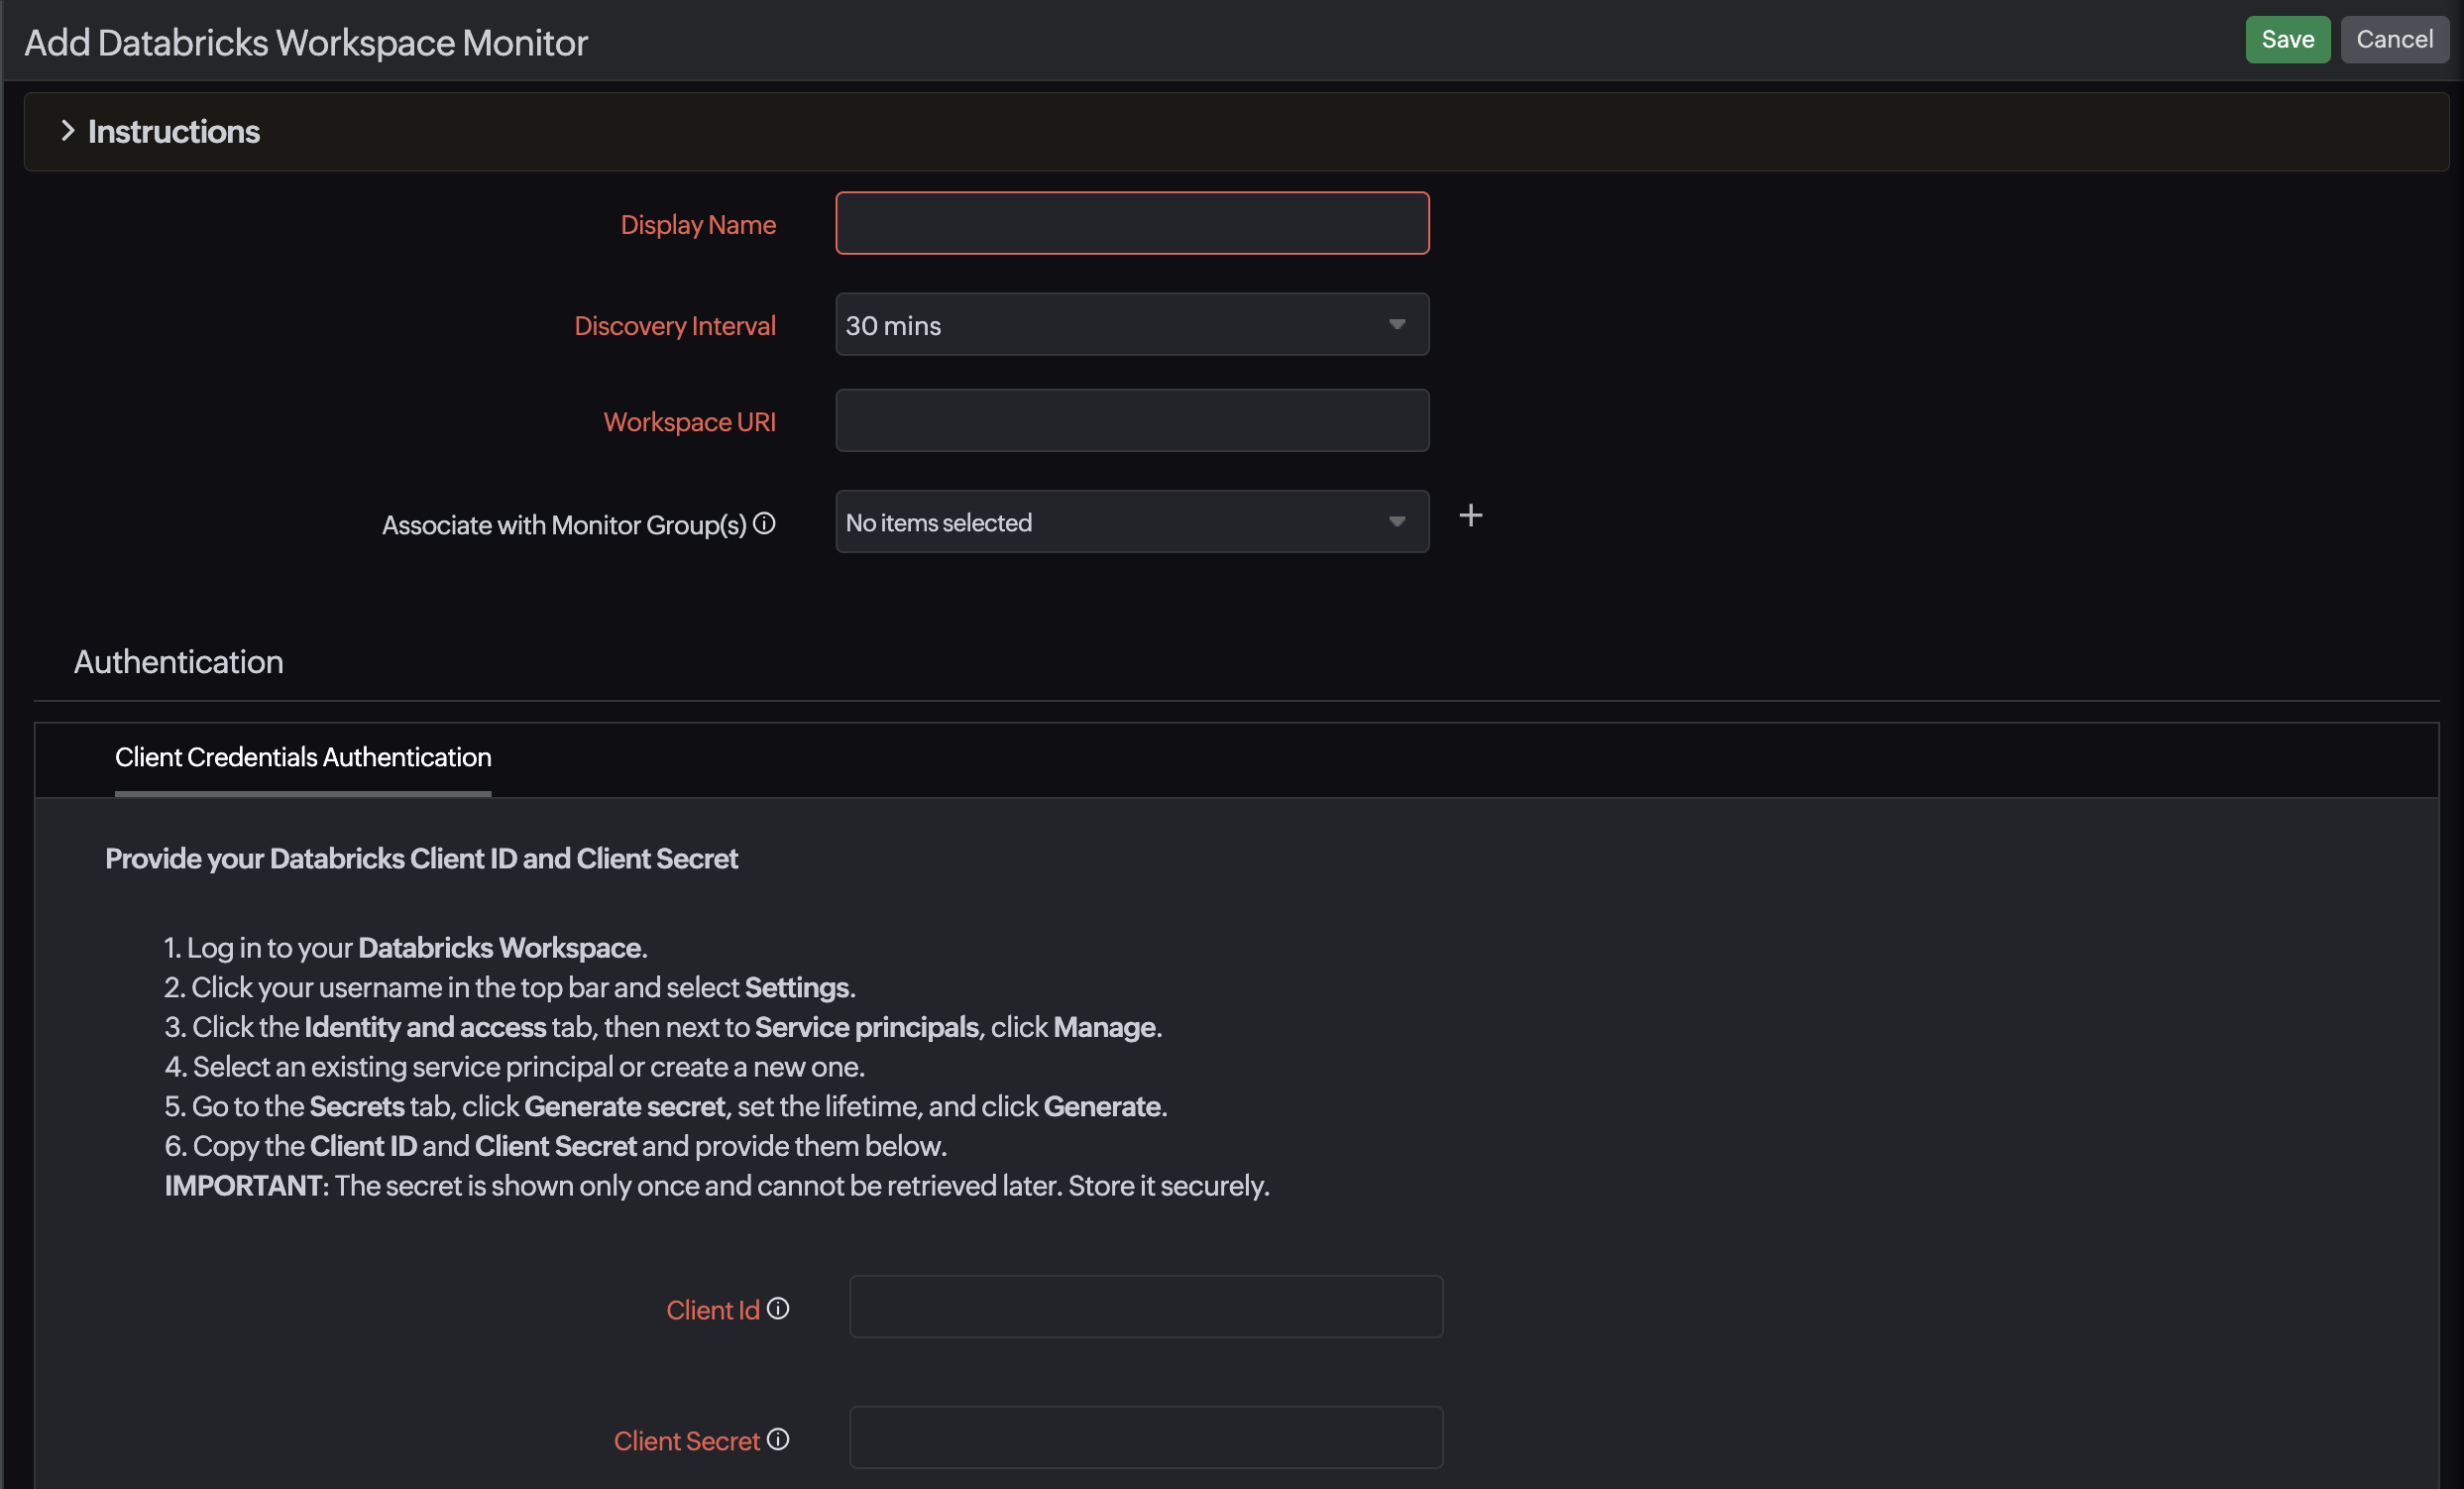
- Log in to Site24x7 and go to Admin > Add Monitor > Cloud > Databricks Workspace.
- Provide a Display Name for the monitor.
- Enter the Workspace URI.
- Set the Discovery Interval — how often Site24x7 polls the workspace for new or changed resources. The default is 30 mins.
- Optionally, Associate with Monitor Group(s) to organise this monitor under an existing group. Use the + icon to create a new group.
- Provide the Client ID and Client Secret for your Databricks Workspace.
Note
To get the Client ID and Client Secret, follow the instructions provided in this knowledge base document.
Click Save to create the Databricks Workspace monitor. If you would like to customize your Databricks monitor, utilize the required fields below before clicking Save.
Optional fields
- In the Discovery Settings section:
- Service/Resource Types: Select the Databricks resource types to discover and monitor.
- Auto-discover New Resources: Set to Enable to automatically add newly created resources to monitoring on each discovery cycle.
- In the Filter by Tags section, optionally restrict which Databricks Jobs will be discovered and monitored:
- Include Resources based on Tags: Only monitor jobs matching the specified key-value tag pairs. Use OR (any match) or AND (all must match).
- Exclude Resources based on Tags: Skip jobs matching the specified tag pairs, even if they would otherwise be discovered.
- In the General Settings section:
- Notify for the Exhaustion of Basic Monitor License Units: Enable to be alerted when license units run out.
- Stop Rediscovery if the License Units have Exhausted: Enable to prevent auto-discovery from continuing once license limits are reached.
- Tags for all Resources: Apply Site24x7 tags to every resource discovered by this monitor.
- In the Resource Termination Settings section:
- Mute Resource Termination Alerts: Enable to suppress alerts when a resource is terminated.
- Monitor Terminated Resources: Select Yes to keep the monitor visible in Site24x7 with a terminated status after the resource is deleted from Databricks. Select No to stop data collection for terminated resources immediately.
- Automatically Remove Terminated Resources: Enable to delete the monitor record automatically after a set number of days. Set the retention period in the Remove Terminated Resources After field.
- In the Auto-assign Threshold Profile section:
- Overwrite Existing Threshold Profiles: Enable to replace threshold profiles on already-monitored resources during the next discovery cycle.
- Configure Default Threshold Profiles for the Selected Services: Select the threshold profile to auto-assign to each discovered resource type.
- In the Configuration Profiles section:
- Threshold and Availability: Select a Threshold and Availability profile. The default is Default Threshold - DBRICKS_WS.
- Tags: Associate Site24x7 tags with this monitor for filtering and reporting.
- IT Automation Templates: Select an IT Automation template and a trigger condition (for example, Execute on Down) for auto-remediation.
- In the Alert Settings section:
- User Alert Group: Select the user groups to notify when an alert is triggered.
- On-Call Schedule: Optionally assign an on-call schedule to route alerts to the right person at the right time.
- Notification Profile: Select a Notification Profile to control how and when alerts are sent.
Click Save. Site24x7 will begin discovering resources in your Databricks workspace.
To push Databricks alerts to external services like PagerDuty, Slack, or ServiceNow, go to Admin > Third-Party Integrations and connect your preferred service. Once active, it will appear in the Services field under Third-Party Integrations on this page.
Databricks monitor dashboards
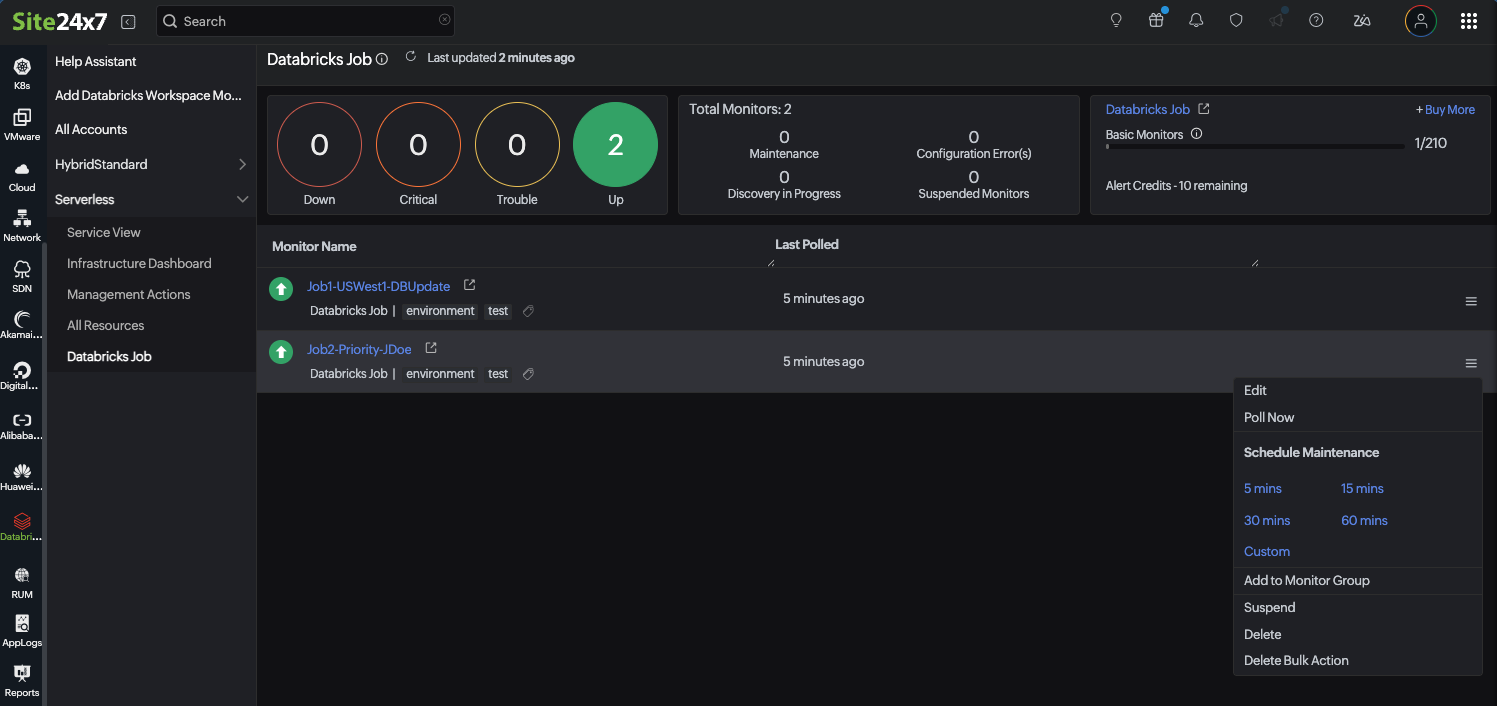
Once you have created your Databricks monitor, view it by navigating to the left navigation pane > Cloud > Databricks > workspace name.
Service View
The Service View dashboard shows the count of Databricks monitors segregated based on resource types.
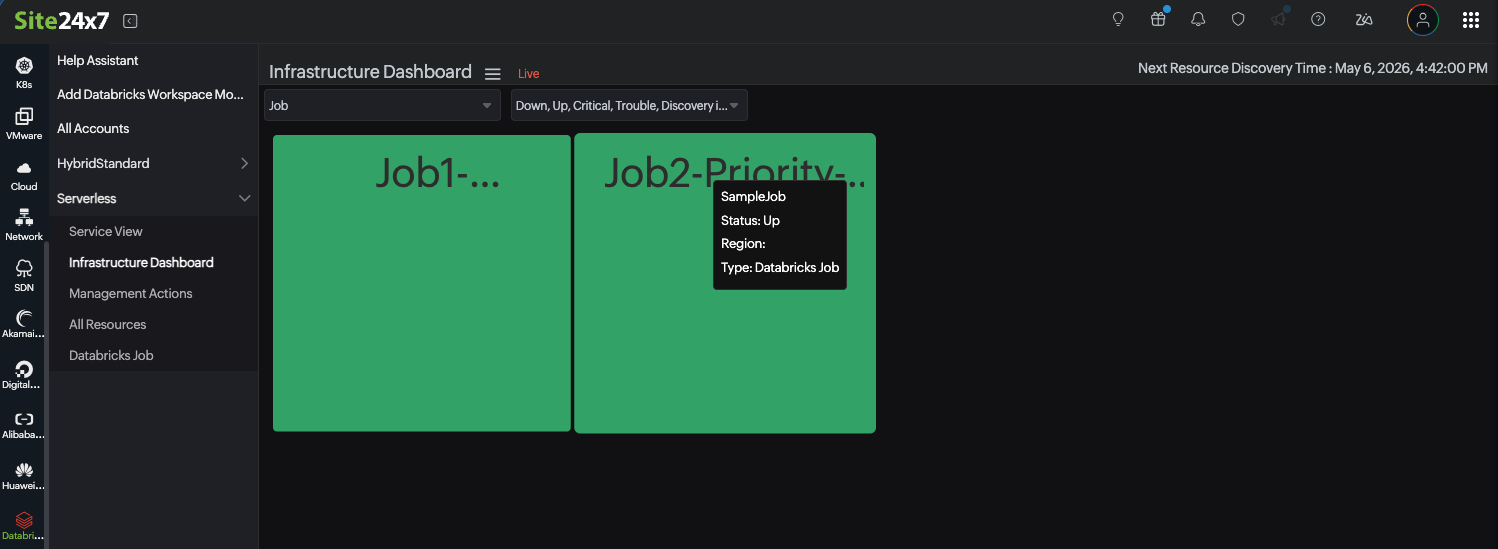
Infrastructure Dashboard
The Infrastructure Dashboard shows a NOC view of all the monitors as tiles, depicting their active status.
Management Actions
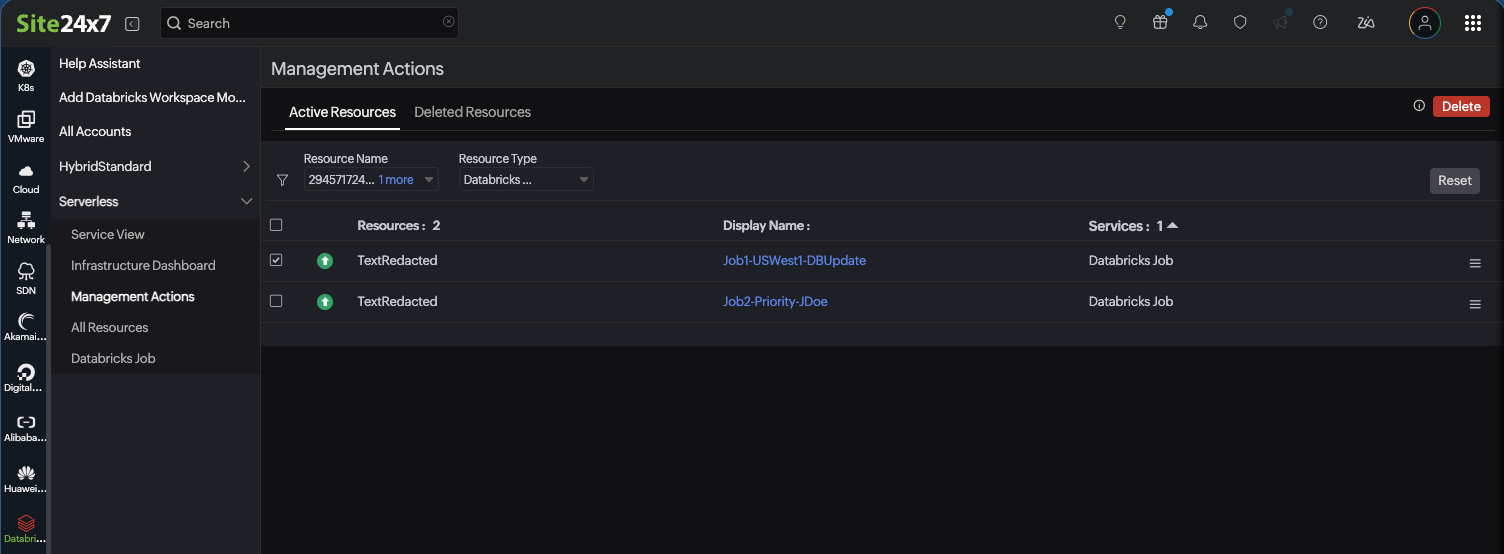
In this tab, you can view the active and deleted Databricks monitors. To delete a Databricks monitor, select the monitor from the checklist, and click Delete.
Databricks Job
In this tab, you can view all the Databricks Job monitors. Click the monitors to navigate to their detailed monitor page.
Click the hamburger icon  next to the individual Databricks Job monitor to perform these actions:
- Edit: Edit the monitor configuration.
- Poll Now: Trigger a data collection.
- Schedule Maintenance: Mark the monitor as under maintenance.
- Add to Monitor Group: Associate this Databricks monitor to a monitor group.
- Suspend: Suspends the monitor.
- Delete: Deletes the monitor.
- Delete Bulk Action: Takes you to the Delete via bulk action page where you can filter the monitors based on parameters and delete the monitor across multiple workspaces.
Every 10 Databricks job monitors consume 1 basic monitor license. Databricks Workspace monitors do not consume any licenses.