
Databricks Jobs Monitoring
Site24x7's Databricks Jobs monitoring gives you full visibility into the execution health of your Databricks jobs — from high-level run outcomes and task success rates to cluster-level performance and duration breakdowns. Detect failures, track slowdowns, and investigate task reattempts without leaving your monitoring console.
How to navigate to the Databricks Jobs monitor
Utilize Site24x7 Databricks Jobs monitoring to:
- Track job run outcomes and failure rates across all your Databricks workspaces in one place.
- Identify slow jobs using run duration trends and top-slowest-run analysis.
- Drill into task-level execution details to pinpoint exactly where a job is failing or stalling.
- Correlate run trigger types with performance patterns to optimize scheduling and resource allocation.
To access the Databricks Jobs monitor:
- Log in to your Site24x7 account.
- In the left navigation pane, go to Databricks > Databricks Workspace Monitor.
- Click the Databricks Jobs tab to view all discovered Databricks Job monitors.
- Click any monitor in the list to navigate to its detailed monitor page.
Summary page
The Databricks Jobs monitor summary page gives you an at-a-glance view of job execution health. The following metrics are displayed on the summary page:
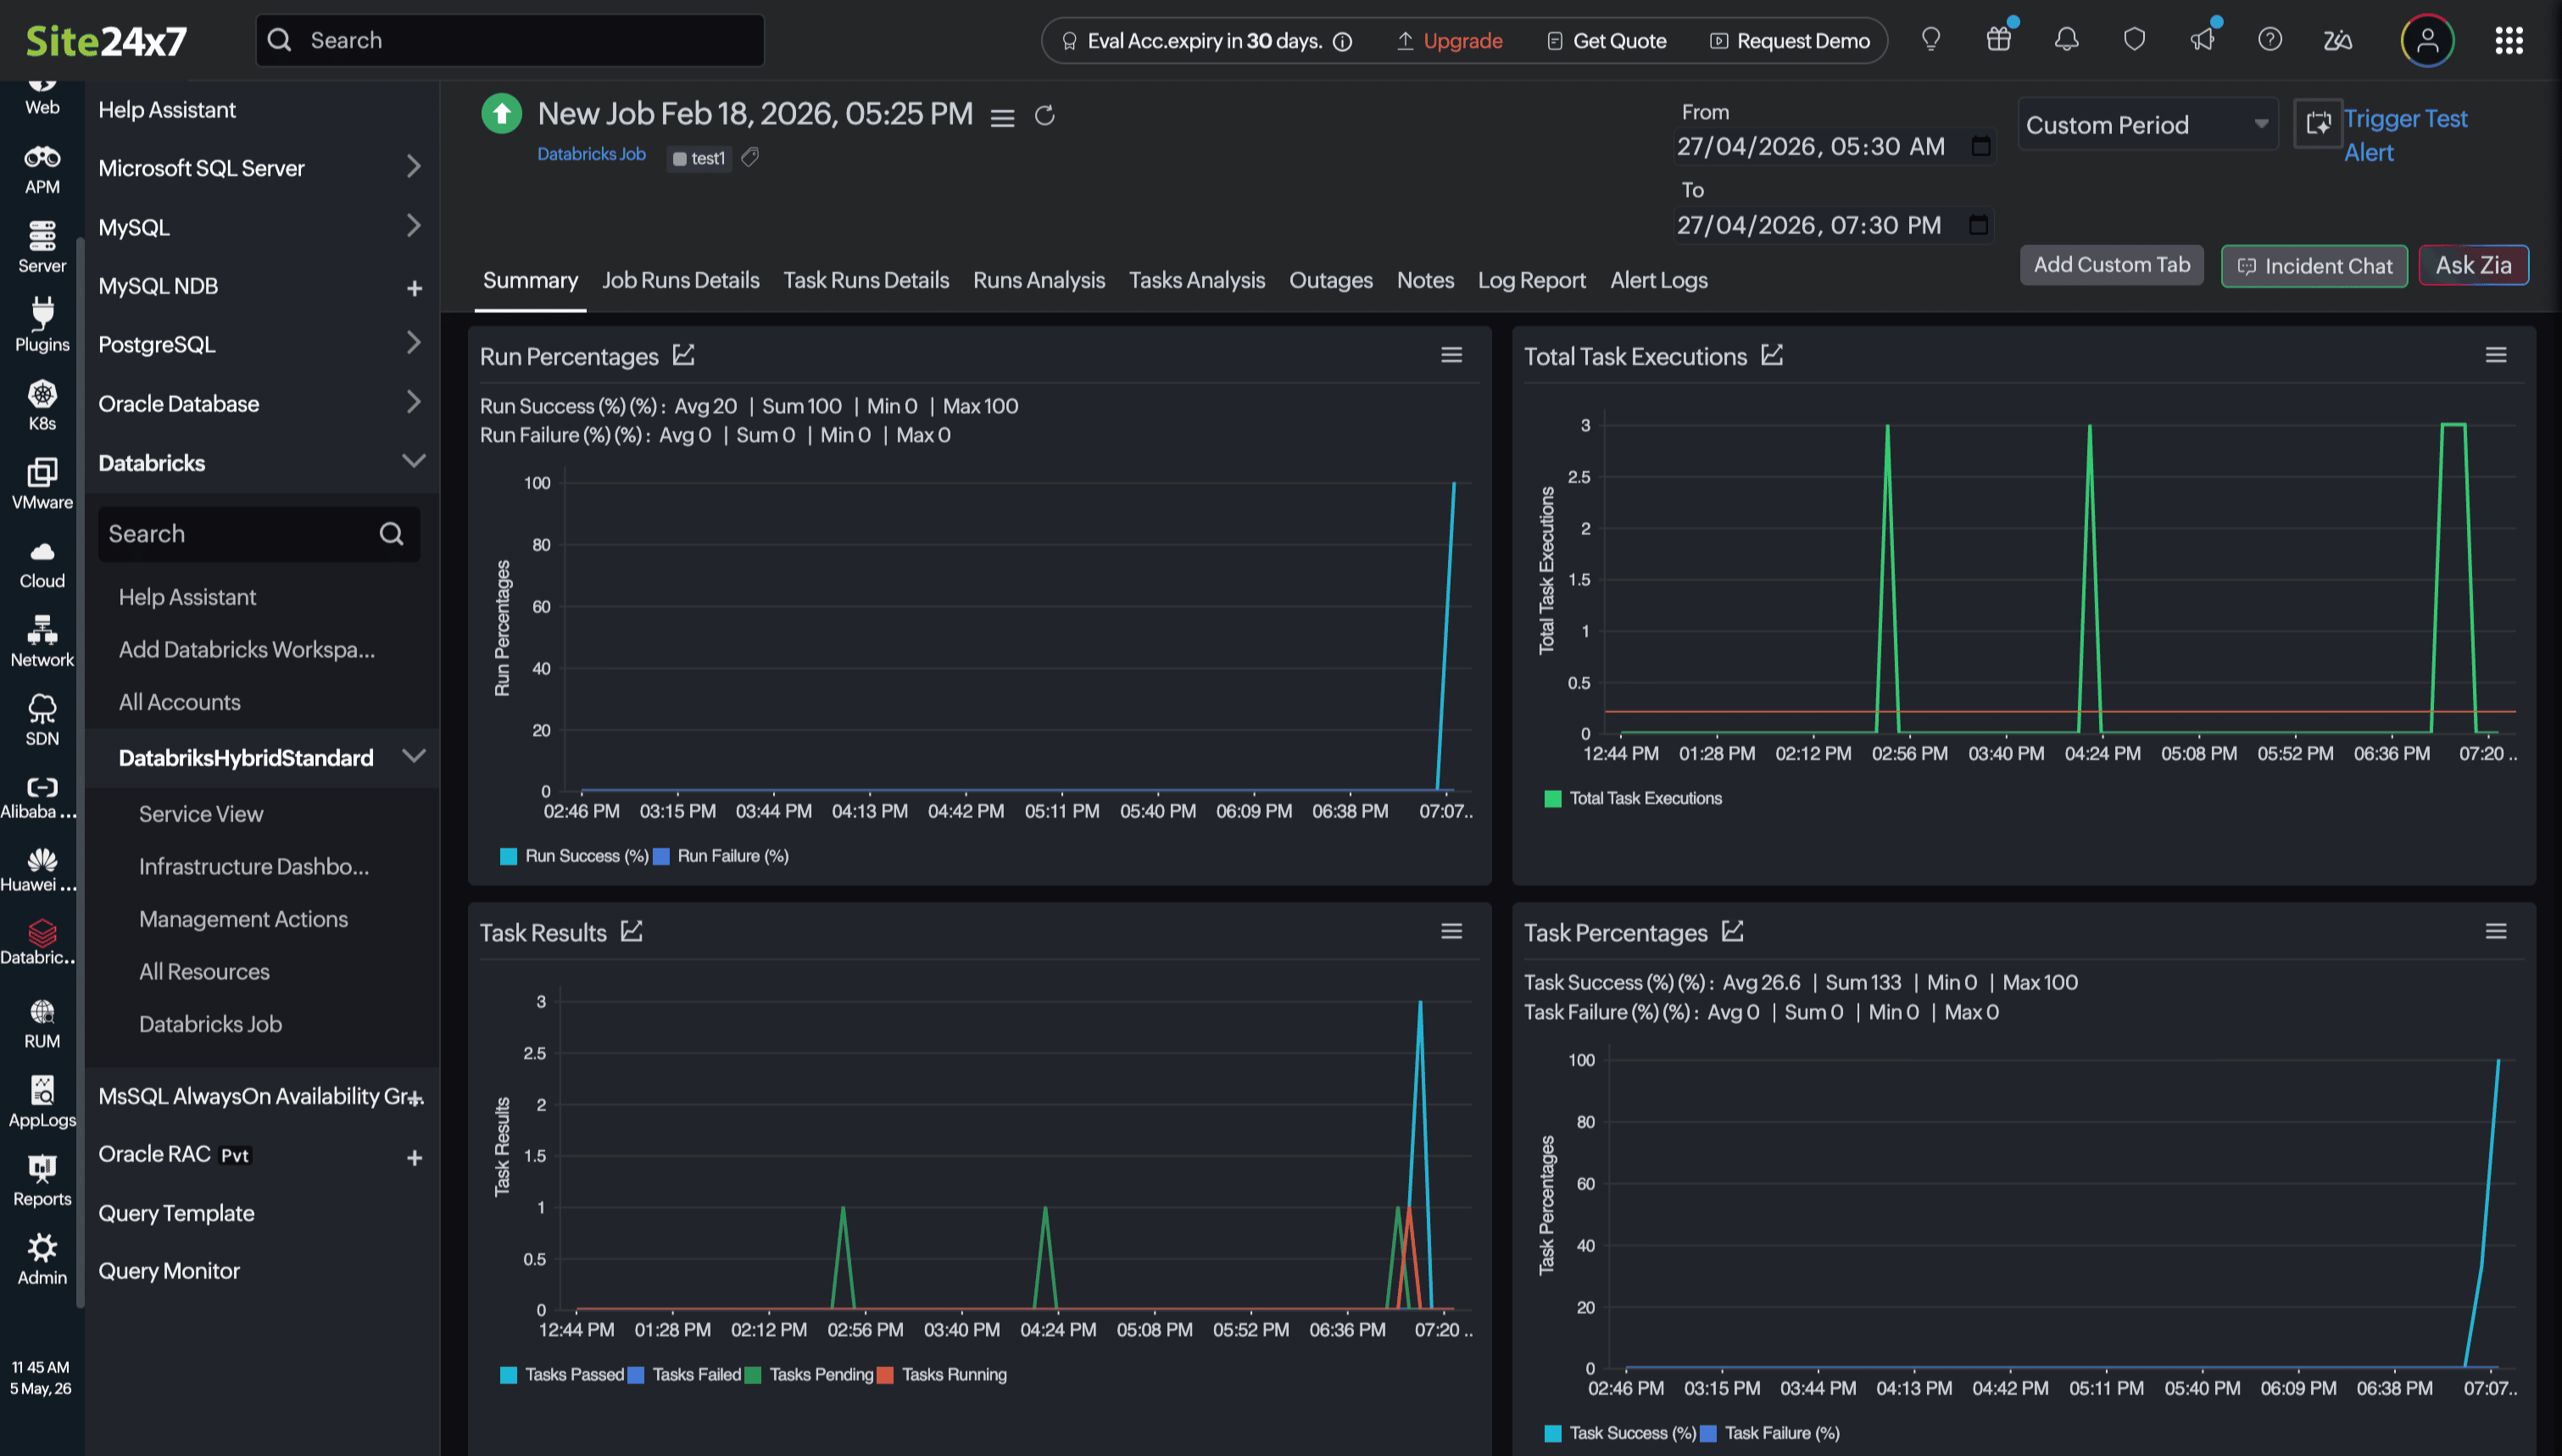
| Metric | Description | Unit |
|---|---|---|
| Number of Tasks | Total number of tasks defined within the job. | Count |
| Number of Job Clusters | Number of job clusters used by this job during the selected period. | Count |
| Number of Runs | Total runs of the job within the selected time window. | Count |
| Runs Passed | Number of runs that were completed successfully. | Count |
| Runs Failed | Number of runs that ended in a failed state. | Count |
| Tasks Passed | Number of individual tasks that completed successfully across all runs. | Count |
| Tasks Failed | Number of individual tasks that failed across all runs. | Count |
| Tasks Pending | Number of tasks currently in a pending or queued state. | Count |
| Tasks Running | Number of tasks currently in an active running state. | Count |
| Total Task Executions | Total count of all task executions including passed, failed, pending, and running tasks. | Count |
| Run Success (%) | Percentage of total runs that were completed successfully. | Percent |
| Run Failure (%) | Percentage of total runs that ended in a failed state. | Percent |
| Task Success (%) | Percentage of total task executions that were completed successfully. | Percent |
| Task Failure (%) | Percentage of total task executions that failed. | Percent |
Job Runs Details
The Job Runs Details view can be viewed in this tab and also as log events in Site24x7 AppLogs. Each run is stored as a searchable log entry under the log type Databricks Job Runs, allowing you to query, filter, and analyse run history alongside your other application logs.
To access Job Runs Details via AppLogs, go to Apps > AppLogs > Search and use the query:
logtype="Databricks Job Runs"
You can filter results using the following General Fields in the left panel: workspace, Run Name, Life Cycle State, Result State, and Trigger. The following columns are available in the results table:
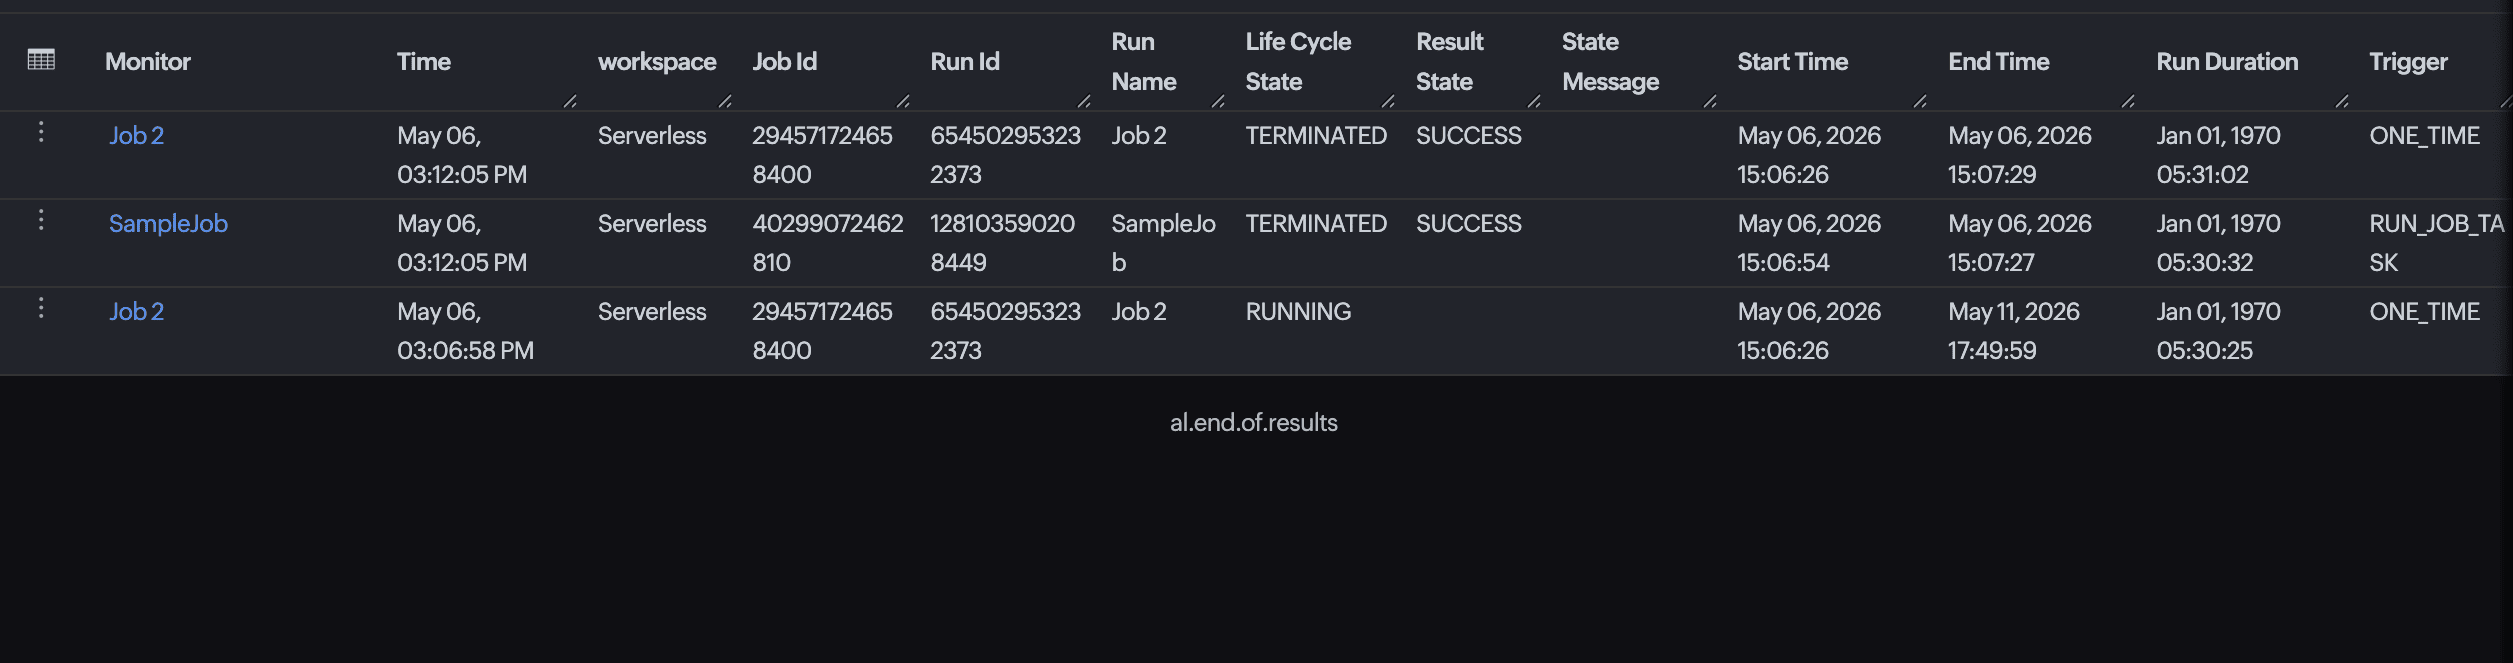
| Column | Description | Unit |
|---|---|---|
| Monitor | The name of the Databricks Job monitor in Site24x7 that this run belongs to. | Text |
| Time | The timestamp at which Site24x7 collected this run record. | Text |
| Workspace | The Databricks workspace in which the job run was executed. | Text |
| Job Id | The unique identifier of the Databricks job. | Text |
| Run Id | The unique identifier of this specific job run. | Text |
| Run Name | The display name of the job run as configured in Databricks. | Text |
| Life Cycle State | The current or final lifecycle state of the run (for example, TERMINATED, RUNNING, PENDING). | Text |
| Result State | The outcome of the run once it reached a terminal state (for example, SUCCESS, FAILED, CANCELLED, TIMEDOUT). Blank if the run has not yet completed. | Text |
| State Message | An optional message providing additional context about the run's current or final state, such as an error description on failure. | Text |
| Start Time | The date and time at which the run began execution. | Timestamp |
| End Time | The date and time at which the run completed or was terminated. | Timestamp |
| Run Duration | The total elapsed time from start to end for this run. | Seconds |
| Trigger | The mechanism that initiated the run (for example, ONE_TIME for manual runs, RUN_JOB_TASK for runs triggered by another job task, or a schedule-based trigger). | Text |
Task Runs Details
The Task Runs Details can be viewed in this tab and also as log events in Site24x7 AppLogs. Use this view to investigate which tasks within a run succeeded, failed, were blocked, or are still running, and to identify reattempts and cluster assignments at the task level.
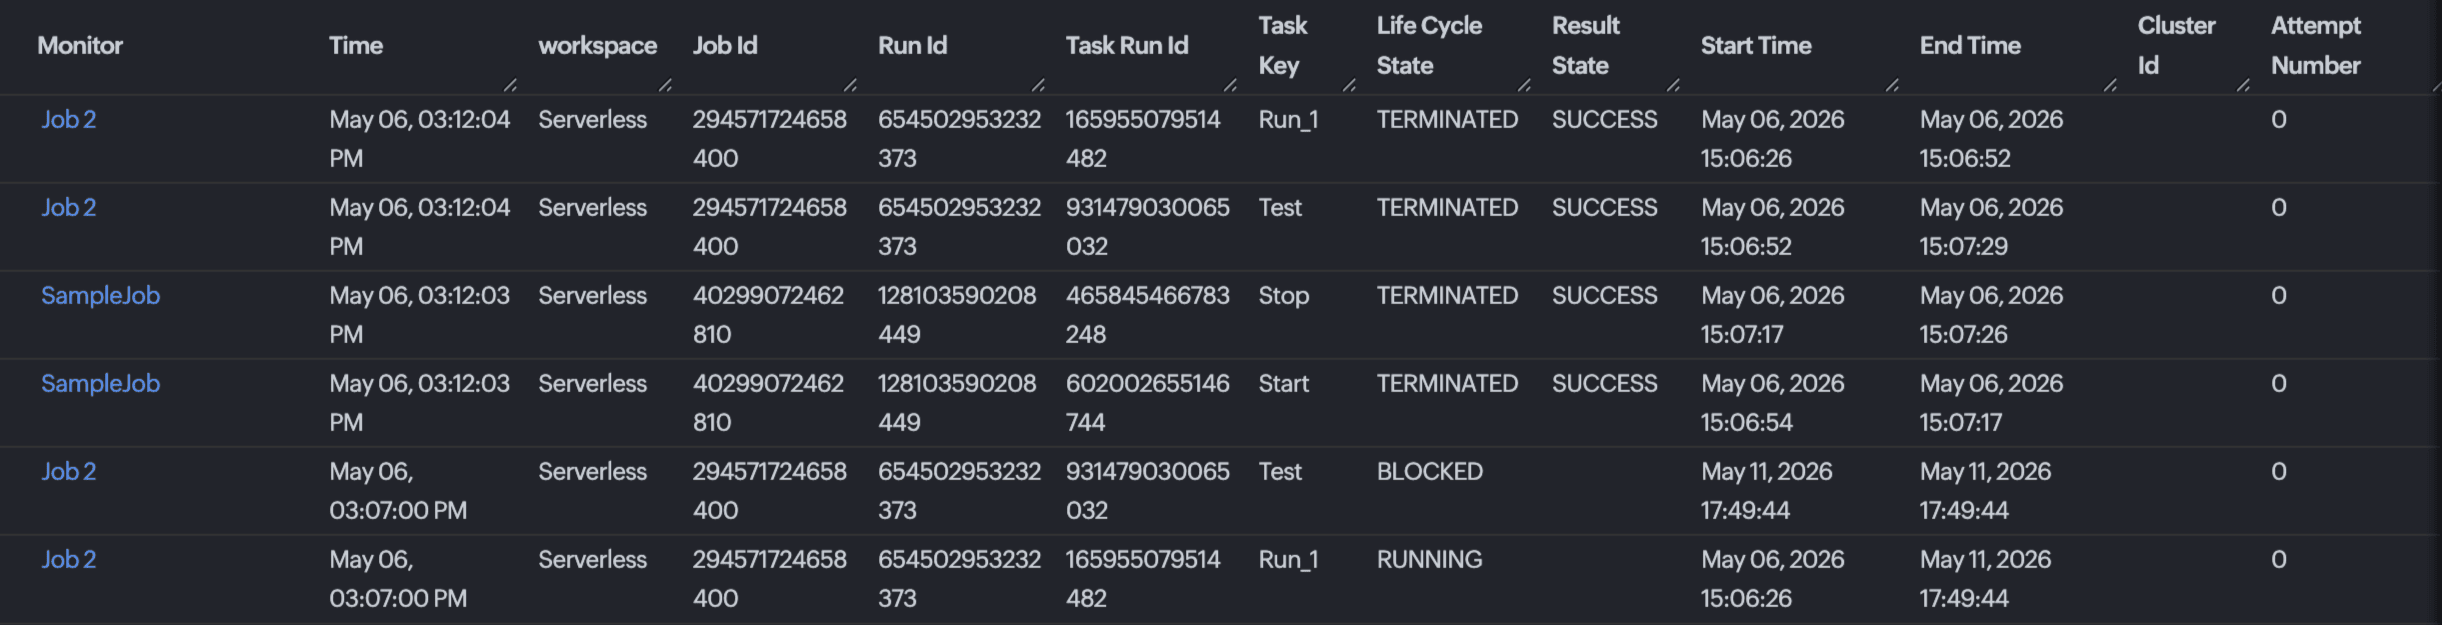
The following columns are available in the Task Runs Details table:
| Column | Description | Unit |
|---|---|---|
| Monitor | The name of the Databricks Job monitor in Site24x7 that this task run belongs to. | Text |
| Time | The timestamp at which Site24x7 collected this task run record. | Text |
| workspace | The Databricks workspace in which the task was executed. | Text |
| Job Id | The unique identifier of the parent Databricks job. | Text |
| Run Id | The unique identifier of the parent job run that this task belongs to. | Text |
| Task Run Id | The unique identifier of this individual task execution within the parent run. | Text |
| Task Key | The key name of the task as defined in the job configuration (for example, Run_1, Test, Start, Stop). | Text |
| Life Cycle State | The current or final lifecycle state of the task (for example, TERMINATED, RUNNING, BLOCKED, PENDING). A BLOCKED state indicates the task is waiting on an upstream dependency to complete. | Text |
| Result State | The outcome of the task once it reached a terminal state (for example, SUCCESS, FAILED, CANCELLED). Blank if the task has not yet completed. | Text |
| Start Time | The date and time at which this task began execution. | Timestamp |
| End Time | The date and time at which this task completed or was terminated. | Timestamp |
| Cluster Id | The identifier of the cluster on which this task was executed. Useful for correlating task failures with specific cluster behaviour. | Text |
| Attempt Number | The attempt sequence number for this task execution. A value of 0 indicates the first attempt. Values greater than 0 indicate the task was retried after a previous failure. | Text |
Runs Analysis tab
The Runs Analysis tab provides a comprehensive view of job run behavior over time. Use this tab to identify failure patterns, understand run duration trends, and investigate cancelled or timed-out runs.
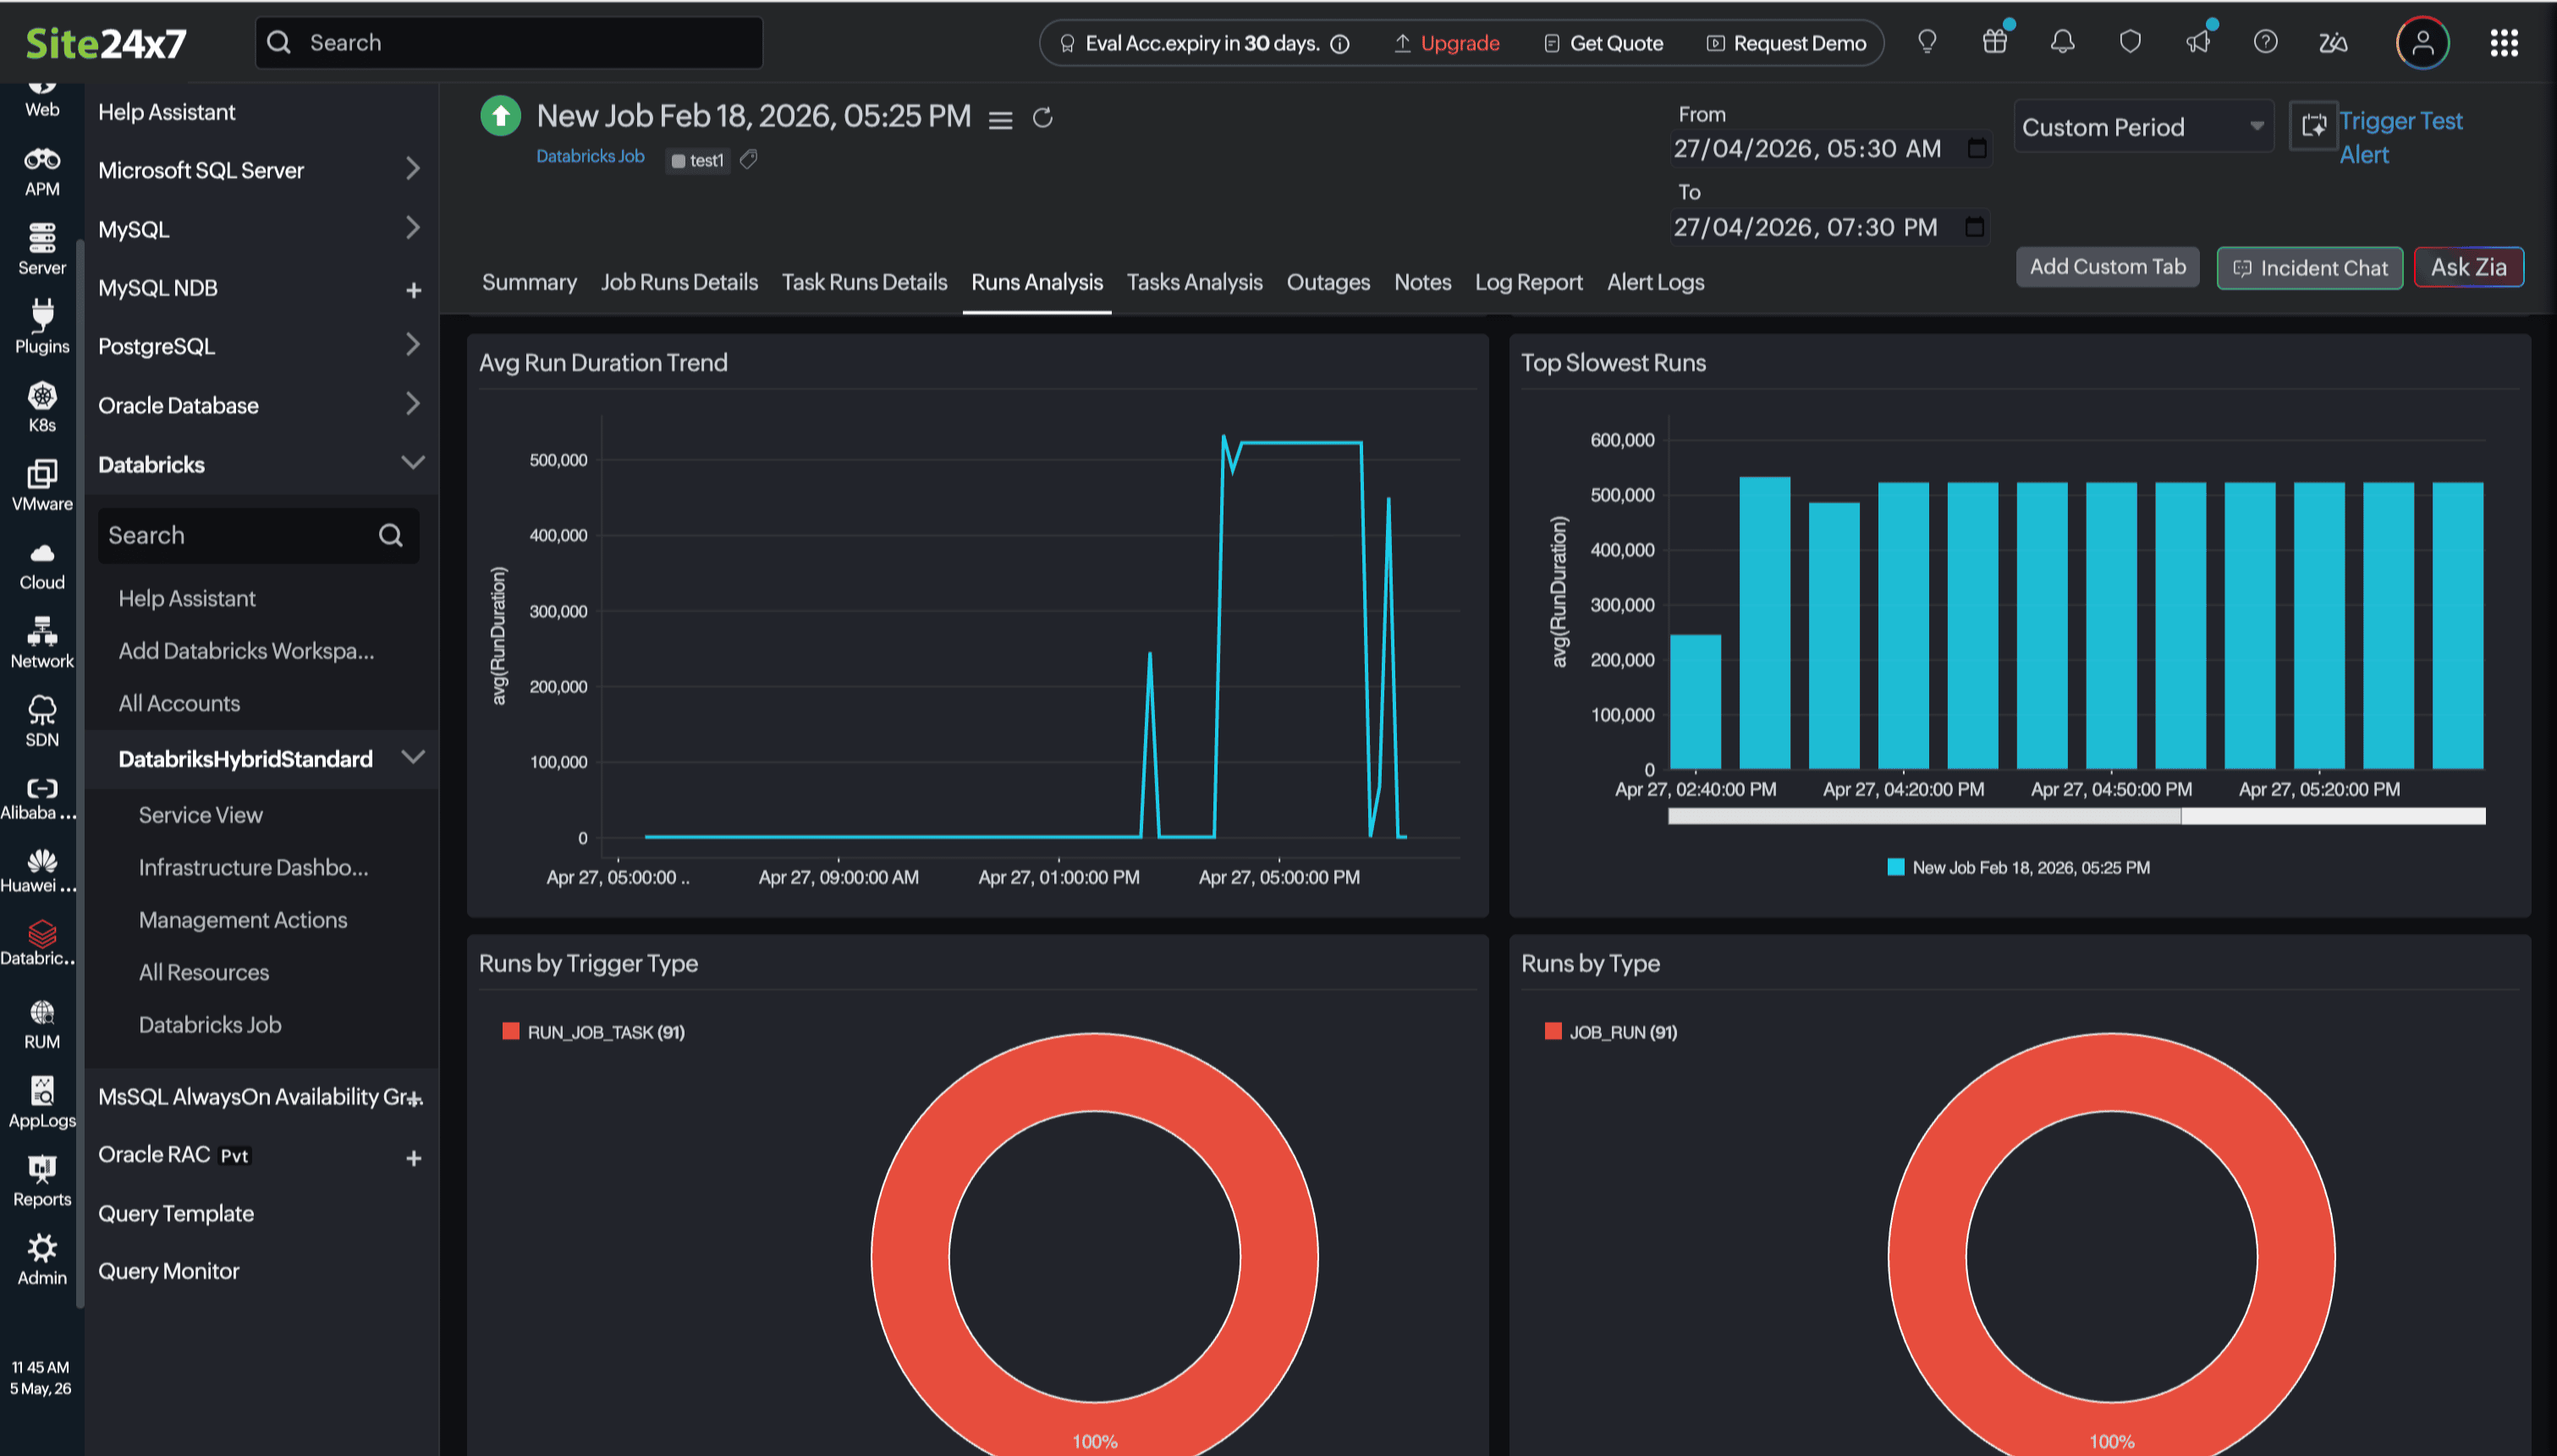
The following charts and views are available:
| View | Description | Unit |
|---|---|---|
| Run Lifecycle States | Distribution of runs across all lifecycle states (for example, pending, running, terminated) at the time of collection. | Text |
| Run Results Over Time | Time-series chart showing how run outcomes (succeeded, failed, cancelled, timed out) have trended across the selected period. | Chart |
| Failed Runs | List or chart of runs that ended in a failed state, with details to help identify recurring failure patterns. | Count |
| Cancelled/Timed Out Runs | View of runs that were cancelled manually or terminated due to timeout, to help identify scheduling or resource issues. | Count |
| Avg Run Duration Trend | Time-series chart showing how the average run duration has changed over time, useful for detecting performance regressions. | Seconds |
| Top Slowest Runs | Ranked list of the slowest individual runs by total duration within the selected period. | Text |
| Runs by Trigger Type | Breakdown of runs by how they were triggered (for example, scheduled, manual, file arrival). | Count |
| Runs by Type | Distribution of runs by job type (for example, notebook, Python script, JAR, dbt). | Count |
Run Duration Analysis
The Run Duration Analysis table at the bottom of the tab breaks down duration by run name, helping you pinpoint the most time-consuming runs and their duration components:
| Column | Description | Unit |
|---|---|---|
| Run Name | The display name of the individual job run. | Text |
| Count | Number of times this run was executed within the selected period. | Count |
| Avg Setup Duration | Average time spent in the setup phase (for example, cluster provisioning) before execution begins. | Seconds |
| Avg Execution Duration | Average time spent actively executing the run's tasks, excluding setup and cleanup. | Seconds |
| Avg Cleanup Duration | Average time spent in the cleanup phase after execution completes (for example, cluster termination). | Seconds |
Tasks Analysis tab
The Tasks Analysis tab provides task-level visibility into job execution. Use this tab to identify which specific tasks are failing, which clusters they run on, and whether reattempts are masking underlying reliability issues.
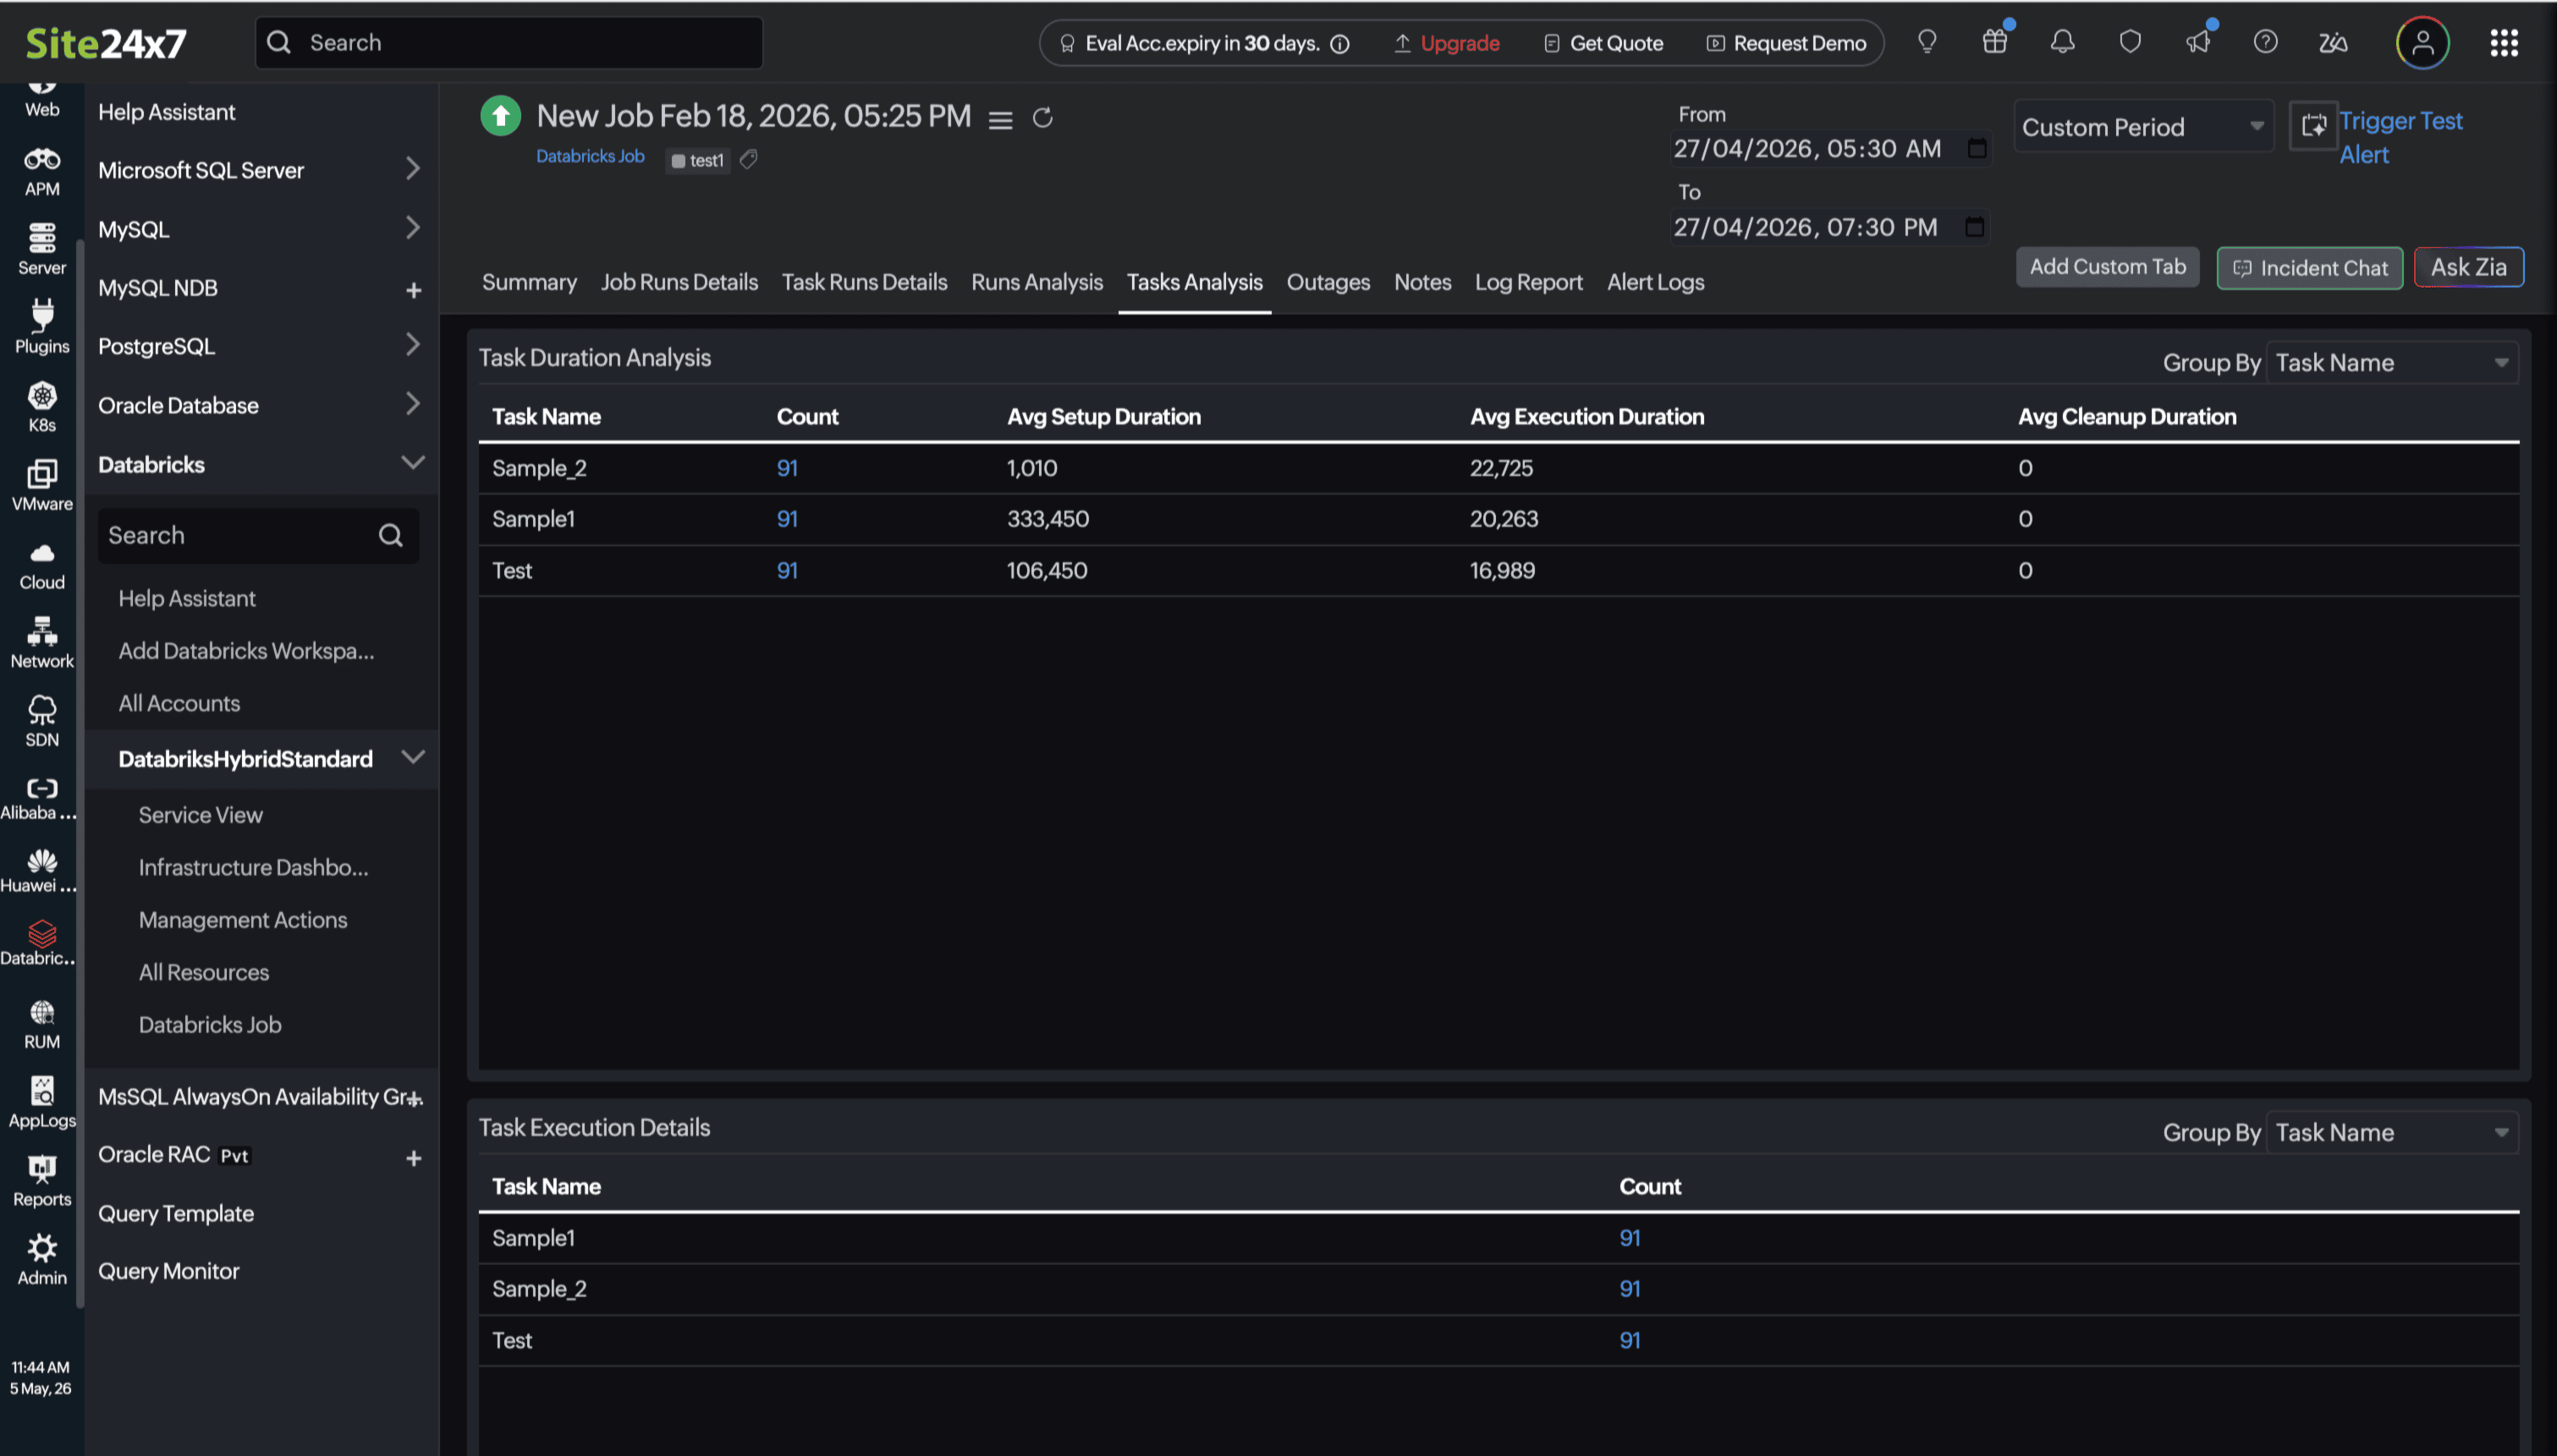
The following charts and views are available:
| View | Description | Unit |
|---|---|---|
| Task Lifecycle States | Distribution of tasks across all lifecycle states at the time of collection. | - |
| Task Results Over Time | Time-series chart showing how task outcomes (succeeded, failed, skipped) have trended across the selected period. | - |
| Failed Tasks | List or chart of tasks that failed, with details to identify patterns across runs or cluster types. | Count |
| Tasks by Cluster | Breakdown of task executions by the cluster on which they ran, useful for identifying cluster-level performance or reliability issues. | Count |
| Task Reattempts | View of tasks that were retried after an initial failure, helping identify flaky tasks or resource contention issues. | Count |
Task Duration Analysis
The Task Duration Analysis table at the bottom of the tab breaks down duration by task name:
| Column | Description | Unit |
|---|---|---|
| Task Name | The display name of the individual task within the job. | Text |
| Count | Number of times this task was executed within the selected period. | Count |
| Avg Setup Duration | Average time spent in the setup phase before the task begins execution. | Seconds |
| Avg Execution Duration | Average time spent actively executing the task, excluding setup and cleanup. | Seconds |
| Avg Cleanup Duration | Average time spent in the cleanup phase after the task completes. | Seconds |
Setting up alerts: Threshold configuration
To set thresholds for all Databricks Job monitors:
- In Site24x7, click Admin in the left navigation pane.
- Select Configuration Profiles from the left pane, then select Threshold and Availability from the drop-down menu.
- Click Add Threshold Profile in the top-right corner.
- For Monitor Type, select Databricks Jobs. You can now set threshold values for the metrics listed above.
IT Automation
Site24x7 offers IT Automation tools that automatically resolve performance degradation issues. These tools react to events proactively rather than waiting for manual intervention, automating repetitive tasks and remediating threshold breaches. How to configure IT Automation for a monitor
Configuration Rules
With Site24x7's Configuration Rules, you can automate configuration settings across your Databricks Job monitors and create custom rules to track configuration changes continuously. How to add Configuration Rules