Adding an ISP Latency Monitor
Site24x7's internet service provider (ISP) monitoring provides detailed insights on the connectivity, latency, hop count, autonomous system (AS) number, and other key performance metrics throughout the call path from the source to destination.
Visualize the traceroute, analyze the network path, and track where latency is high. You can also configure threshold limits and receive alerts on various performance metrics.
Use case
Let's consider the case of Zylker, an e-commerce company that offers a wide range of products to its customers. The platform depends on real-time interactions for customer purchases, inventory updates, and customer support. During sales events, its platform experiences high traffic from multiple locations. Every customer needs to have a smooth experience until they complete their purchase.
To ensure this, the company monitors all the ISPs to check for latency, ensuring the customers experience fast and smooth transactions. If the latency of an ISP increases for customers in a specific location, the platform alerts support teams to investigate.
Adding an ISP latency monitor
- Log in to your Site24x7 account.
- Go to Admin > Add Monitor, and click ISP Latency under WAN Monitoring.
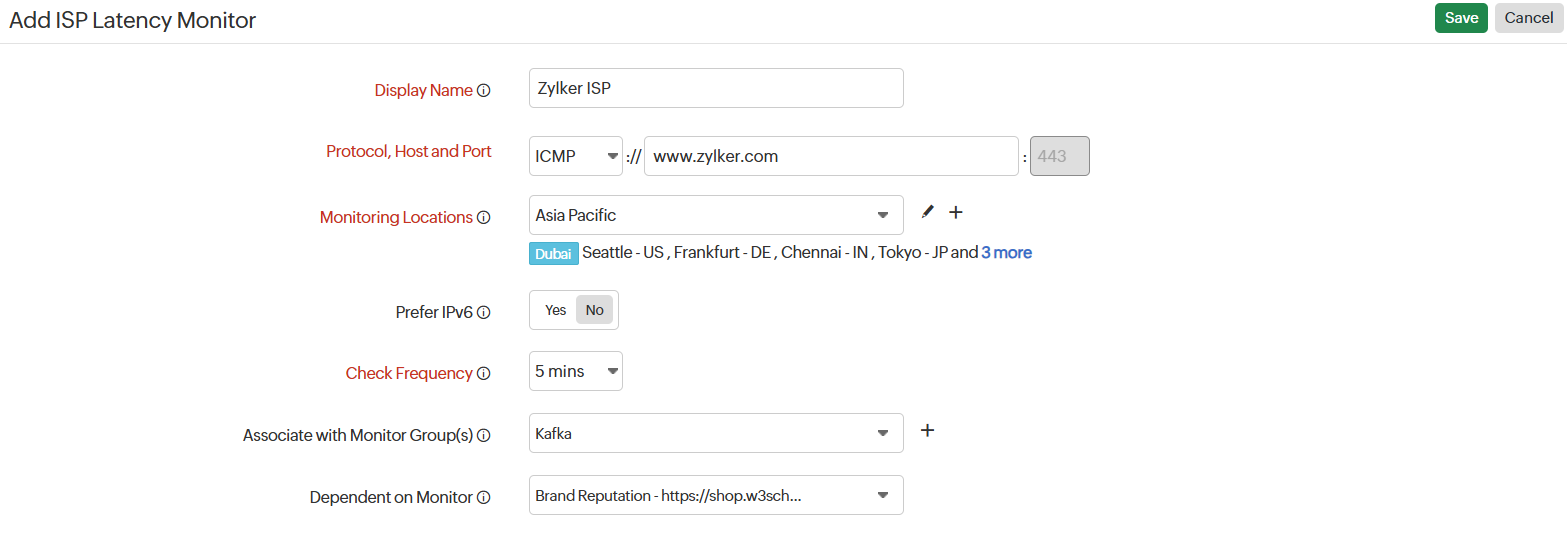
- On the Add ISP Latency Monitor page, enter the following:

- Display Name: Provide a name to identify your ISP latency monitor.
- Protocol, Host, and Port: Choose a suitable protocol from the drop-down menu, enter the host (www.example.com), and provide the port number. By default, the port number is 443.
- Monitoring Locations: Select a location profile from the drop-down list from where the ISP latency monitor should be monitored. You can also add a new location profile and map it with the monitor.
Note
Only Linux On-Premise Pollers can be used to configure the On-Premise Poller as a monitoring location for ISP latency monitoring. - Prefer IPv6: Toggle to Yes if you prefer an IPv6 address to an IPv4 address.
- Check Frequency: Choose the monitor poll frequency from the drop-down menu. The frequency can be set from five minutes to 30 minutes.
- Associate with Monitor Groups: Associate the ISP latency monitor with a monitor group. Choose an existing monitor group or create a new one.
- Dependent on Monitor: Select a dependent monitor from the drop-down. Site24x7 will suppress alerts for the configured monitor if the dependent monitor is already down.
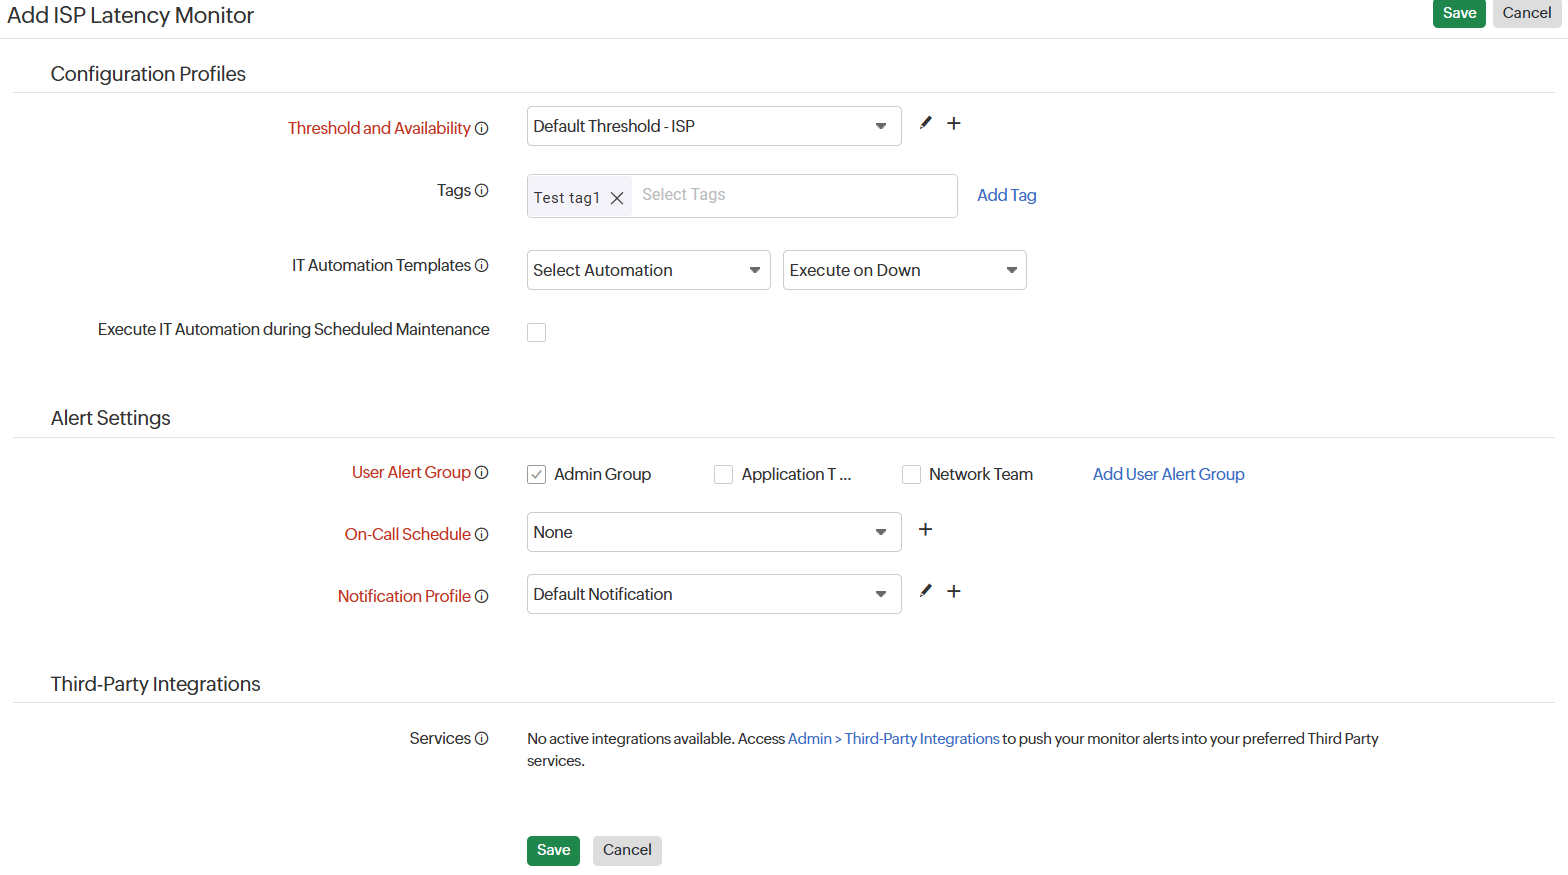
- Enter the following details for Configuration Profiles:
- Threshold and Availability: Select a threshold profile from the drop-down list, use the default threshold profile available, or create a new one, and get notified when resources cross the configured threshold.
- Tags: Associate your monitor with a predefined tag or multiple tags to help organize and manage your monitors creatively.
- IT Automation Templates: Select an automation to be executed when there is a change in the state of an ISP latency monitor. The defined action gets executed when there is a state change and selected user groups are alerted.
- Execute IT Automation during Scheduled Maintenance: Select the checkbox to enable the option to execute IT automation—script executions, server commands, and more—during this period.
Configuring a scheduled maintenance window allows you to suppress alerts for selected IT resources during routine maintenance tasks.
Learn more about IT automation.

- Enter the following details in Alert Settings:
- User Alert Group: Select the user group that needs to be alerted during an outage, or add multiple users to a group.
- On-Call Schedule: On-Call Schedule option helps you ensure that notifications are sent to assignees in specific shift hours, helping them to quickly respond to alerts or incidents. Choose an on-call schedule of your preference from the drop-down.
- Notification Profile: Configure who gets notified in case of downtime and when. Choose a notification profile from the drop-down list, use the default profile available, or create a custom notification profile.
NoteYou can receive alerts if the monitors are associated to user groups irrespective of the on-call shift you've configured.
- Third-Party Integration: Set up integrations, and associate your monitor with a pre-configured third-party service. This lets you push your monitor alarms to selected services and facilitate improved incident management.
- Click the Save button to save your monitor.
NoteLearn more about the performance of the ISP latency monitor
Related articles
-
On this page
- Use case
- Adding an ISP latency monitor
- Related articles
