Performance Metrics of an ISP Latency Monitor
Analyze connectivity throughout the network path, assess internet service providers' (ISPs') service level agreements (SLAs), and identify areas of high latency by pinging your hosts from different locations.
Once you've successfully added an ISP Latency monitor, you can view the performance stats from Web > ISP Latency > monitor name > Summary. You can also configure threshold limits for all the key performance metrics that you track.
ISP performance metrics
| Metric | Description |
|---|---|
| Availability | The availability of the ISP connection through the route |
| Unreachable Paths | The number of locations in the Location Profile configured for the monitor from which the provided hostname is not reachable |
| Maximum Latency | The path (location) with the most latency to the hostname along with the value measured in milliseconds |
| Minimum Latency | The path (location) with the least latency to the hostname along with the value measured in milliseconds |
| Maximum Hops | The path (location) with the highest number of intermediate hops to the destination and the hop count |
| Minimum Hops | The path (location) with the lowest number of intermediate hops to the destination and the hop count |
| Downtimes | The number of times the monitor was down |
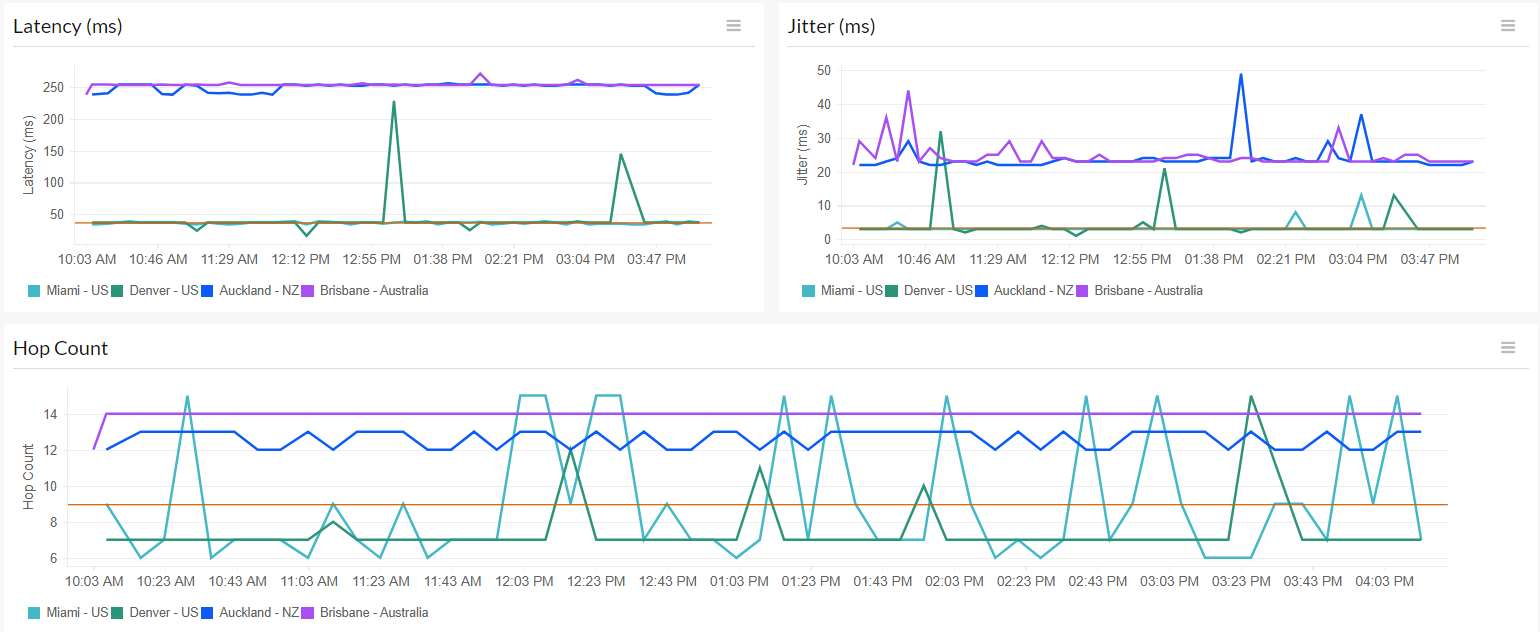
| Latency | Map: The round trip time of a packet sent from the source location to the destination, monitored from different locations and plotted on a map for easy analysis Graph: The latency trend analyzed over a period |
| Jitter | The variation in latency of packets carrying data over the path measured in milliseconds; simply put, it's the inter-packet delay variance trend observed over a period |
| Hop Count | The number of hops the packet travelled through from the source to the destination |

Latencies of all paths
Visualize the performance of the ISP from all the monitoring locations.
| Metric | Description |
|---|---|
| Location | The locations specified in the Location Profile that are used as sources to poll the destination |
| Health | The reachability of the destination from the location |
| Latency | The round trip time of a packet sent from the source location to the destination |
| Jitter | The variation in latency of packets carrying data from the location |
| Hop Count | The number of hops in the network path when transferred from the location |
| MTU | The maximum transmission unit (MTU) is the size of the largest protocol data unit (PDU) transferred through the path, measured in bytes |
| Distinct AS Number Count | The number of hops with distinct autonomous system (AS) numbers available when monitored from the location |
View the individual location-wise details at every hop in the Latencies of all Paths section in the Summary tab of an ISP Latency monitor and drill down into each metric.

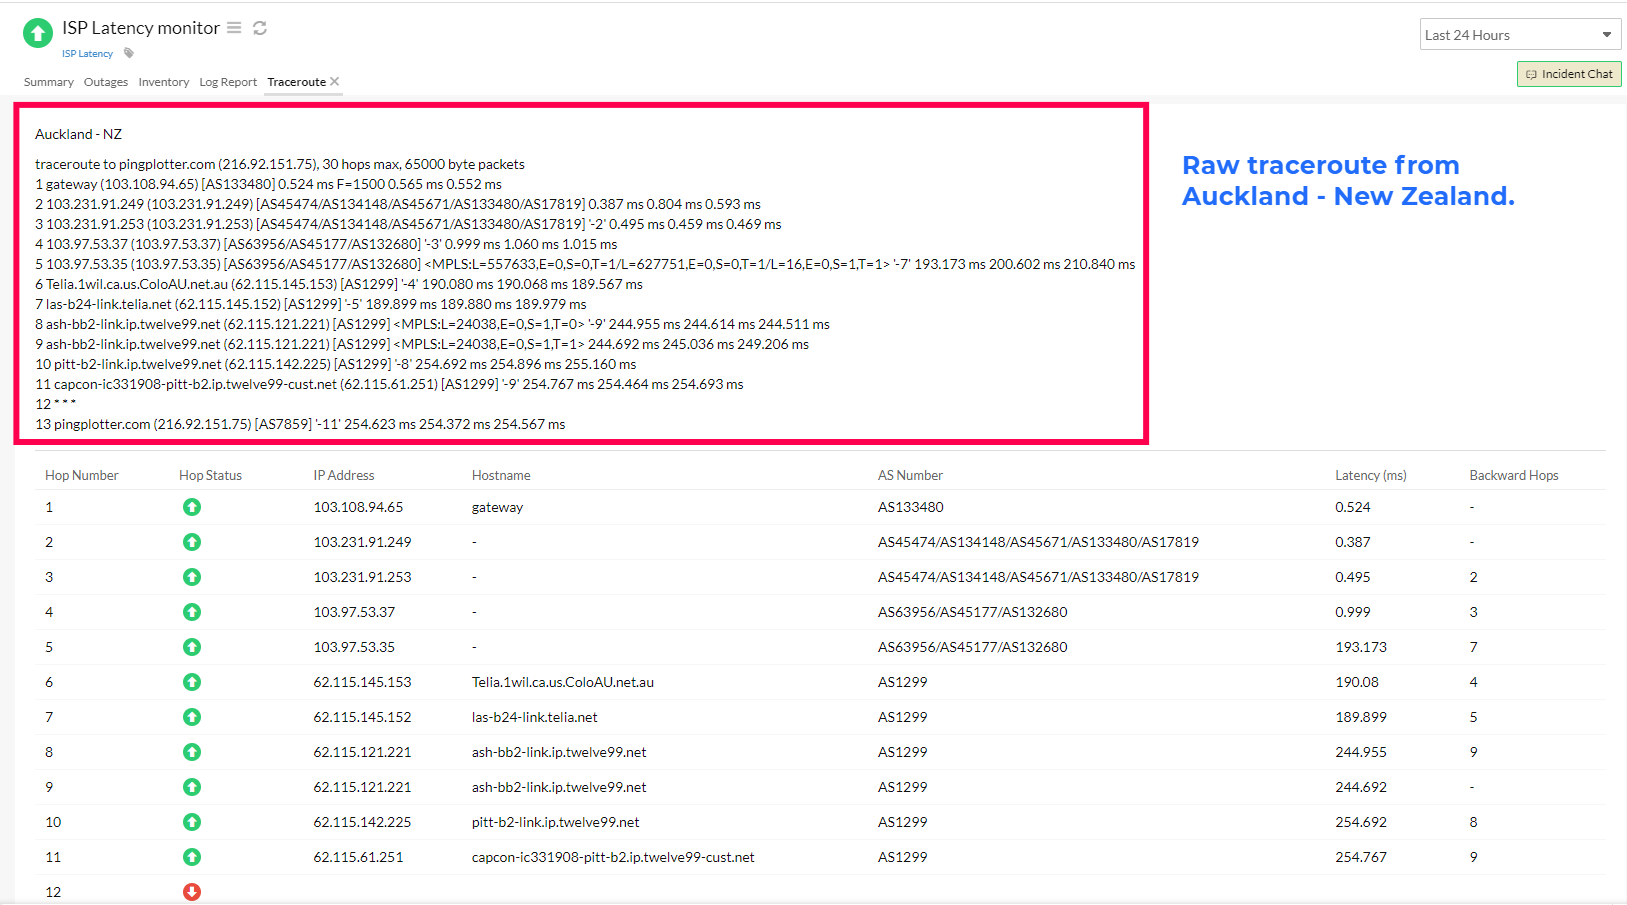
Click View Traceroute to obtain the raw traceroute with details like latency, jitter, and MTU in bytes, number of hops, and IP prefix at each hop from the chosen location.

Network path analysis using traceroute

The Recent Network Path Analysis section in the Summary tab of an ISP Latency monitor shows the traceroute from every location server. Analyzing the network path from source to destination highlights different hops as nodes, their connection, and the availability at every node. Hover over each connection to view details like the name of the location agent, latency, number of hops, IP prefix, AS number, and AS name.
Use the following fields of a traceroute to obtain drilled-down analysis of each path.
- Search nodes: Search for nodes in a traceroute.
- Highlight path: Select an individual path to highlight.
- Highlight link delay: Specify the link delay in milliseconds. Link delays greater than this value will be highlighted.
- Show/Hide: Check the Node label and Link delay box to display the details. Else, uncheck.
- MPLS network links: Displays the number of MPLS network links found in the traceroute from all locations.
- Poll from location: Select a polling location from the drop-down. Click Poll Now to poll from the specified location and generate a new traceroute.
