Poll Now Report
Gain insights on your monitors’ performance- and availability-related metrics from all configured locations with the Poll Now report. During outages, this report can help track possible reasons for the outage and debug issues in real time.
When a previous polling operation is still in progress, you won’t be able to generate a report.
Generating the report
- Log in to Site24x7.
- Navigate to Home > Monitors.
- Click on the monitor you would like to generate a Poll Now report from the Monitor Status page.
- In the new page that opens, hover over the hamburger icon next to the monitor display name and choose Poll Now. When you click Poll Now, the Choose Locations pop-up will open. In the pop-up, you can select the Primary and Secondary locations for polling and click the Poll Now button. The Poll Now option simultaneously carries out polling from the primary and secondary locations. Once polling is completed, click the Poll Now Report tab to access the report. Read about monitoring locations.
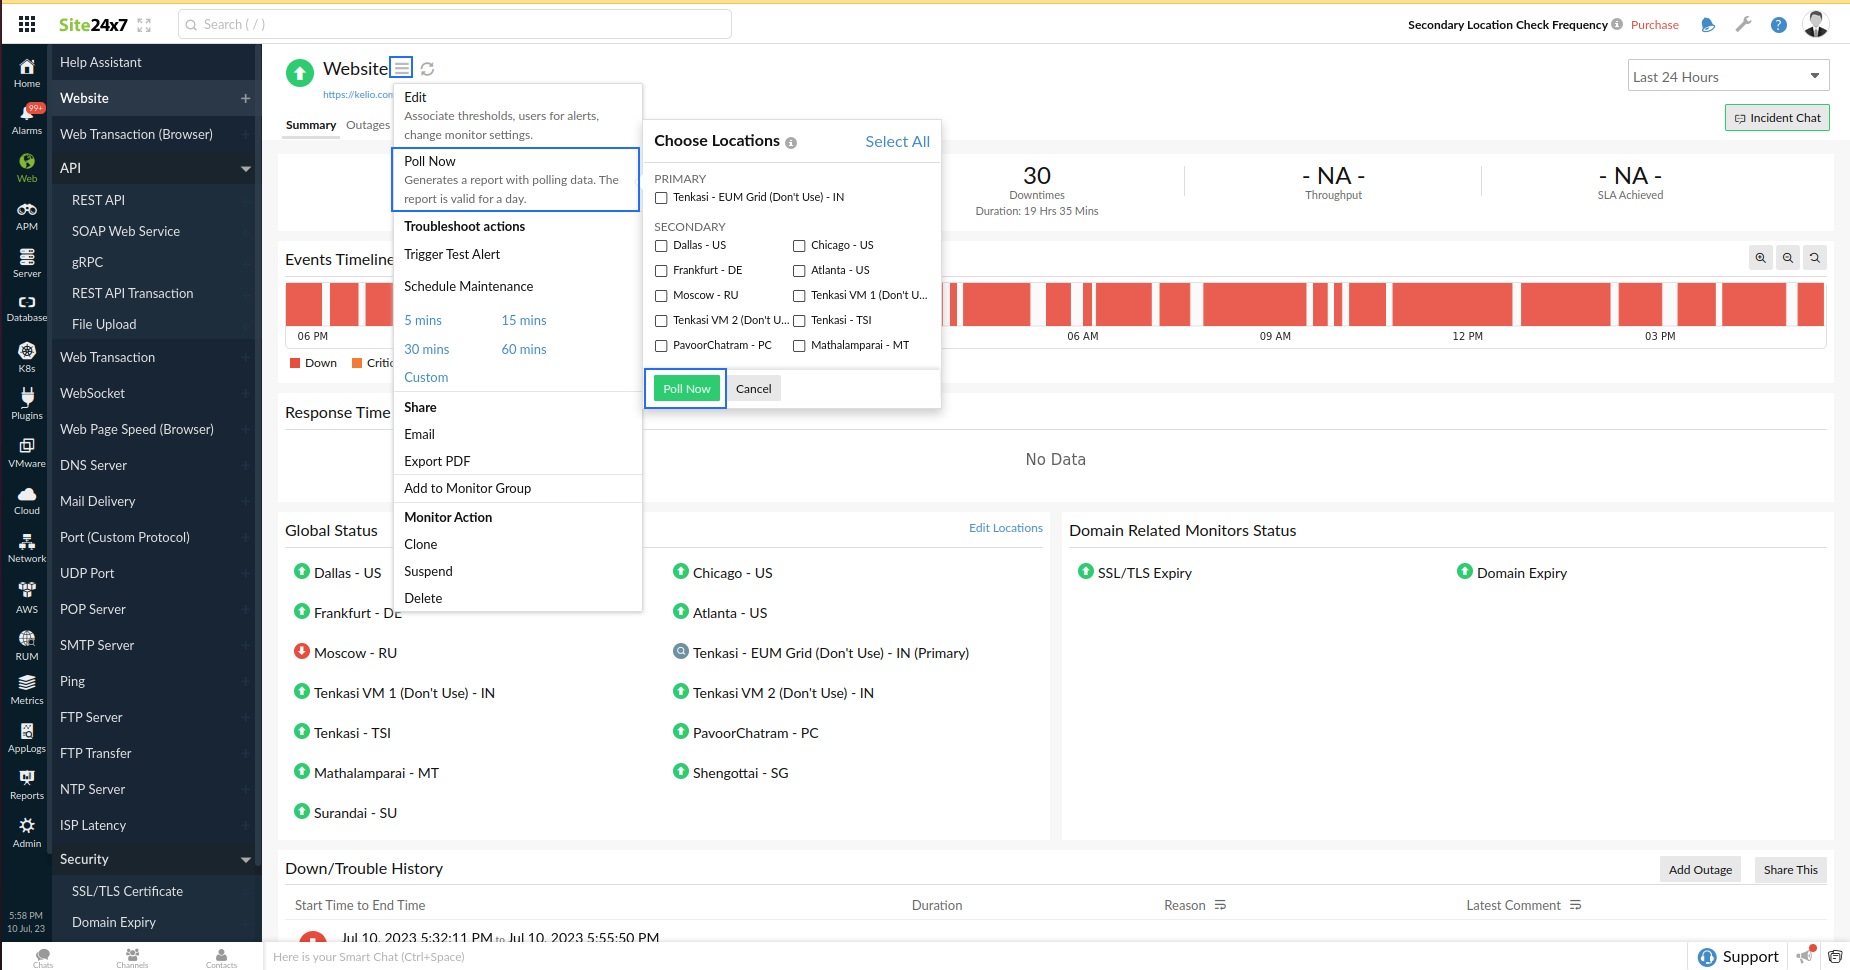
You can also hover over the hamburger icon next to the individual monitors in Home > Monitors to initiate polling by clicking Poll Now.
Supported monitor types
Website monitors
The Poll Now report for Website monitors include:
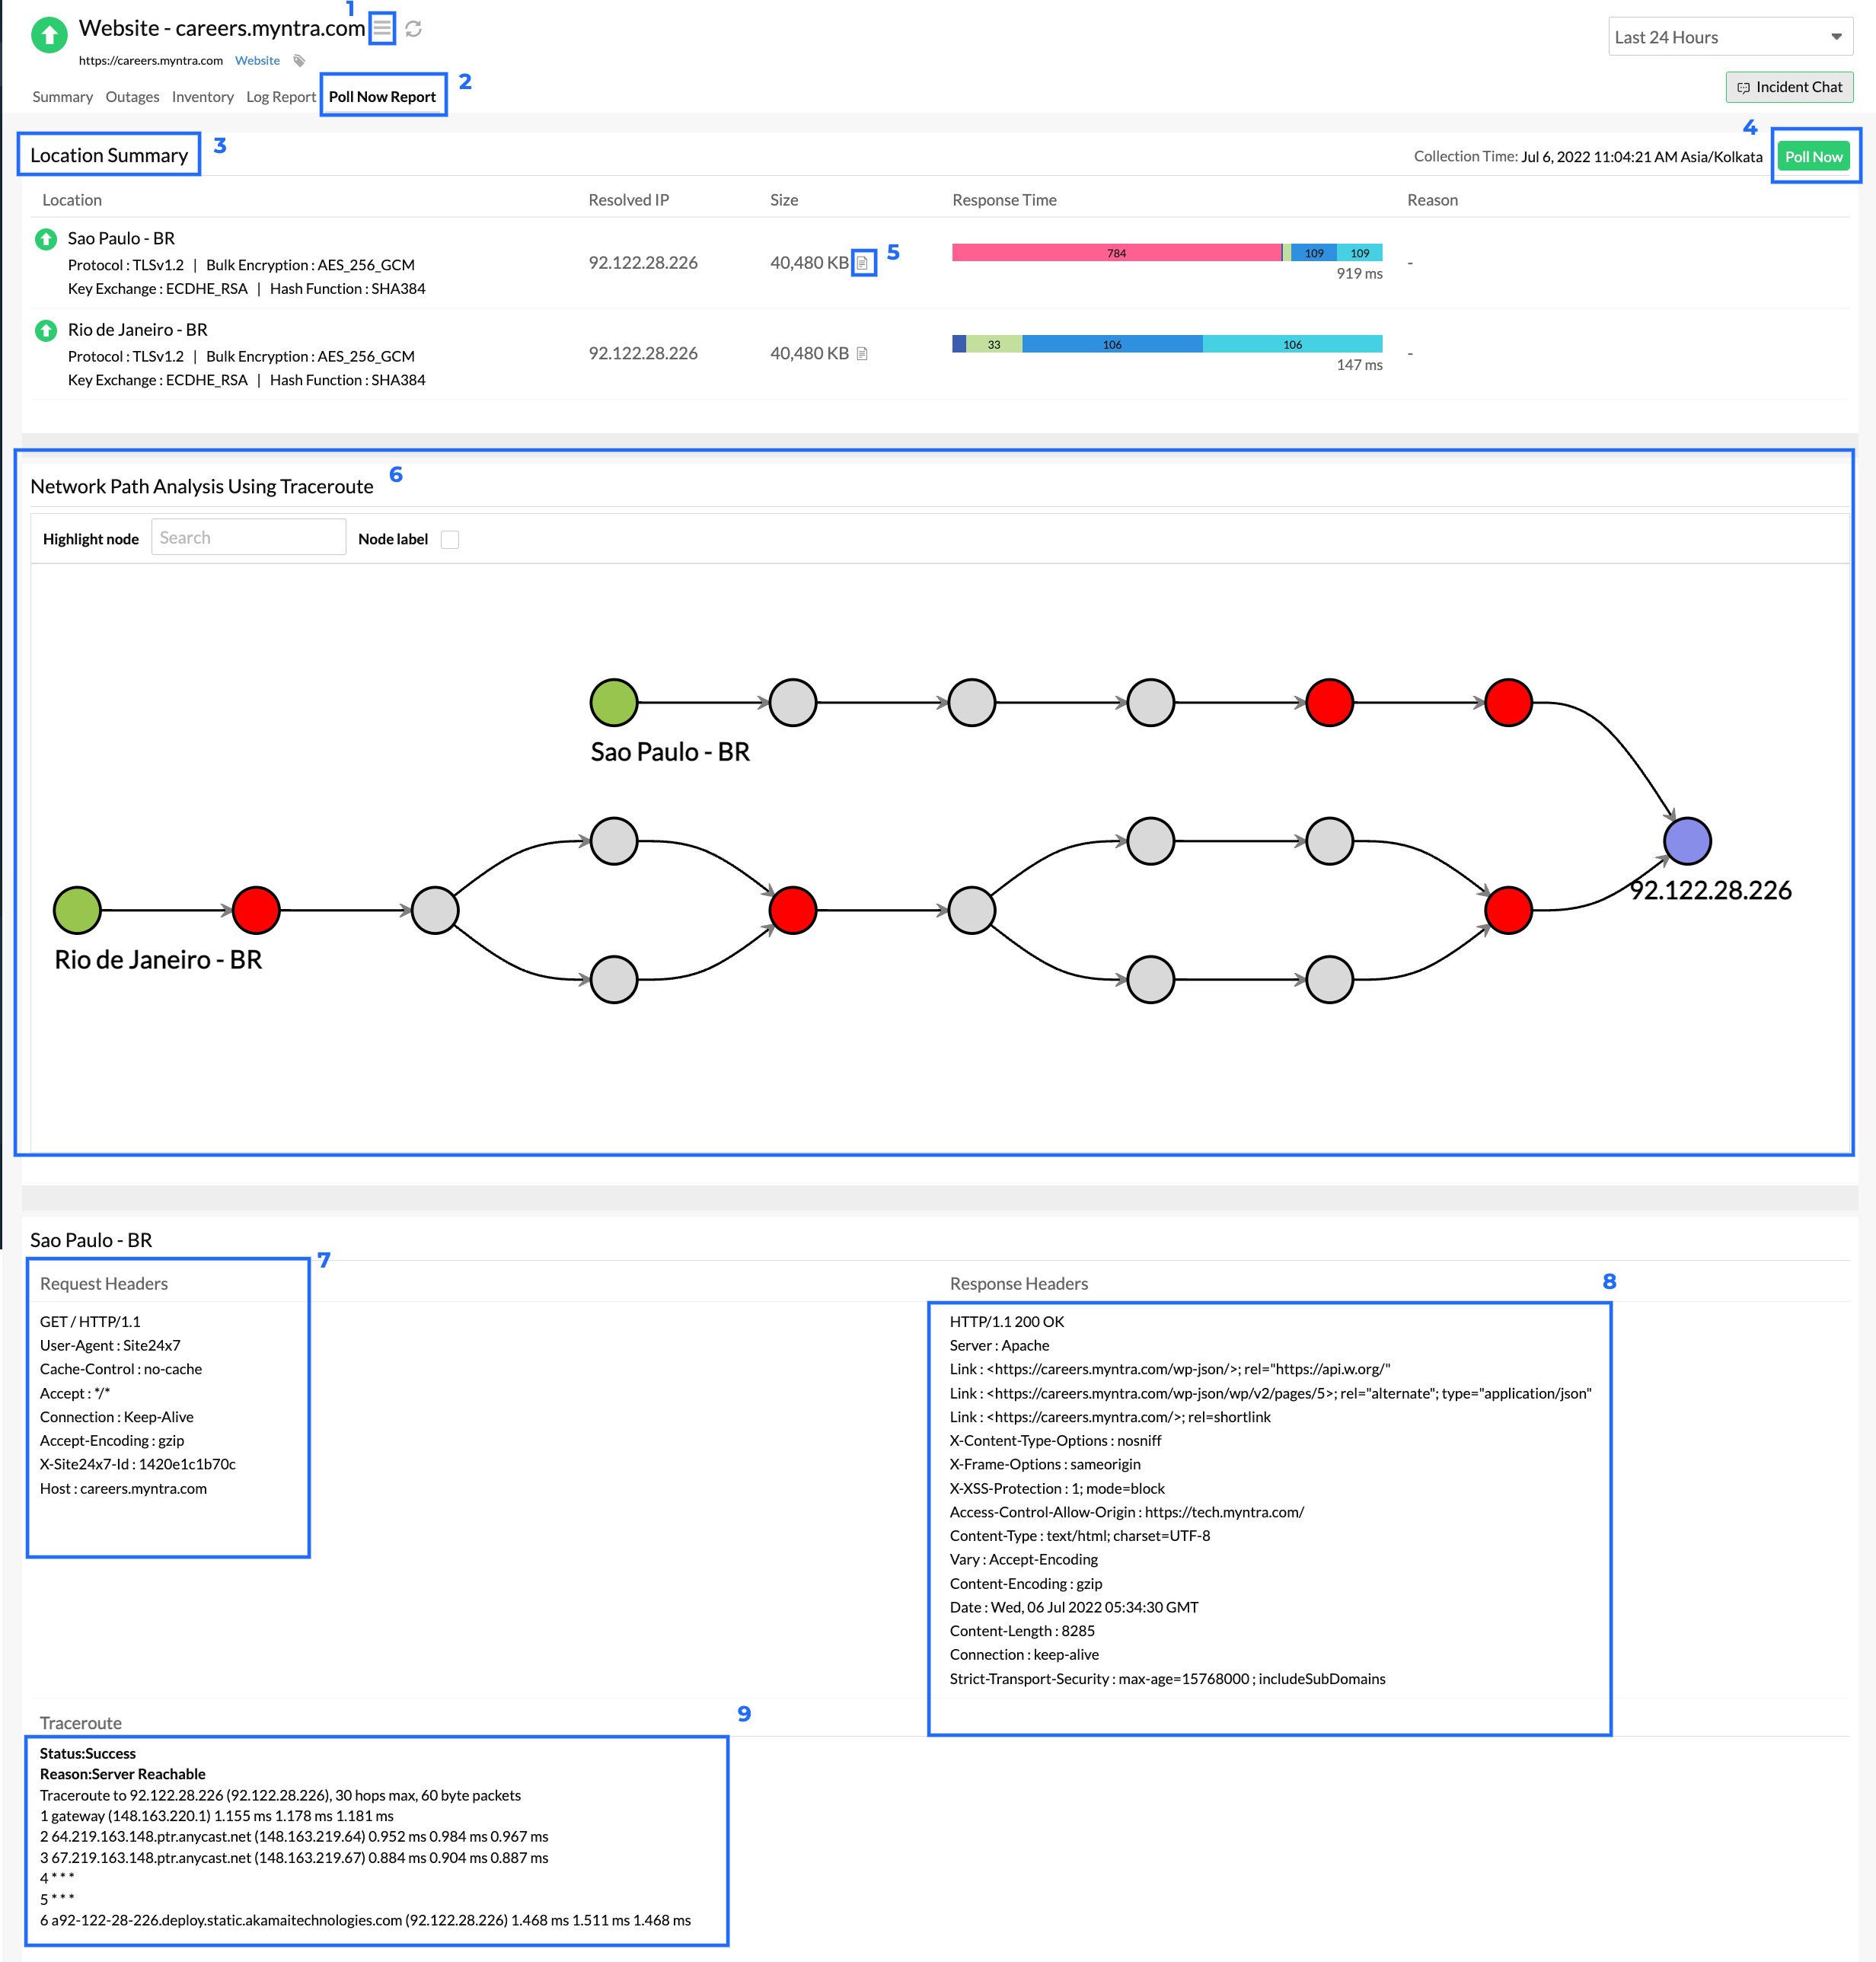
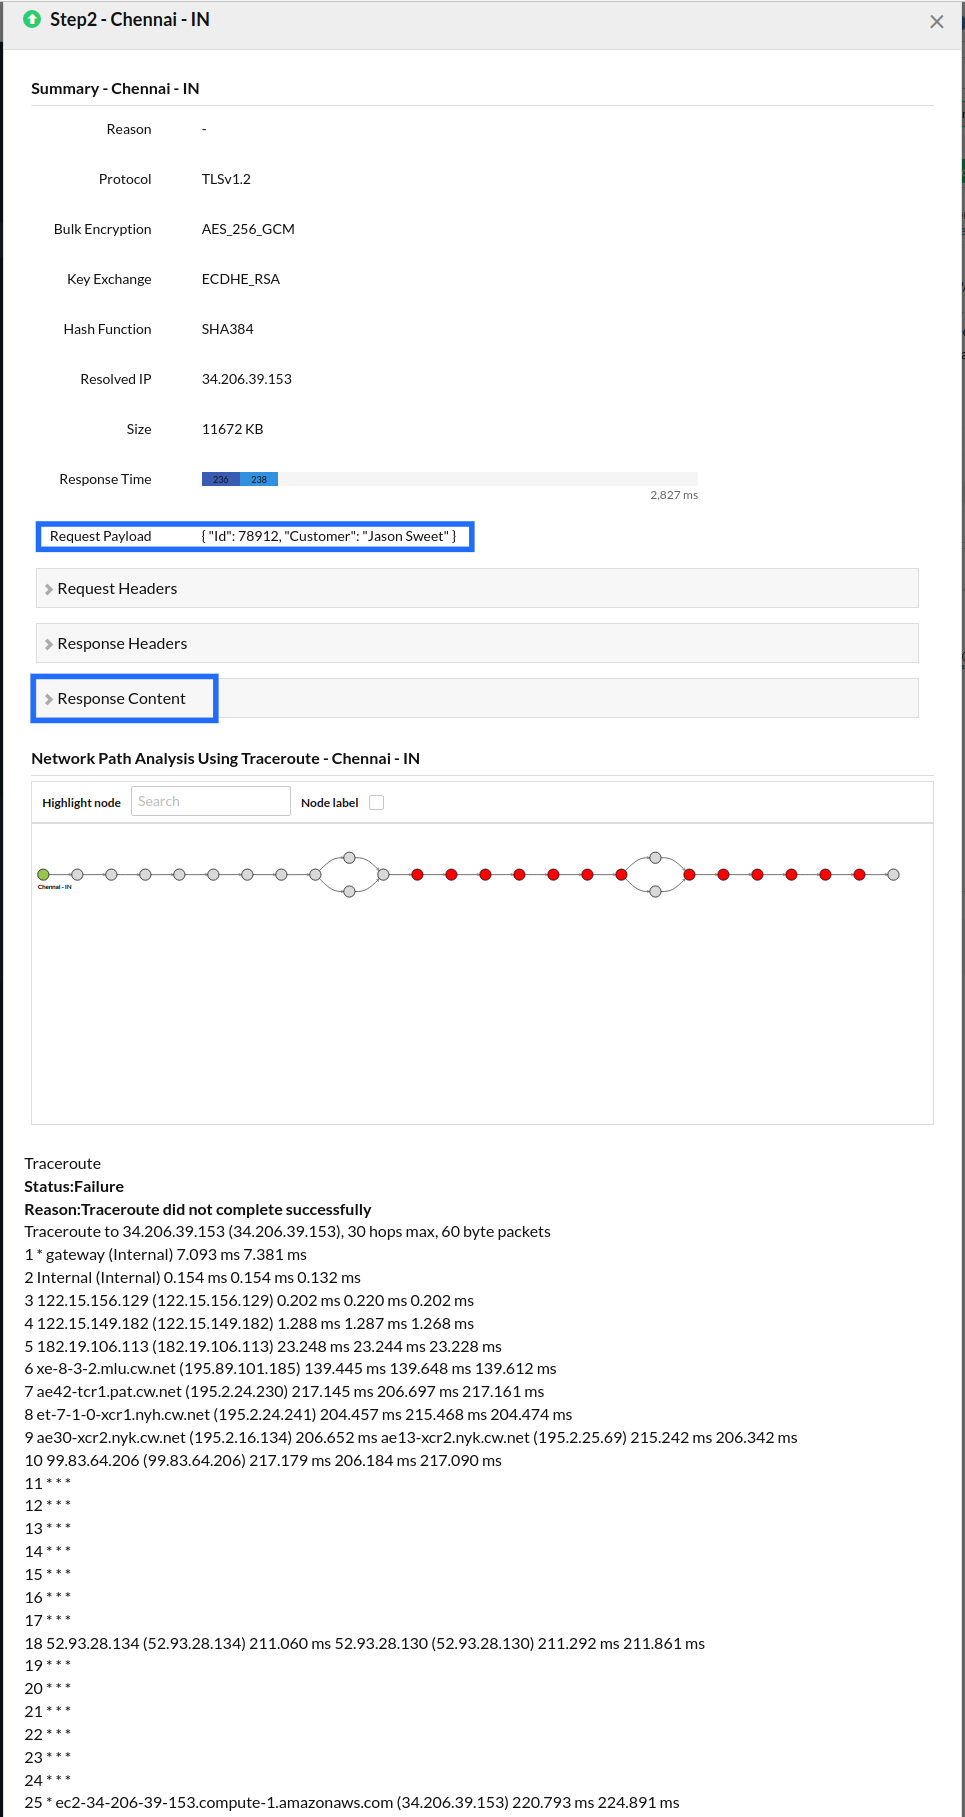
- Poll Now: You can use the Poll Now button (item 4 in Fig. 2) on the top-right side of the report to initiate another poll to confirm the metrics. The button will be available as long as the report is available.
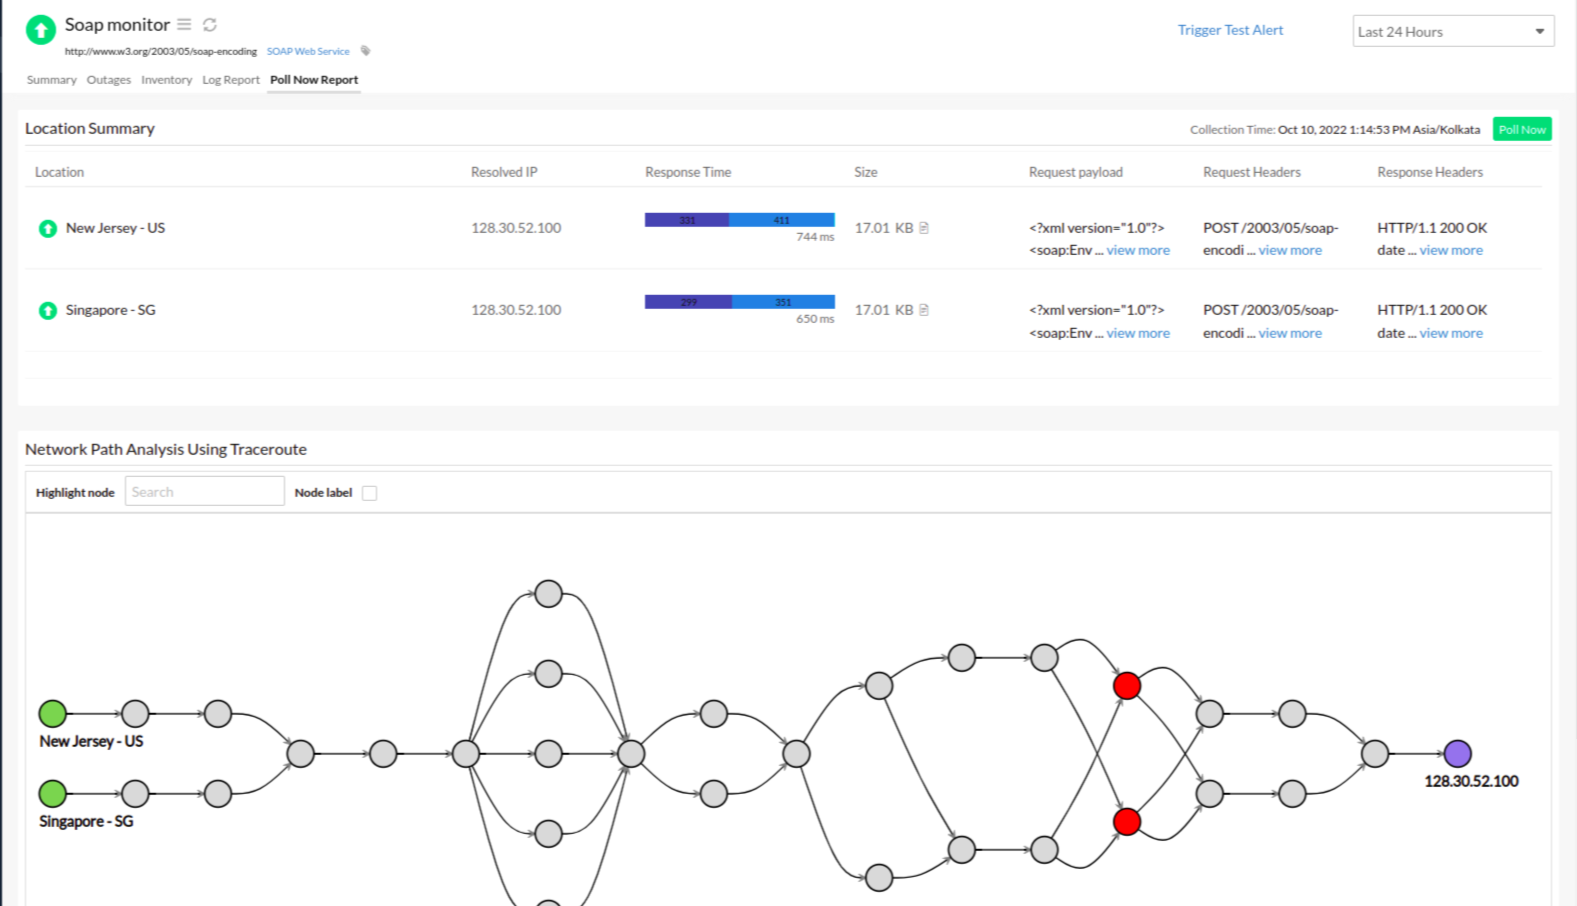
- Location Summary(item 3 in Fig. 2) offers the following details:
- Location: All configured locations
- Response Time: Includes DNS time, connection time, first byte time, and download time
- Size: Size of the downloaded files
- Response Content: Click the icon next to size to view the content in the API response.(item 5 in Fig.2)
- Resolved IP: The associated IPs
- Reason: Reason for the delay
- Network Path Analysis Using Traceroute (item 6 in Fig. 2)
- Traceroute: Network and traceroute metrics (item 9 in Fig. 2) to analyze the network latency between locations
- Request Headers: For each location, associated request headers (item 7 in Fig. 2) will be listed.
- Response Headers: Lists the associated response headers (item 8 in Fig. 2) for each location
REST API, REST API Transaction, and SOAP monitors
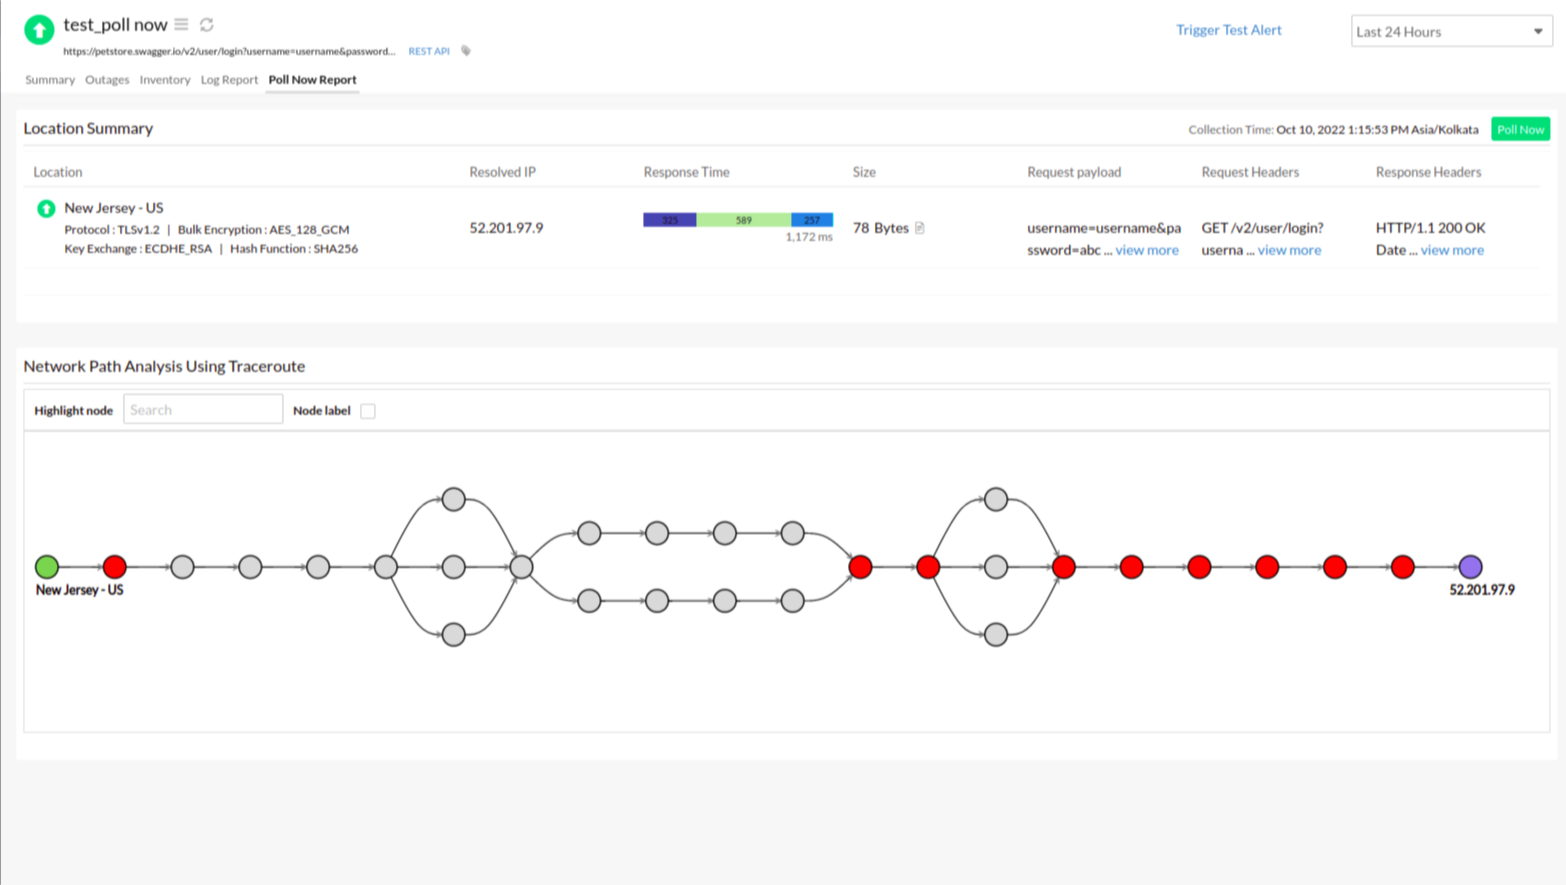
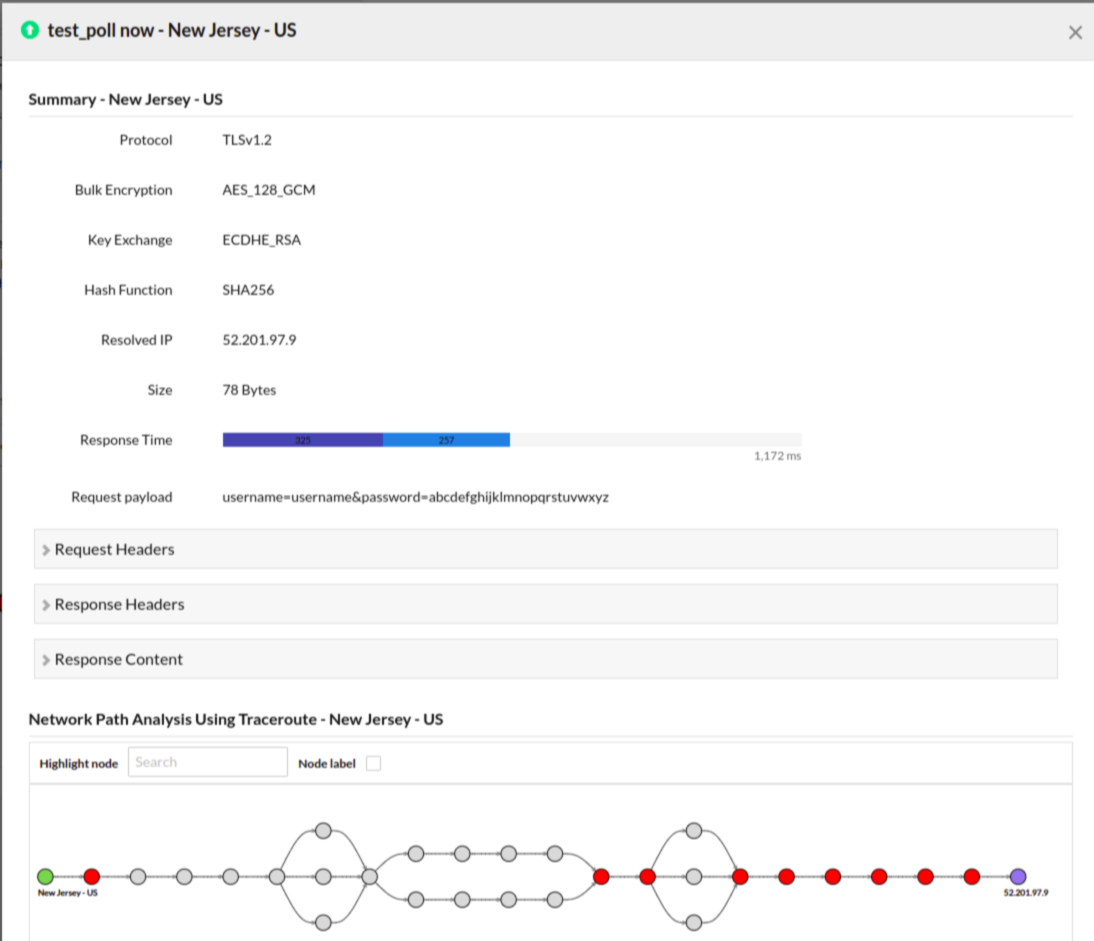
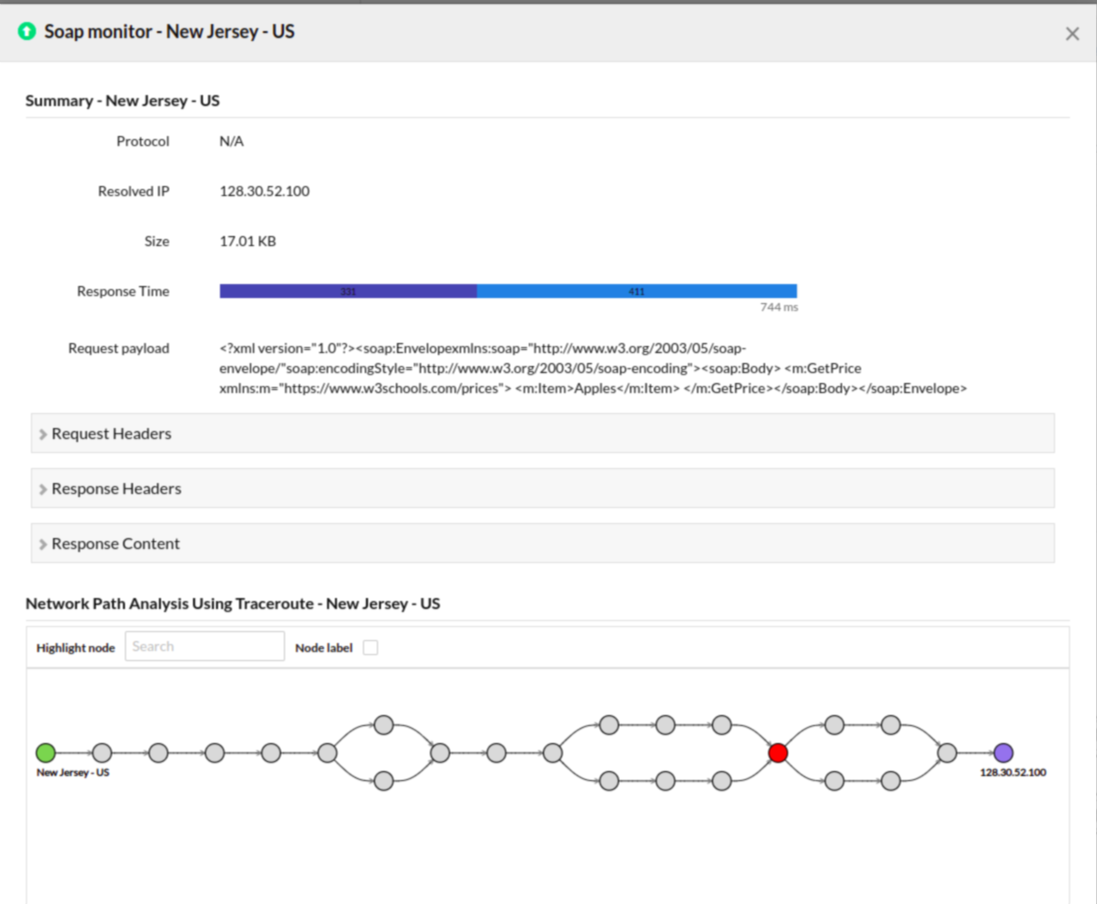
The Poll Now report for REST API, REST API Transaction, and SOAP monitors display the Request Payload apart from the other details provided in the Poll Now reports for Website monitor.
Ping monitors
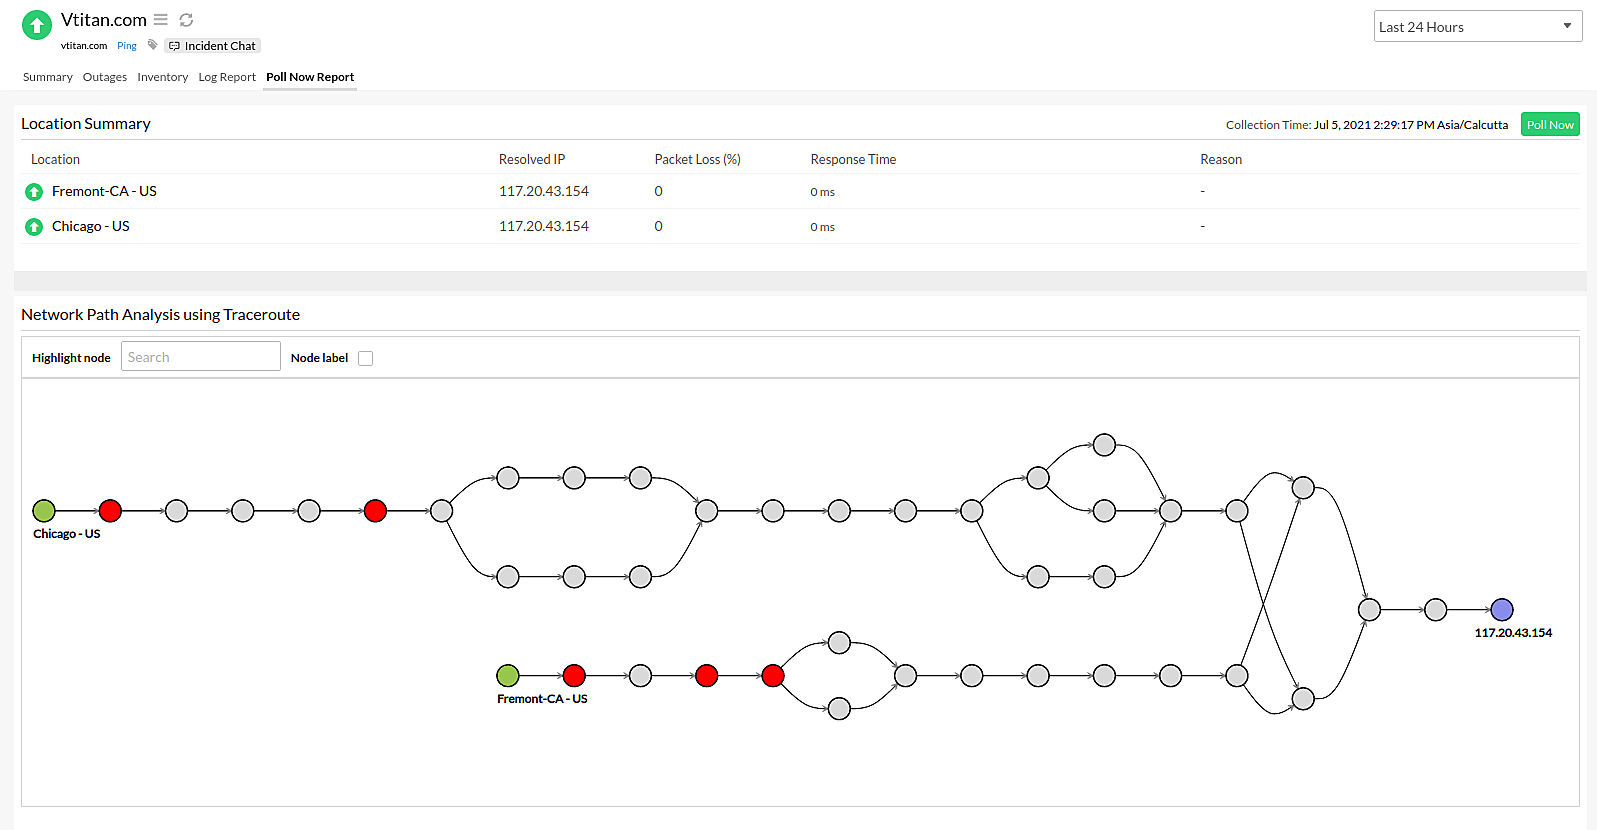
The Poll Now report for Ping monitors display the packet loss percentage, Location Summary, Poll Now button, and Network Path Analysis Using Traceroute.
Web Transaction (Browser) monitors
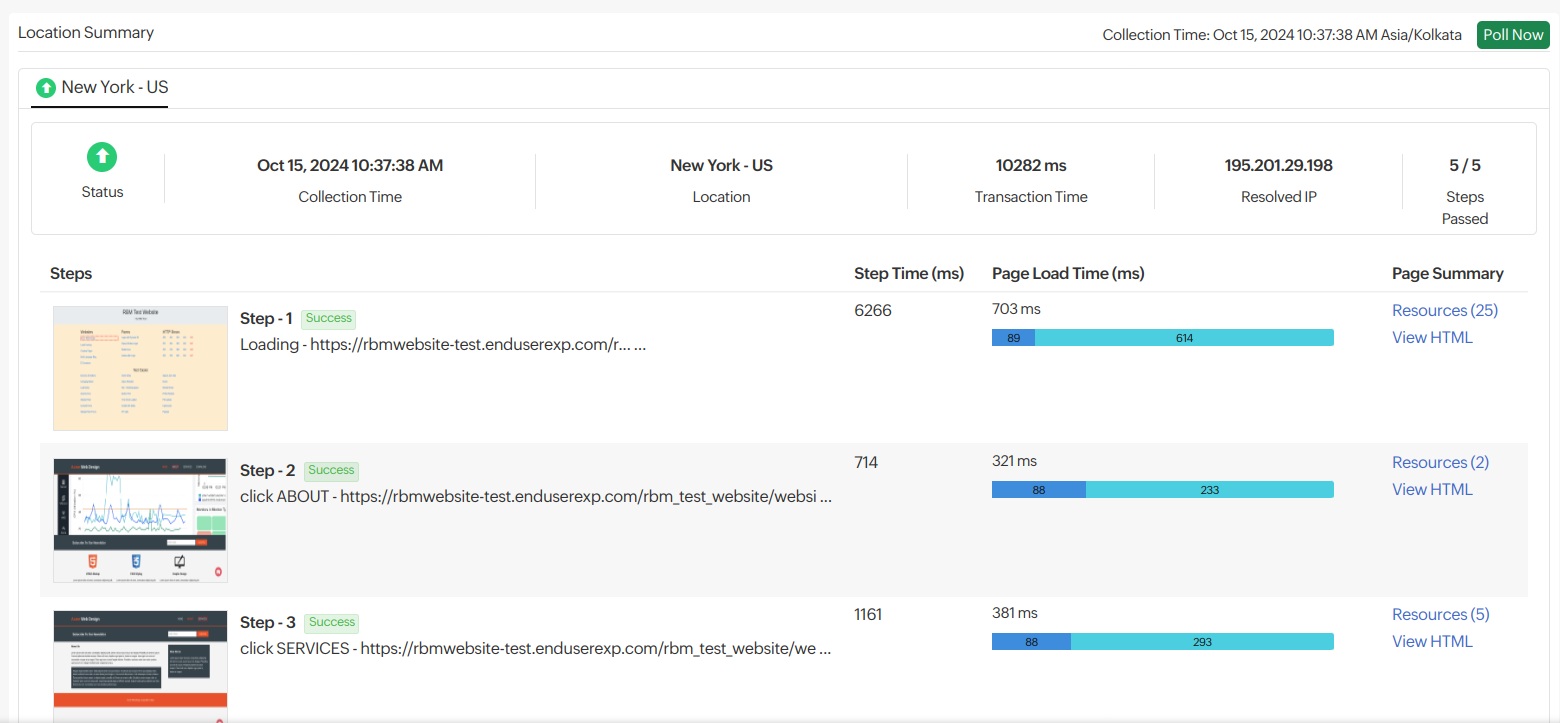
The Poll Now Report for Web Transaction (Browser) monitors includes information like the Location Summary for the selected poll location. It displays the Status, Collection Time, Location, Transaction Time, Resolved IP, and Steps Passed. Step screenshots with the page summary details, like the Resources (Waterfall chart), Console Errors, and HTML are also displayed.
- Waterfall chart: You can obtain waterfall charts with HTTP status codes; size and page load time of each resources; and breakup of the response time, which includes DNS lookup time, connection time, first byte time, content download time, render start time, and document completion time.
- Console Errors: You can view the list of errors of a particular step in the browser's developer console, such as Java script errors, network errors, and more. This will help you identify all resources and troubleshoot them.
- View HTML: Displays the HTML of the page.
- Location Summary: You can get the comprehensive summary of your report based on the selected polling location.
- Step Details: You can get the step details, such as the screenshot of the steps, the action, the Step Time, the Page Load Time, and the Page Summary.
Webpage Speed (Browser) monitors
The Poll Now report for Webpage Speed (Browser) monitors includes a Waterfall Chart, Summary Page, the Poll Now button, Location Summary, Network Path Analysis Using Traceroute, Request Headers, Response Headers, and Traceroute.
- Waterfall Chart: You can obtain waterfall charts with HTTP status codes, size and page load time of each resources, breakup of the response time which includes DNS lookup time, connection time, first byte time, content download time, render start time, and document complete time.
- Webpage Summary: Includes data from individual polls, graphical representations of content checks, details of page elements, etc.
- Domain Summary: Includes details about the domains
