APM Reports
Analyze and compare your application's performance with Reports. Site24x7 generates reports for Average Response Time, Apdex score, Throughput, Database Response Time at application / instance level.
To view reports:
- Click on APM > APM Insight Dashboard
- Choose the Application/Instance > Click on "View Performance Reports"
- Customize the time period to view your reports
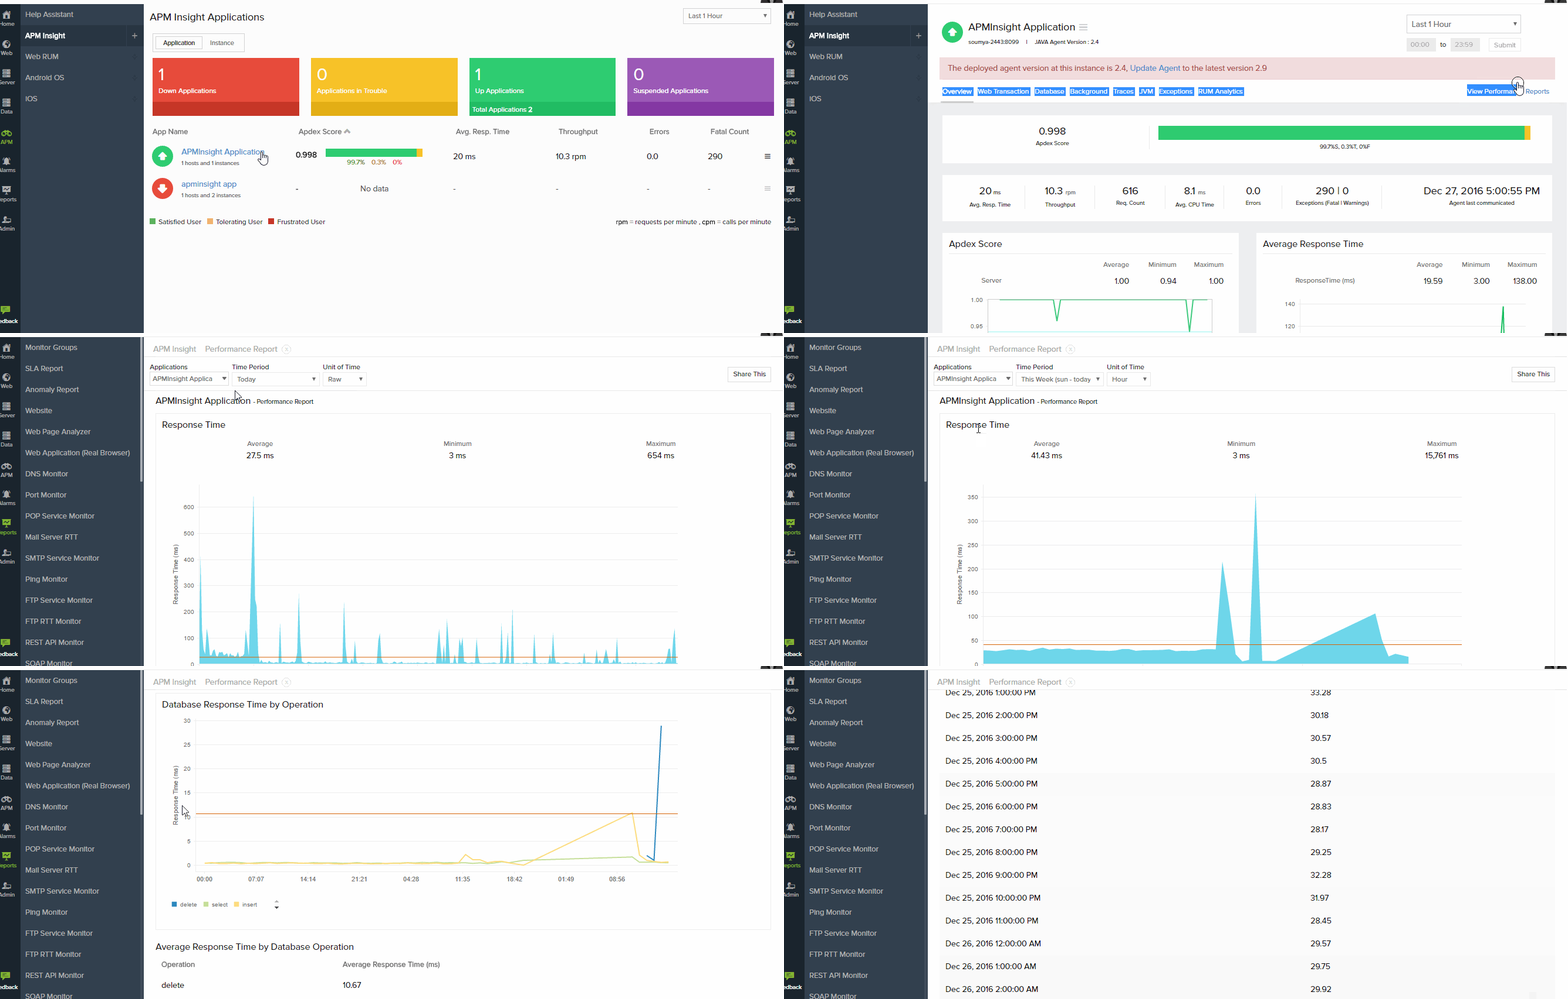
- Reports can be downloaded in CSV / PDF format. Click on "Share This" icon to publish / email / schedule reports.
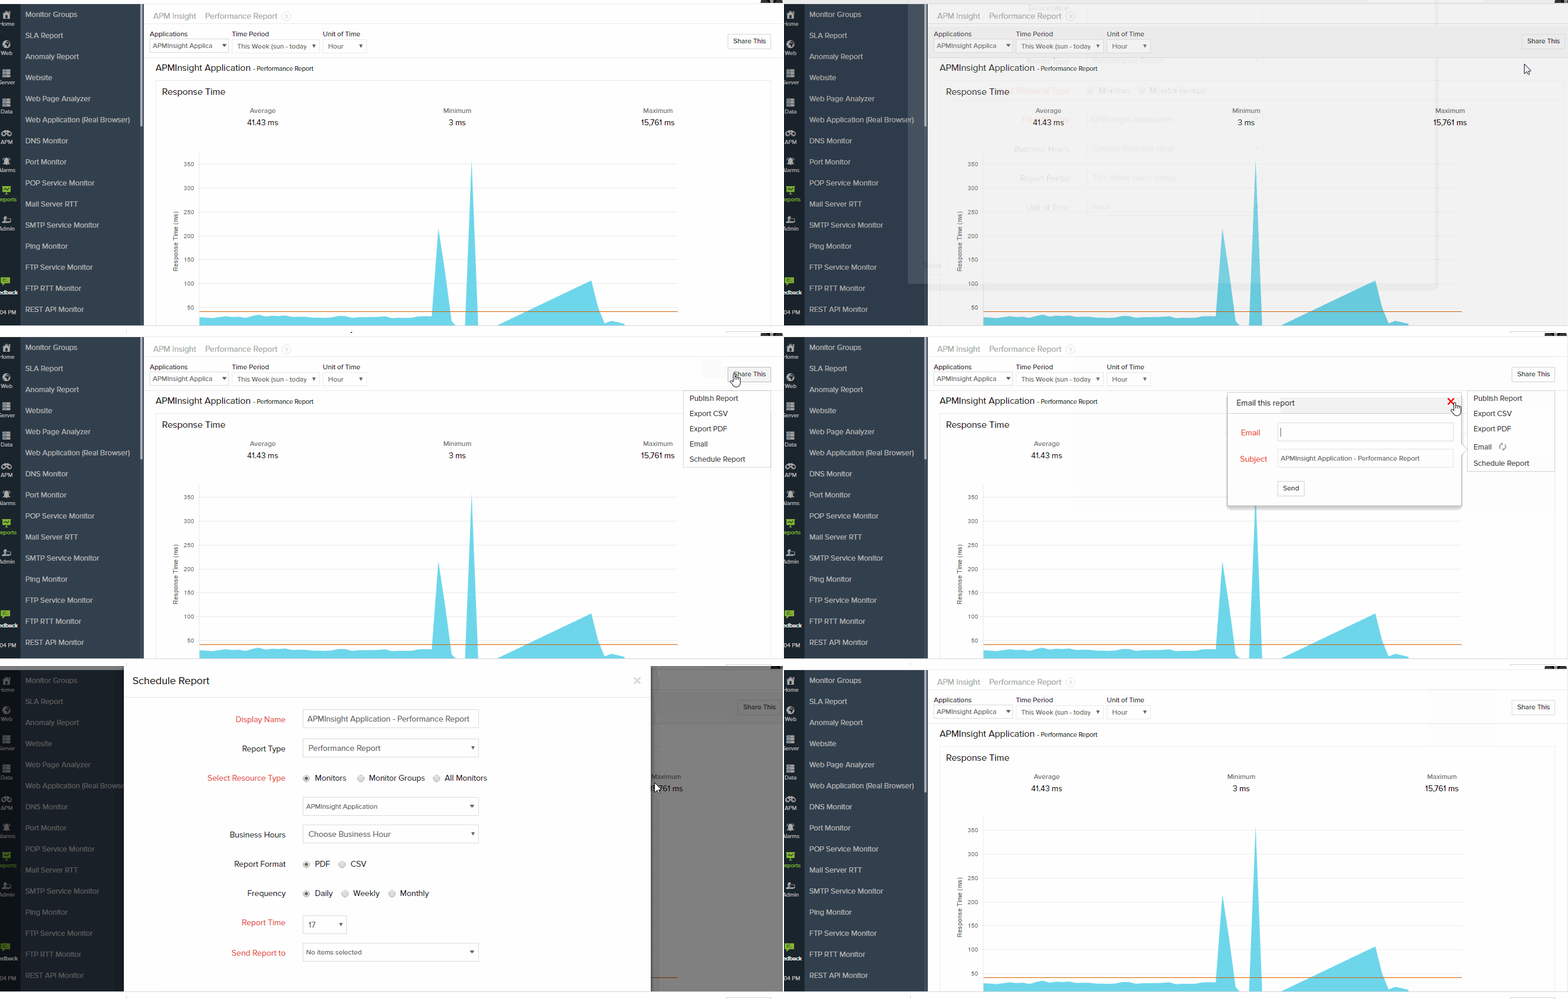
View Performance Reports
With Performance Reports, one can easily drill down to view application performance at a granular level. This can help identify applications with poor response time, database time by operations, throughput performance and apdex score of the applications.
You can view performance trend of your applications over a period of time with the help of archived data.
- Click on Home > Reports > APM Reports > Performance Reports
- Choose Application from the Drop Down menu to view its performance trend
- Time Period: Customize your time period along which you need to view the performance of your applications.
- Application's performance over a specific time period can be viewed by choosing "Custom Time Period"
- Performance report can be generated for single application or as a consolidated report for all applications. This can be done by selecting 'All APM applications' under the drop down menu.
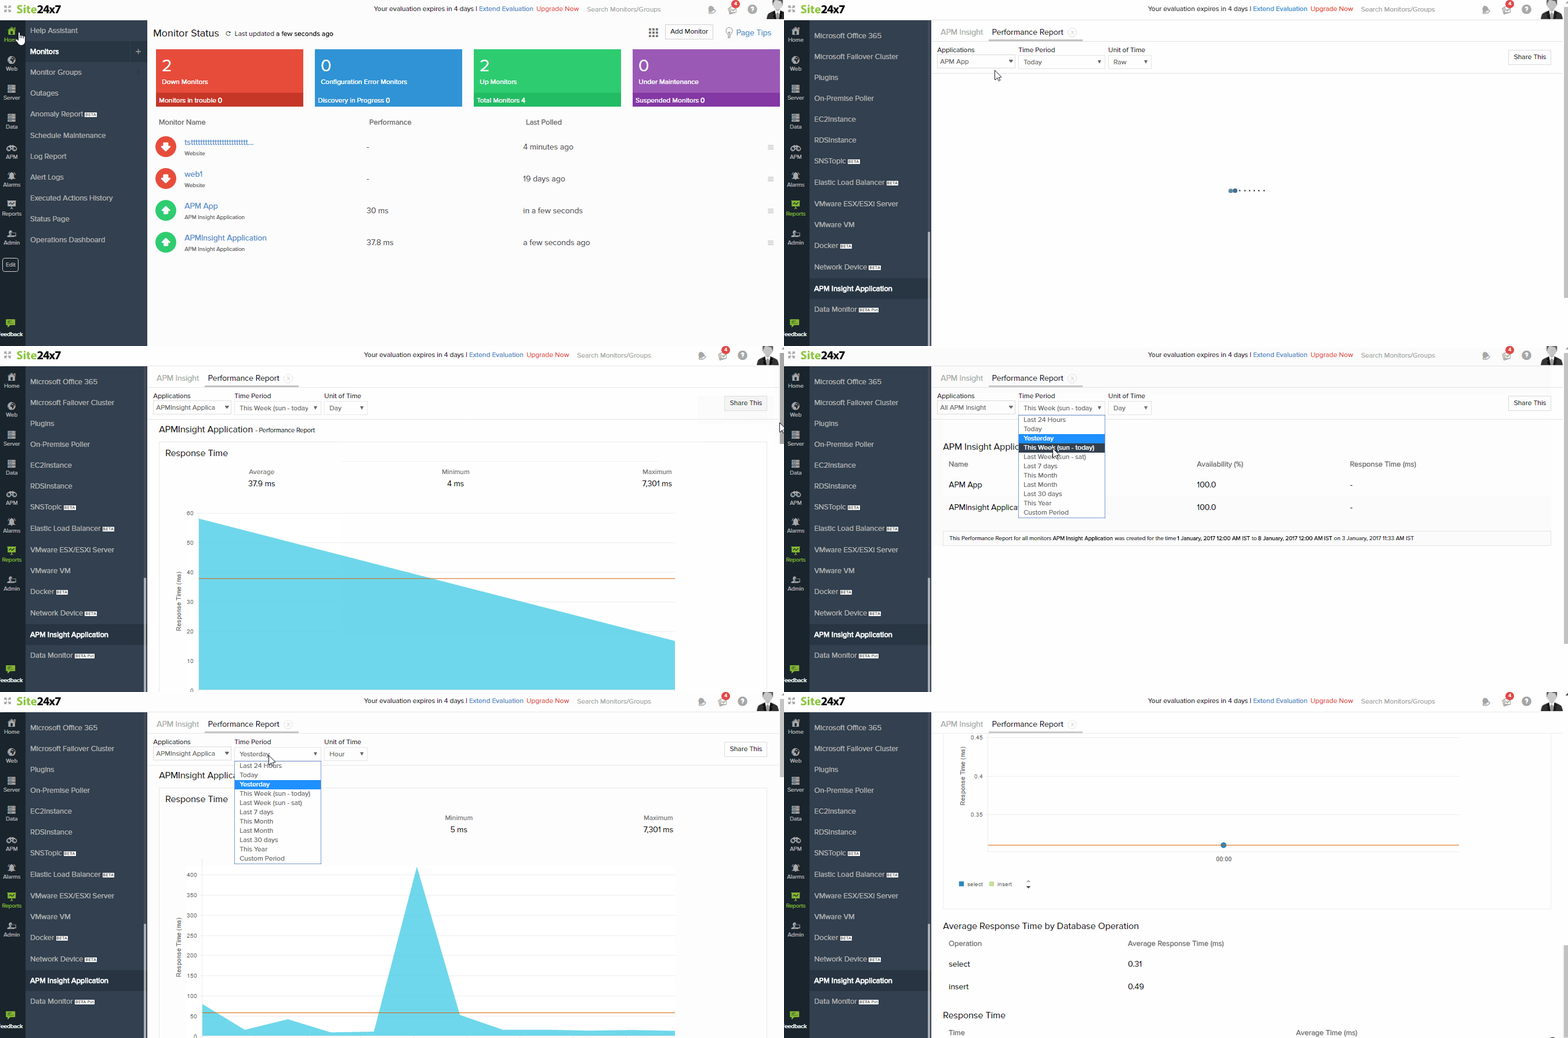
- Classification of Apdex score ( Satisfied, Tolerated and Frustrated count) can be viewed for all APM Insight monitors and monitor groups under APM Insight Performance reports.

For Java applications,JVM metrics like Heap memory, GC count and GC time are also displayed.
Top N & Bottom N Reports
The Top N & Bottom N Reports section lists the various types of reports for which top N and Bottom N reports can be generated.
Generate Top N & Bottom N Report
- Log in to the Site24x7 web client.
- Navigate to Reports > APM Reports > Top N & Bottom N Report.
- Click on the report you want to generate.
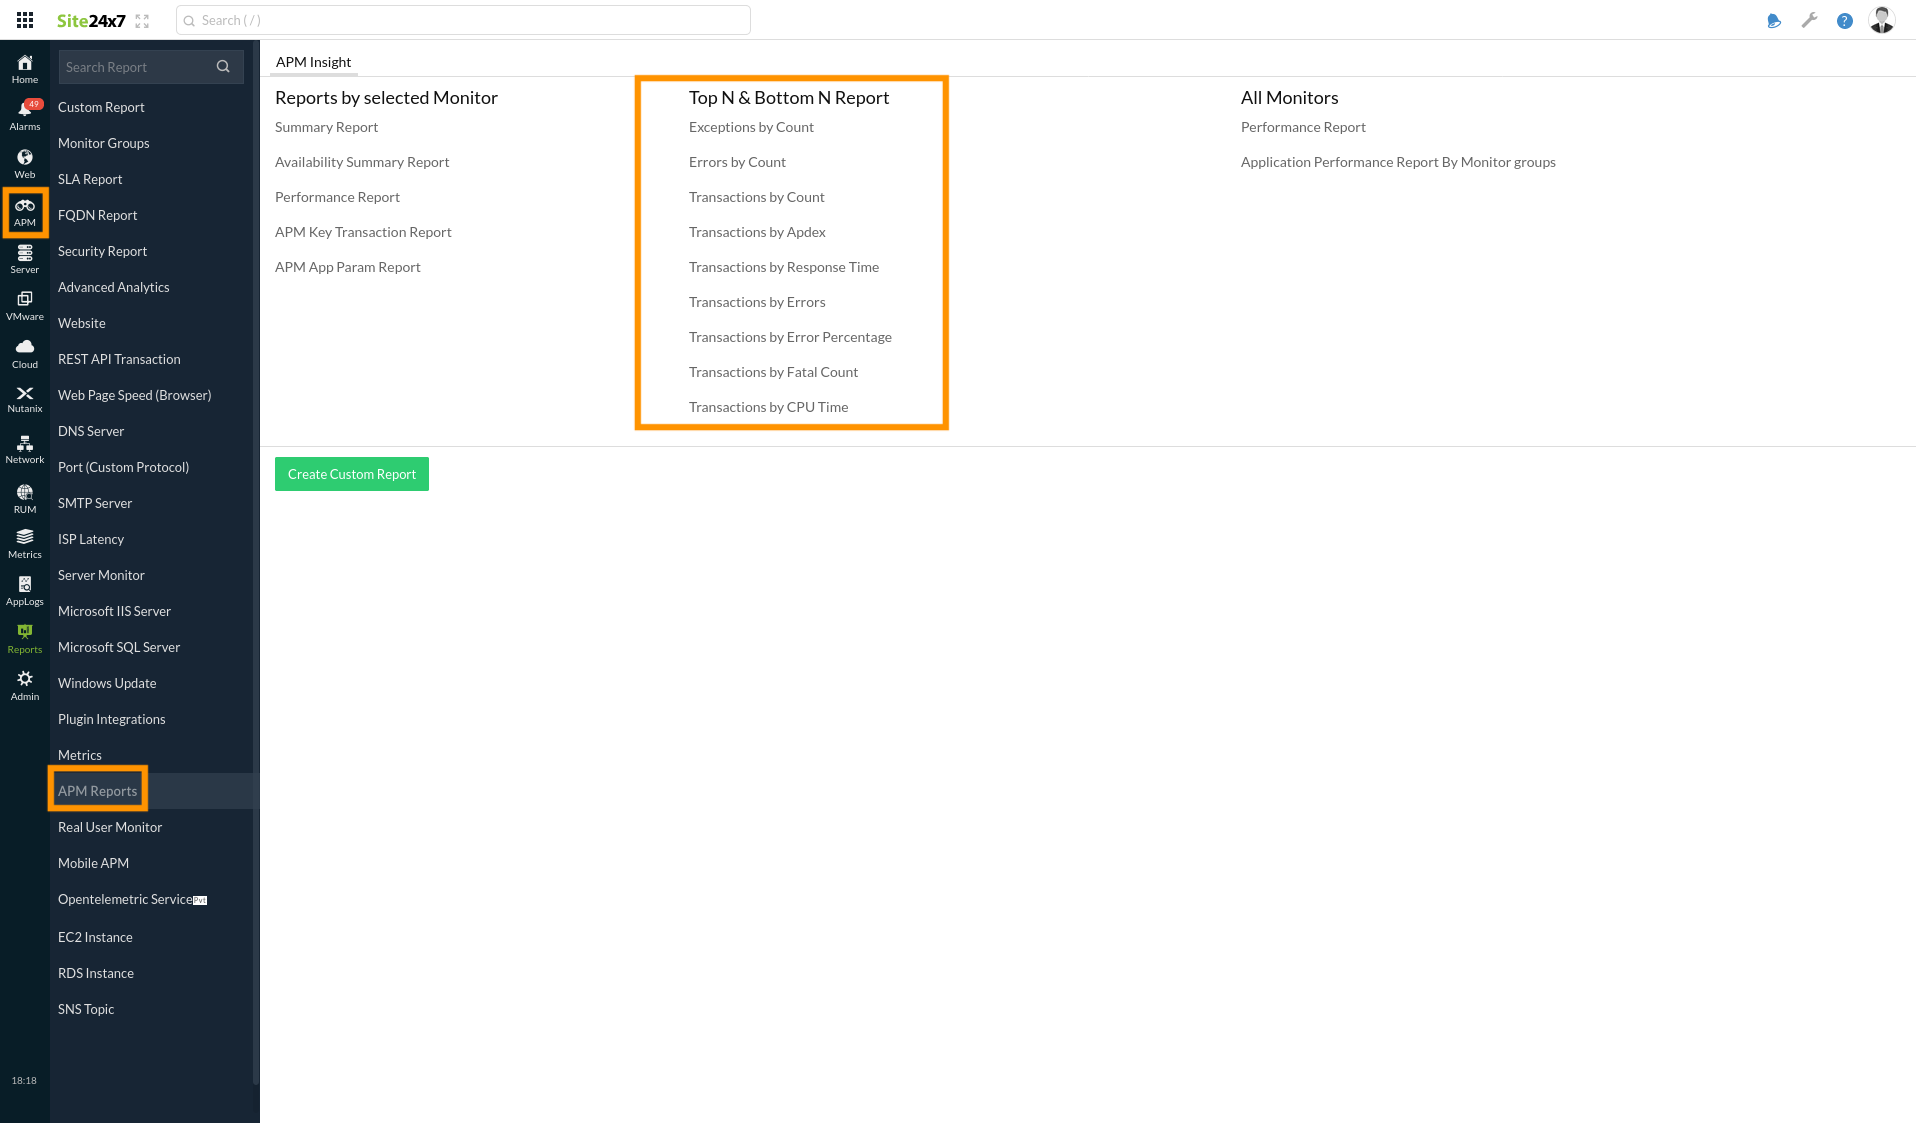
The following table provides insight into the various parameters listed under the Top N & Bottom N Report.
| Monitors | Top N & Bottom N Metrics | Other Metrics and Data |
| APM | Exceptions | Exception Count |
| Errors | Error Count | |
| Transactions by Count | Apdex Score, Req. Count, Resp. Time (ms), Error Count, Fatal Count, Error Rate (%), CPU Time (ms) | |
| Transactions by Apdex | Apdex Score, Req. Count, Resp. Time (ms), Error Count, Fatal Count, Error Rate (%), CPU Time (ms) | |
| Transactions by Response Time | Apdex Score, Req. Count, Resp. Time (ms), Error Count, Fatal Count, Error Rate (%), CPU Time (ms) | |
| Transactions by Errors | Apdex Score, Req. Count, Resp. Time (ms), Error Count, Fatal Count, Error Rate (%), CPU Time (ms) | |
| Transactions by Error Percentage | Apdex Score, Req. Count, Resp. Time (ms), Error Count, Fatal Count, Error Rate (%), CPU Time (ms) | |
| Transactions by Fatal Count | Apdex Score, Req. Count, Resp. Time (ms), Error Count, Fatal Count, Error Rate (%), CPU Time (ms) | |
| Transactions by CPU Time | Apdex Score, Req. Count, Resp. Time (ms), Error Count, Fatal Count, Error Rate (%), CPU Time (ms) |
The following examples show you how to generate the Top N and Bottom N reports for the Exceptions by Count and Errors by Count reports in detail.
View Exceptions Report
The Exceptions Report makes it easy to drill down on exceptions to the granular level. This helps identify the top N and bottom N exception classes and the number of exceptions that occurred in each class.
Generate the Exceptions Report
You can view the Top N Exceptions and Bottom N Exceptions reports of the selected application over a period of time by following the steps below:
- Log in to the Site24x7 web client.
- Navigate to Reports > APM Reports > Exceptions by Count.
- Change the listed parameters to view a customized report.
- Applications: Select the application for which you want to generate the errors report.
- Show: Choose the top 5, 10, 20, 25, 50, or 100 or the bottom 5, 10, 20, 25, 50, or 100 from the drop-down list.
- Time Period: Choose the required time period.
Note
The user can generate a Top N or Bottom N Exceptions Report for the following time slots: Last Hour, Last 6 Hours, Last 12 Hours, Last 24 Hours, Today, Yesterday, This Week, Last Week, Last 7 Days, Last 30 Days, This Month, Last Month.
- Once the report is generated, click the Share Thisbutton in the top right corner.
-
- Publish Report: Click Publish Report and populate the form. This creates a permalink that makes the report accessible to APM customers without a Site24x7 login.
- Email: Share the report via email. Emails can only be sent to verified users who have agreed to receive emails from Site24x7.
- Export CSV: Export the report as a CSV file.
- Export PDF: Export the report as a PDF file.
- Schedule Report: Populate the Schedule Report form to send the Top N and Bottom N Errors Reports as emails to customers at scheduled times.
-
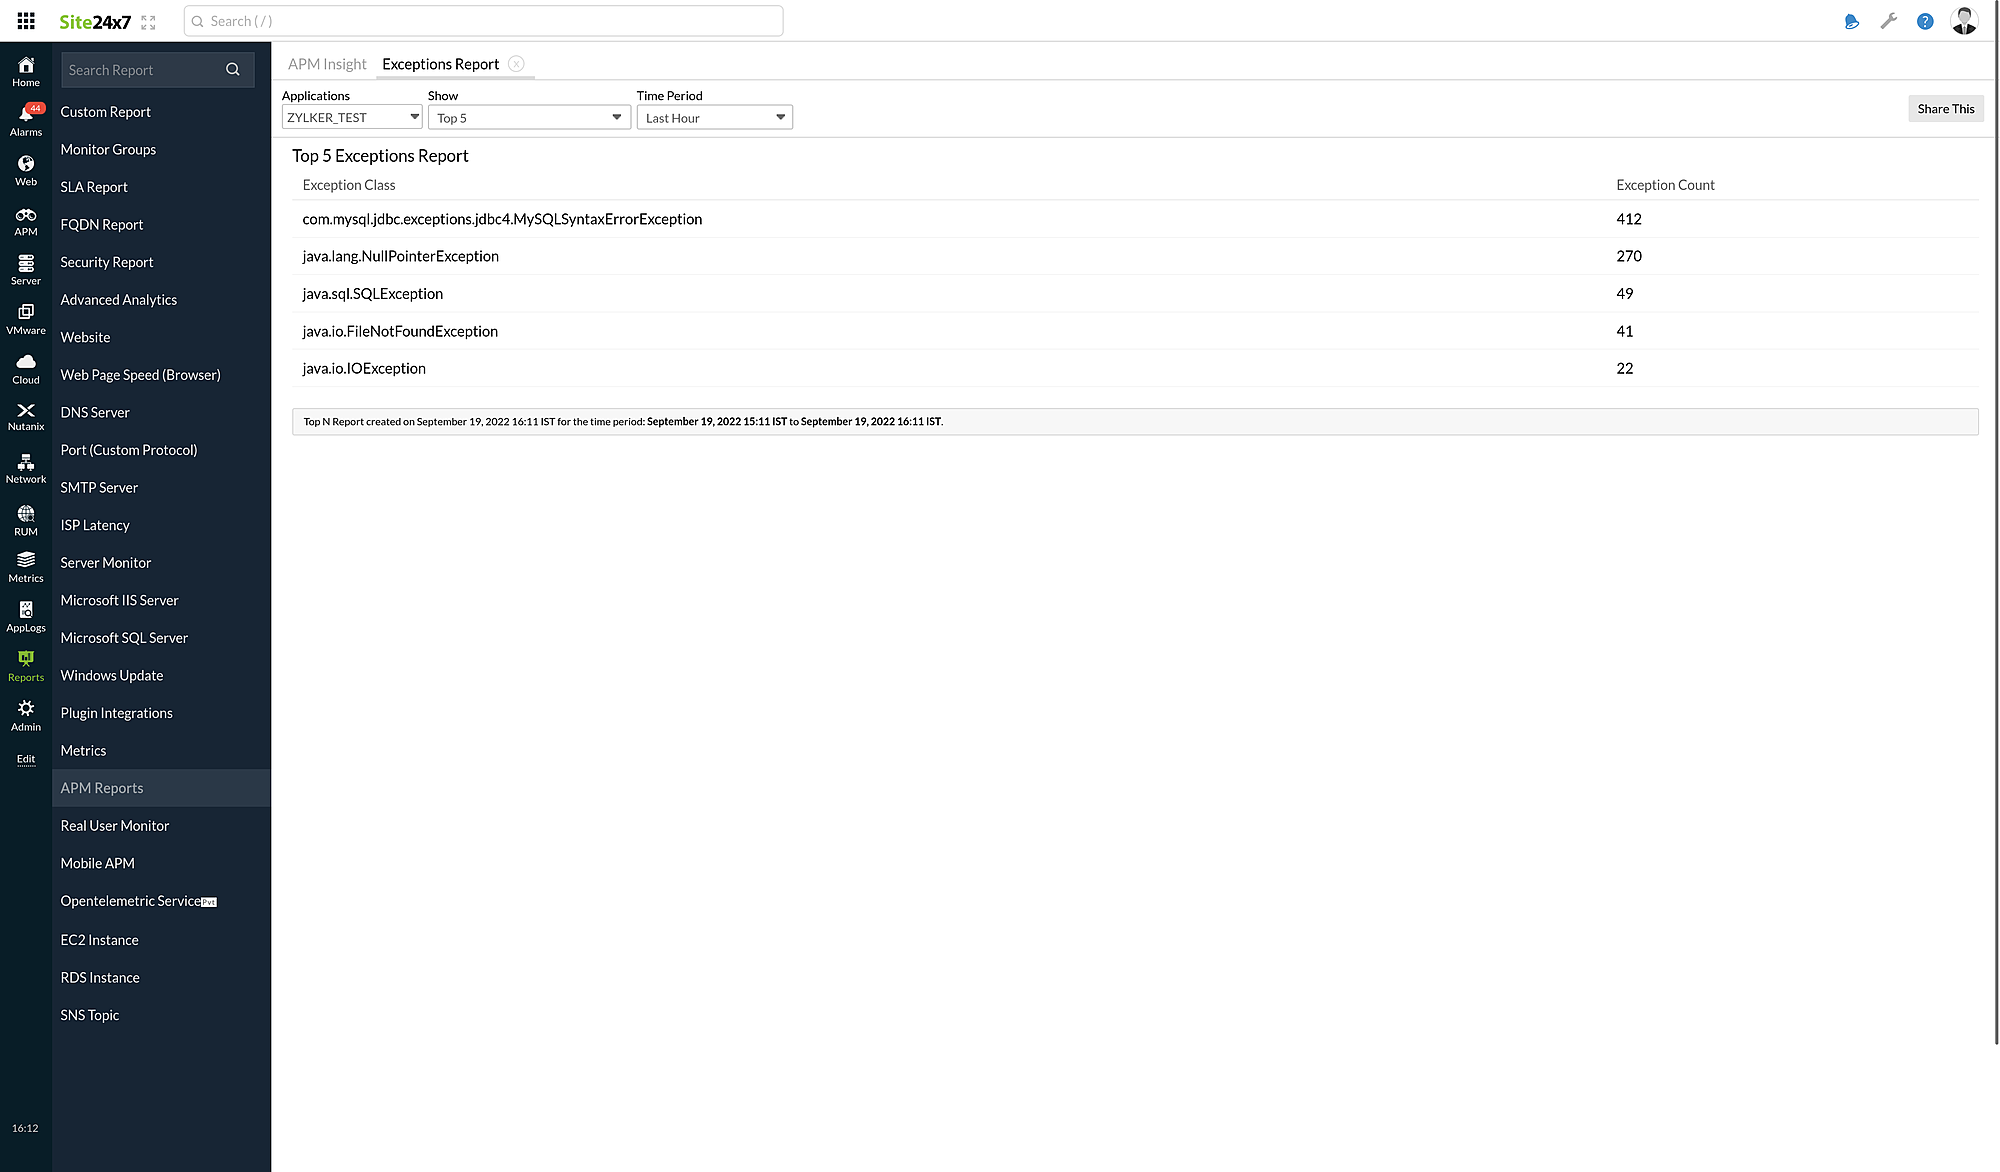
You can also access this page from the Exceptions tab.
Navigate to APM > APM Insight > your application > Exceptions and click View Exceptions Report.

View Errors Report
The Errors Report outlines the errors that occur least and most along with the number of times they occurred in the selected application.
Generate the Errors Report
You can generate the Top N Errors and Bottom N Errors reports of the selected application over a period of time by following the steps below:
- Log in to the Site24x7 web client.
- Navigate to Reports > APM Reports > Errors by Count.
- Change the listed parameters to view a customized report.
- Applications: Select the application for which you want to generate the errors report.
- Show: Choose the top or bottom 5, 10, 20, 25, 50, or 100 from the drop-down list.
- Time Period: Choose the required time period.
Note
The user can generate a Top N or Bottom N Errors Report for the following time slots: Last Hour, Last 6 Hours, Last 12 Hours, Last 24 Hours, Today, Yesterday, This Week, Last Week, Last 7 Days, Last 30 Days, This Month, Last Month.
- Once the report is generated, click the Share This button in the top right corner.
-
- Publish Report: Click Publish Report and populate the form. This creates a permalink that makes the report accessible to APM customers without a Site24x7 login.
- Email: Share the report via email. Emails can only be sent to verified users who have agreed to receive emails from Site24x7.
- Export CSV: Export the report as a CSV file.
- Export PDF: Export the report as a PDF file.
- Schedule Report: Populate the Schedule Report form to send the Top N and Bottom N Errors Reports as emails to customers at scheduled times.
-
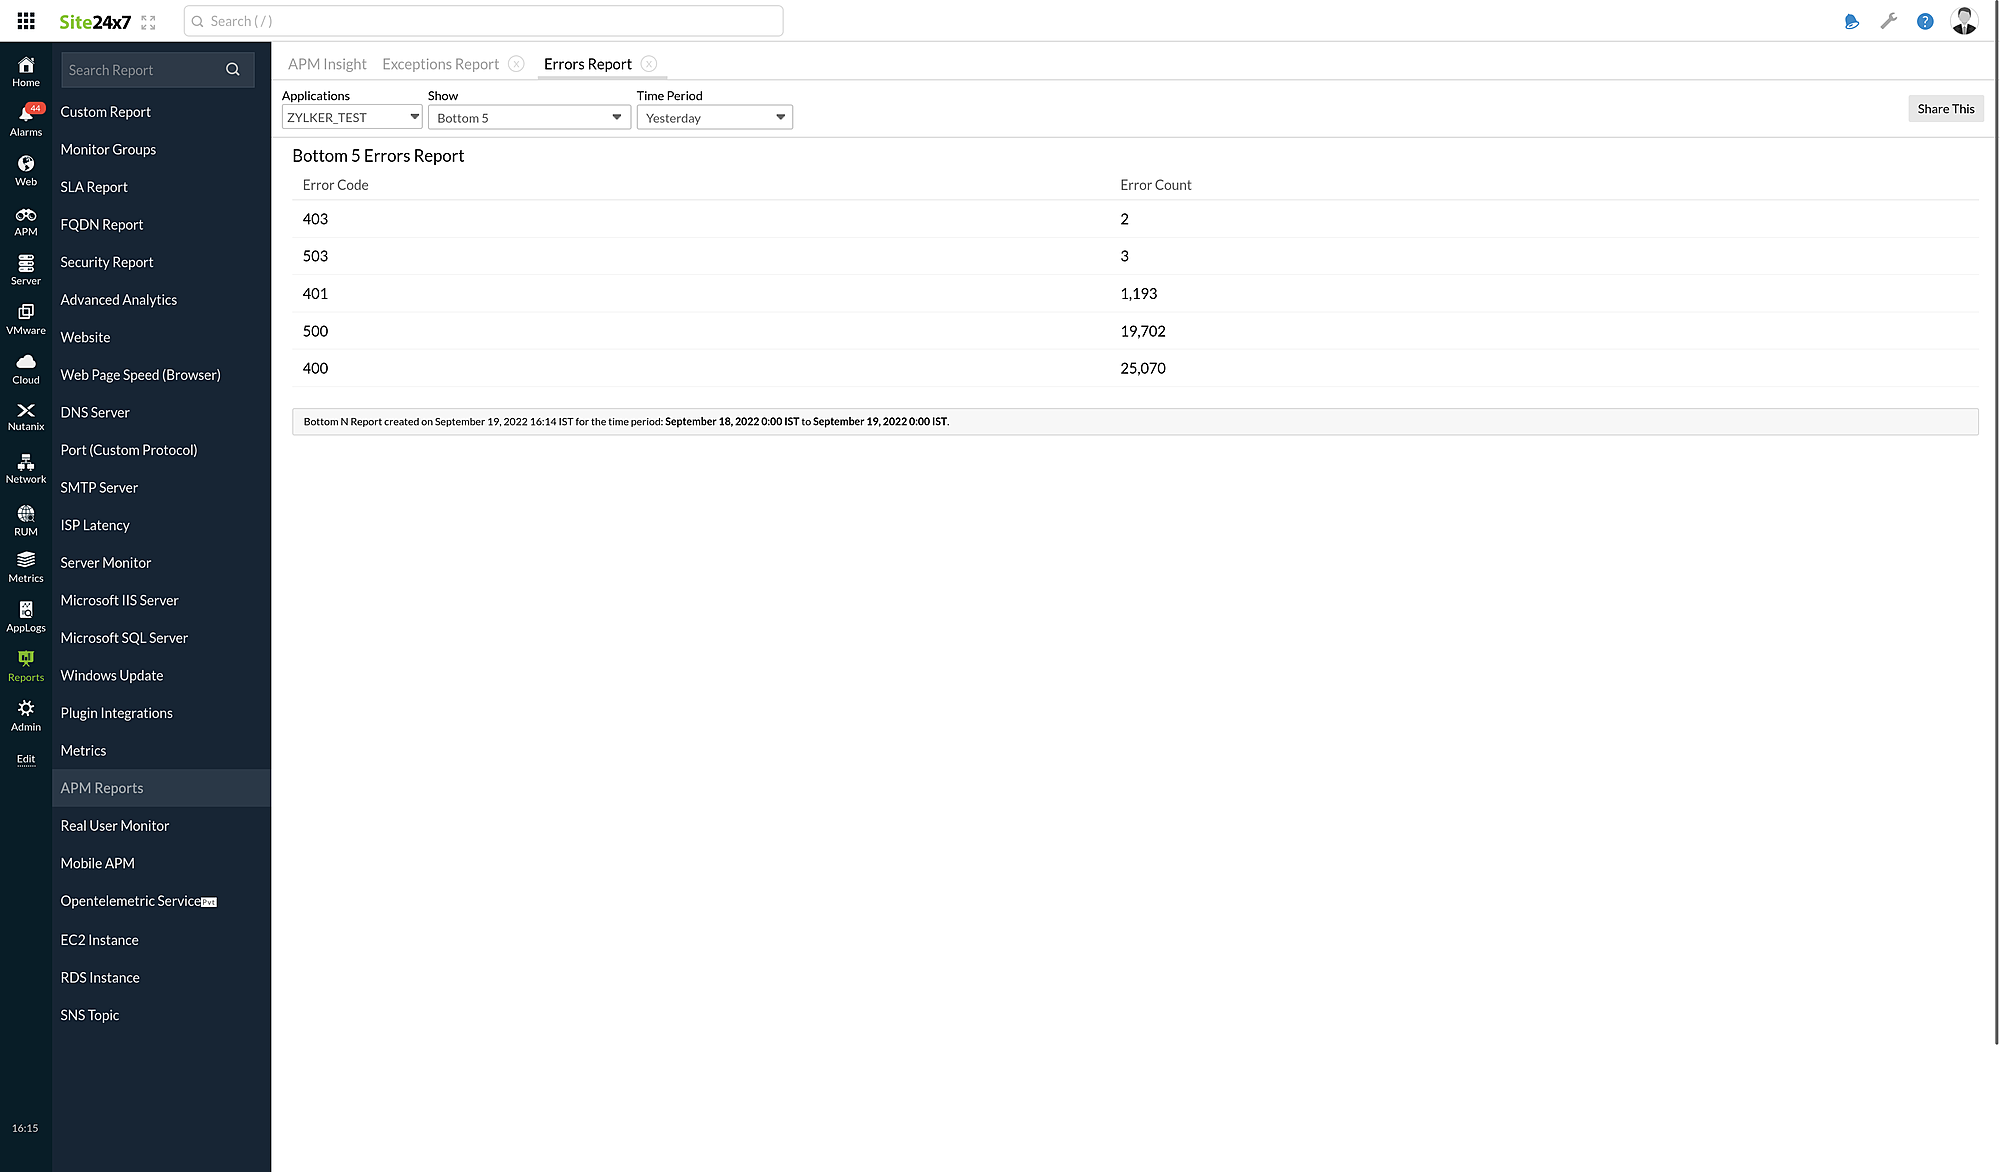
You can also access this page from the Exceptions tab.
Navigate to APM > APM Insight > your application > Exceptions and click View Errors Report.

