Scheduled Reports
Customize and schedule multiple reports for your User Alert Groups in the format and time they prefer. Emails will be scheduled to your customers with the requisite data as PDF or CSV attachments on a daily, weekly, monthly, quarterly frequency. You can schedule multiple reports viz., Summary Report, Step Summary Report, Availability Summary, Availability Trend, Performance, Top 'N', Busy Hours, Executive Summary SLA Report, Guidance Report, FQDN Report, and Advisor Report. When a user signs up for Site24x7, a default report with all monitors created during sign up, will be auto generated and scheduled every week during the same timestamp.
Schedule a Report
- Log in to Site24x7.
- Go to Admin > Report Settings > Scheduled Reports (+) or click on Schedule Report.
- Specify the following details to add the scheduled report:
- Display Name: Mention a name for the report for identification purposes.
- Report Type: Choose the type of report from the drop-down which needs to be generated. Click Preview button to view the report which is selected. The different type of monitoring reports available are:
- Summary Report: Shows a basic view of the overall availability summary, outage and downtime of your configured monitor configuration.
- Availability Summary Report: Shows a detailed view of the overall availability summary, outage and downtime of your configured monitors with in depth graphical representation.
- Attribute: When you select a Metrics monitor, you'll be provided with an option to choose the associated attributes from the drop-down menu.
- Template Name: Templates are where the attributes to be monitored are defined and every plugin will have a template associated with it. This option will be available only if you choose the monitor type as plugin monitors.
- Availability Trend Report: Capture the basic availability trend of a monitor, monitor group, or all monitors for a specific time period, viz., This Week (Sunday-Today), This Month, This Quarter, This Year, and more.
- Performance Report: Shows the availability and performance metrics like throughput and response time of your configured monitors from various monitoring locations. You can infer the average and 95th percentile value of the polled data.
- Top N & Bottom N Reports: Top N & Bottom N Reports section lists the top N and bottom N resources with the highest and lowest values in a defined set of data collections.
- Attribute: When you select any monitor with Attribute, upon choosing the monitor, you'll be provided with an option to choose the attributes from the drop-down menu.
- Template Name: Templates are where the attributes to be monitored are defined and every plugin will have a template associated with it. This option will be available only if you choose the monitor type as plugin monitors.
- Step Summary Report: It lets you drill down and identify the availability percentage and average response time metrics of the individual step transactions in your configured Web Application (Real Browser) Monitors for a selected Time Period. You can generate a location based step summary report, if you've chosen to generate it for an individual monitor. You can extract the report in PDF and CSV, or even send it via an email. Publishing or Scheduling the report is also made available.
- Busy Hours Report: Provides the average response time of the monitors during a chosen time period. This exactly illustrates at what time of the day the site response is the slowest.
- Executive Summary SLA Report: Executive Summary SLA report gives you a comprehensive outlook into your overall availability and response time service level agreements on a monitor group level.
- Guidance Report: Reduce costs and improve performance. Our Guidance Report for AWS analyses resource utilization stats and configurations for key AWS services using 29 best practice recommendation checks and identifies resources that don't comply.
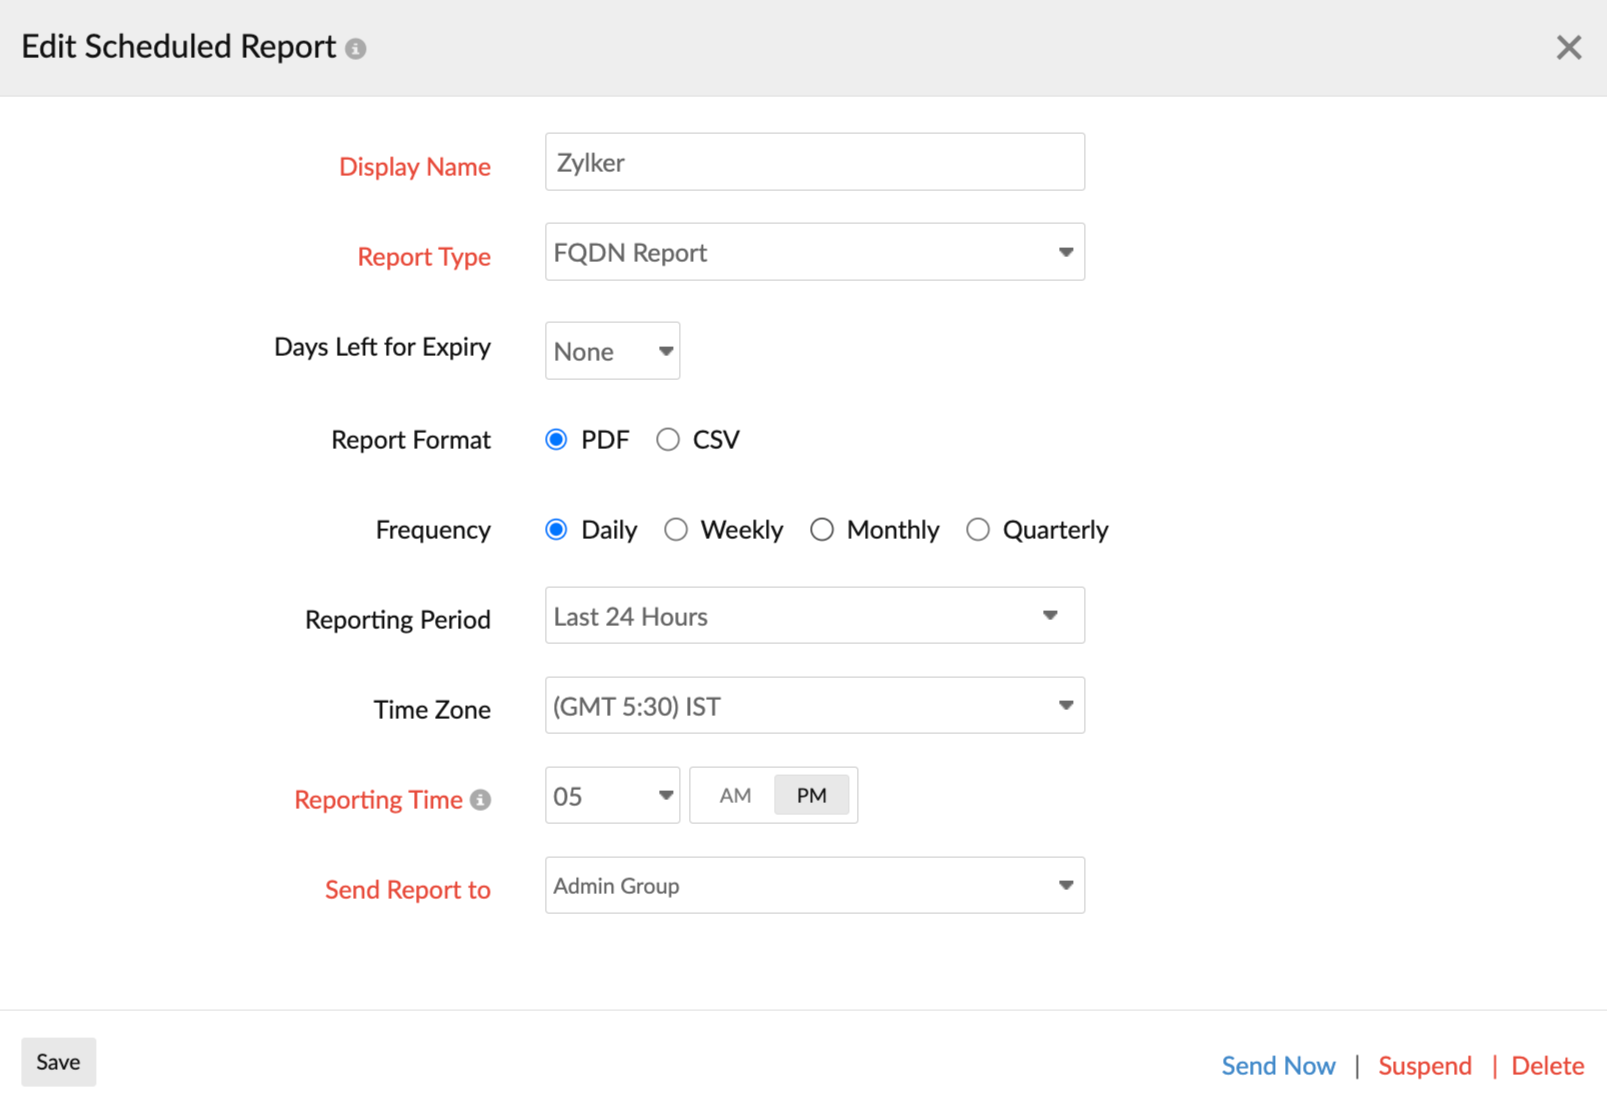
- FQDN Report: You can view the list of all Domain Expiry and SSL Certificate monitors along with their respective days to domain and SSL certificate expiry in a single report.
- Advisor Report: This is a personalized report that analyzes your existing account configuration and usage stats; then suggests unused features and configurations that can help you perform comprehensive monitoring to improve the overall resource availability and performance of your IT resources.
- Security Report: You can view and share the the reports related to SSL/TLS, Real-time Blocklist, and Brand Reputation monitors.
- AWS Inventory Report: You can share the status of all your monitored AWS services and other related meta data across your configured AWS regions as a PDF attachment.
- AppLogs Report: This report gives you detailed insights with all your default log type widgets and saved searches for the log types you choose. You can also choose to view the same for all your log types.
- Azure Inventory Report: Get a count of all the resources in each resource type.
- Inventory Details of Azure Resources: Shows the configuration details of resources under a particular resource type.
- Azure Guidance Report: Lists the recommendations to optimize the performance of Azure resources.
- Server - Resources Report: Get the disk partition, network adapter, services, and processes reports for your servers.
- Server Inventory Report: Get the complete list of servers in your account with their respective display name, hostname, agent version, OS type, uptime, poll interval, and more.
- Server Restart Report: Provides the time of reboot of the monitored servers within the report collection timeframe.
- Microsoft IIS Server Report: Provides the IIS Sites, Applications, and Application Pools along with their details like connection status.
- Windows Update Report: Provides the list of all the updates pending to be installed on your Windows servers and also those that are already updated. This report also gives the breakdown of the update stating if they are critical updates, security updates, driver updates, or service pack updates.
- Hyper-V - VM Resources Report: Provides all the critical reports related to your Hyper-V setup like the VM Details Report, VM Replica Report, VM Storage Device Report, and the VM Network Adapter Report.
- Microsoft Failover Cluster Report: Provides the Failover clusters' Storage Report and the Cluster Node Status Report that give essential details of your clusters like the available storage space and used storage space.
- Hadoop Inventory Report: Provides a list of all the NameNodes and DataNodes present in the Hadoop cluster.
- Monitor Status Report: View servers based on their monitor status, hostname, outage duration, agent version and more.
- Microsoft Graph API Reports: Provides the email user and app activity, SharePoint user and site activity, OneDrive user and account usage, Teams user activity, and Skype for Business user activity and call duration for your Office 365 servers.
- Server Integration Report: Obtain the server integration status of your EC2 instances, GCP Compute Engines, and Azure Virtual Machines (VMs) from the Server Integration Report. You can view whether the EC2 instances have a server monitor integrated or not.
- GCP All Projects Report: Provides the total number of active and suspended monitors in the GCP project being monitored.
- Azure All Accounts Report: Lists all the Azure accounts added in Site24x7.
- Azure Subscriptions Report: Lists all the subscriptions that come under the monitored Azure accounts.
- All AWS Accounts Report: View all your configured AWS accounts and resource count summary pertaining to individual AWS accounts in CSV format with the All AWS Accounts Report.
- Control Tower Accounts Report: This report provides all the Control Tower account details in CSV format.
- Control Tower Linked Accounts Report: Obtain all the Control Tower linked account details in CSV format using the Control Tower Linked Accounts Report.
- MG Executive Report: Provides an individual report for each monitor group containing the selected monitor type metrics and configuration data. The MG Executive Report is available for all monitors except monitor types that support multiple location profiles.
- MG Resources Report: Provides a consolidated view of all monitors associated with a chosen monitor group, including those within its subgroups. With this unified report, you can easily review all related monitors in one place.
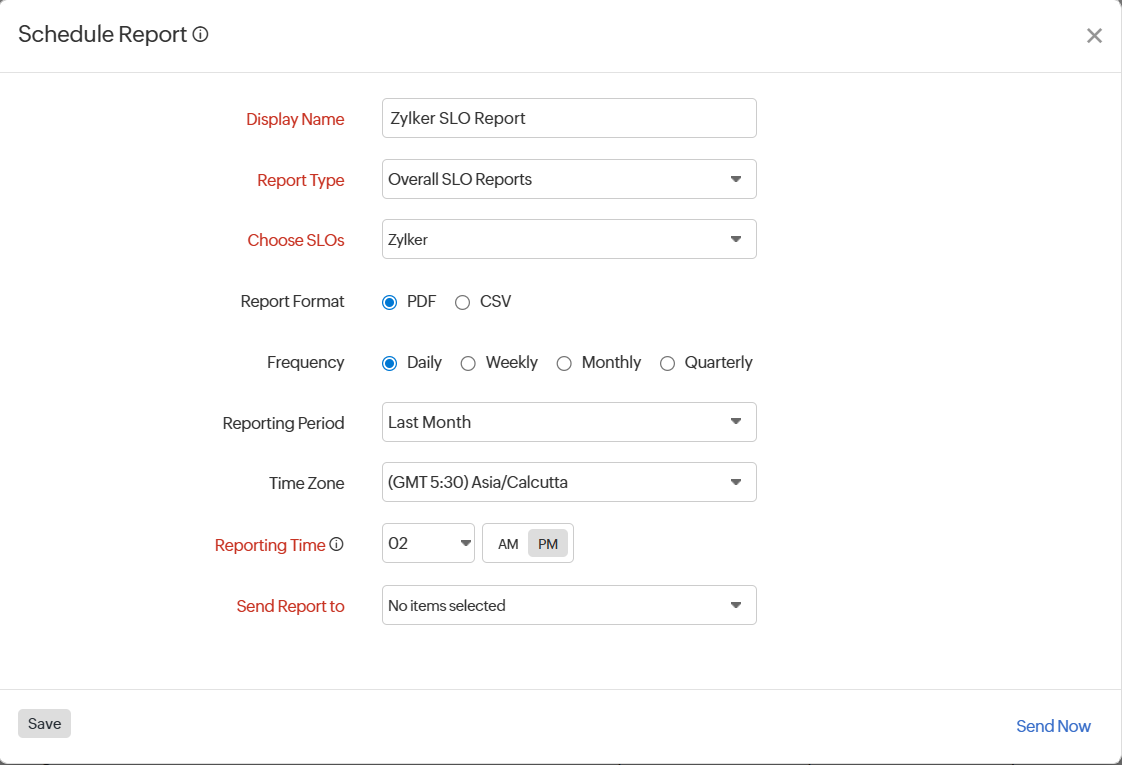
- Overall SLO Report: Provides a consolidated view of all your SLOs across your account, giving you visibility into each service’s reliability. This helps you understand how each service is performing against its defined targets, monitor compliance, identify deviations, error budget, and track reliability trends over time to ensure consistent service quality.
- Select Resource Type: Choose the appropriate resource type, for which you want to generate reports.
- Monitors: You can choose multiple monitors from the drop-down for which you wish to schedule the report.
- Monitor Groups: You can select multiple monitor groups from the drop-down for which you wish to schedule the report.
- All Monitors: You can select all the monitors and schedule the report for all of them.
- Monitor Type: You can choose multiple monitor types from the drop-down menu for which you wish to schedule the report.
- Tags: You can specify multiple tag(s) to schedule the report for all the relevant tagged monitors.
Note- For Summary Report, Step Summary Report, Availability Summary Report, Availability Trend Report, and Performance Report–you'll need to choose the relevant resource type. However, this option is disabled for Busy Hours Report and Top N Report.
- Tags can be associated with the following reports: Summary Report, Availability Summary Report, Availability Trend Report, and Performance Report, alone.
- Include Subgroups: Enable this option to include subgroups of the selected Monitor Groups. Otherwise, only the selected Group will be considered.
- Business Hours: Select the time period that is most critical to your business.
- Criteria: Criteria helps you to set the threshold limits for metrics for which you have opted to receive scheduled reports. For instance, you can set a limit for the outage count exceeding which you would like to schedule a report. This option is available only for Summary Report and Availability Summary Report. There are three categories under Criteria:
- Availability: You have to provide the threshold percentage for the availability of your website. For instance,if you set the availability as '< 60%', then when the availability goes below 60% a report will be sent to the customer.
- Outage Count: You have to mention the threshold for the outage count or the number of outages. For instance,you have given '>= 12' as the criteria for outage count; then a report will be sent when the number of outages or outage count falls on 12.
- Outage Duration: You can provide a threshold for the outage duration. Take for instance that you have added 10 minutes as the outage duration and when the duration exceeds that value, a report will be sent to the customer.
- Metric Aggregation: If you've chosen the Performance Report, you'll additionally have an option to specify the Average or 95th percentile value in the report. This option will only be shown when the resource type selected is Monitor Groups, Tags, All Monitors or Monitors (with multiple monitor selection).
- Report Format: The reports can be exported in CSV or PDF format.
- Reporting Period: You can select the specific timeframe of data that you would like to be included in the generated report. For example, if you choose the Reporting Period as Last 30 days and set the Frequency as Weekly, a report will be generated every week with the data of the Last 30 days.
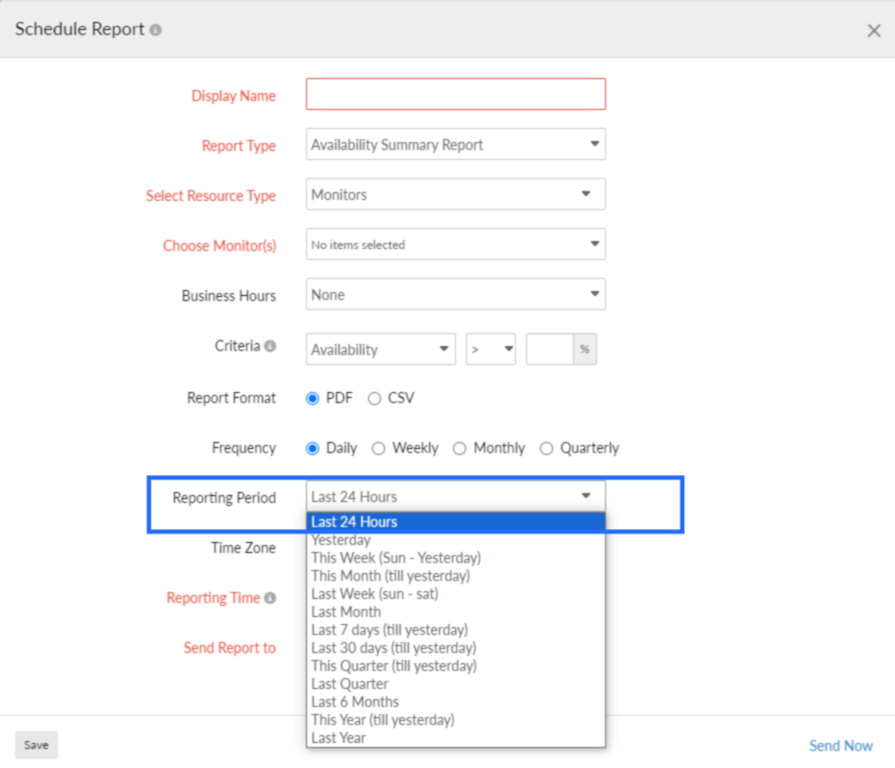
- Frequency: The frequency of the report can be set on a daily, weekly, monthly, or quarterly basis. Learn more.
Note
If you choose to schedule your report quarterly, specify the Business Quarter Months as per your need so as to schedule a quarterly report during the first month of every quarter. For example, upon selecting "Feb - May - Aug - Nov" as your default business quarter, the report will be scheduled at the specified date and hour of February, May, August, and November months.
- Time Zone: You can use the time zone option to generate scheduled reports. To change the time zone in scheduled reports:
- Go to Admin > Report Settings > Scheduled Reports.
- Click the Schedule Report option in the top-right corner.
- Choose the Time Zone in which you wish the reports to be generated.
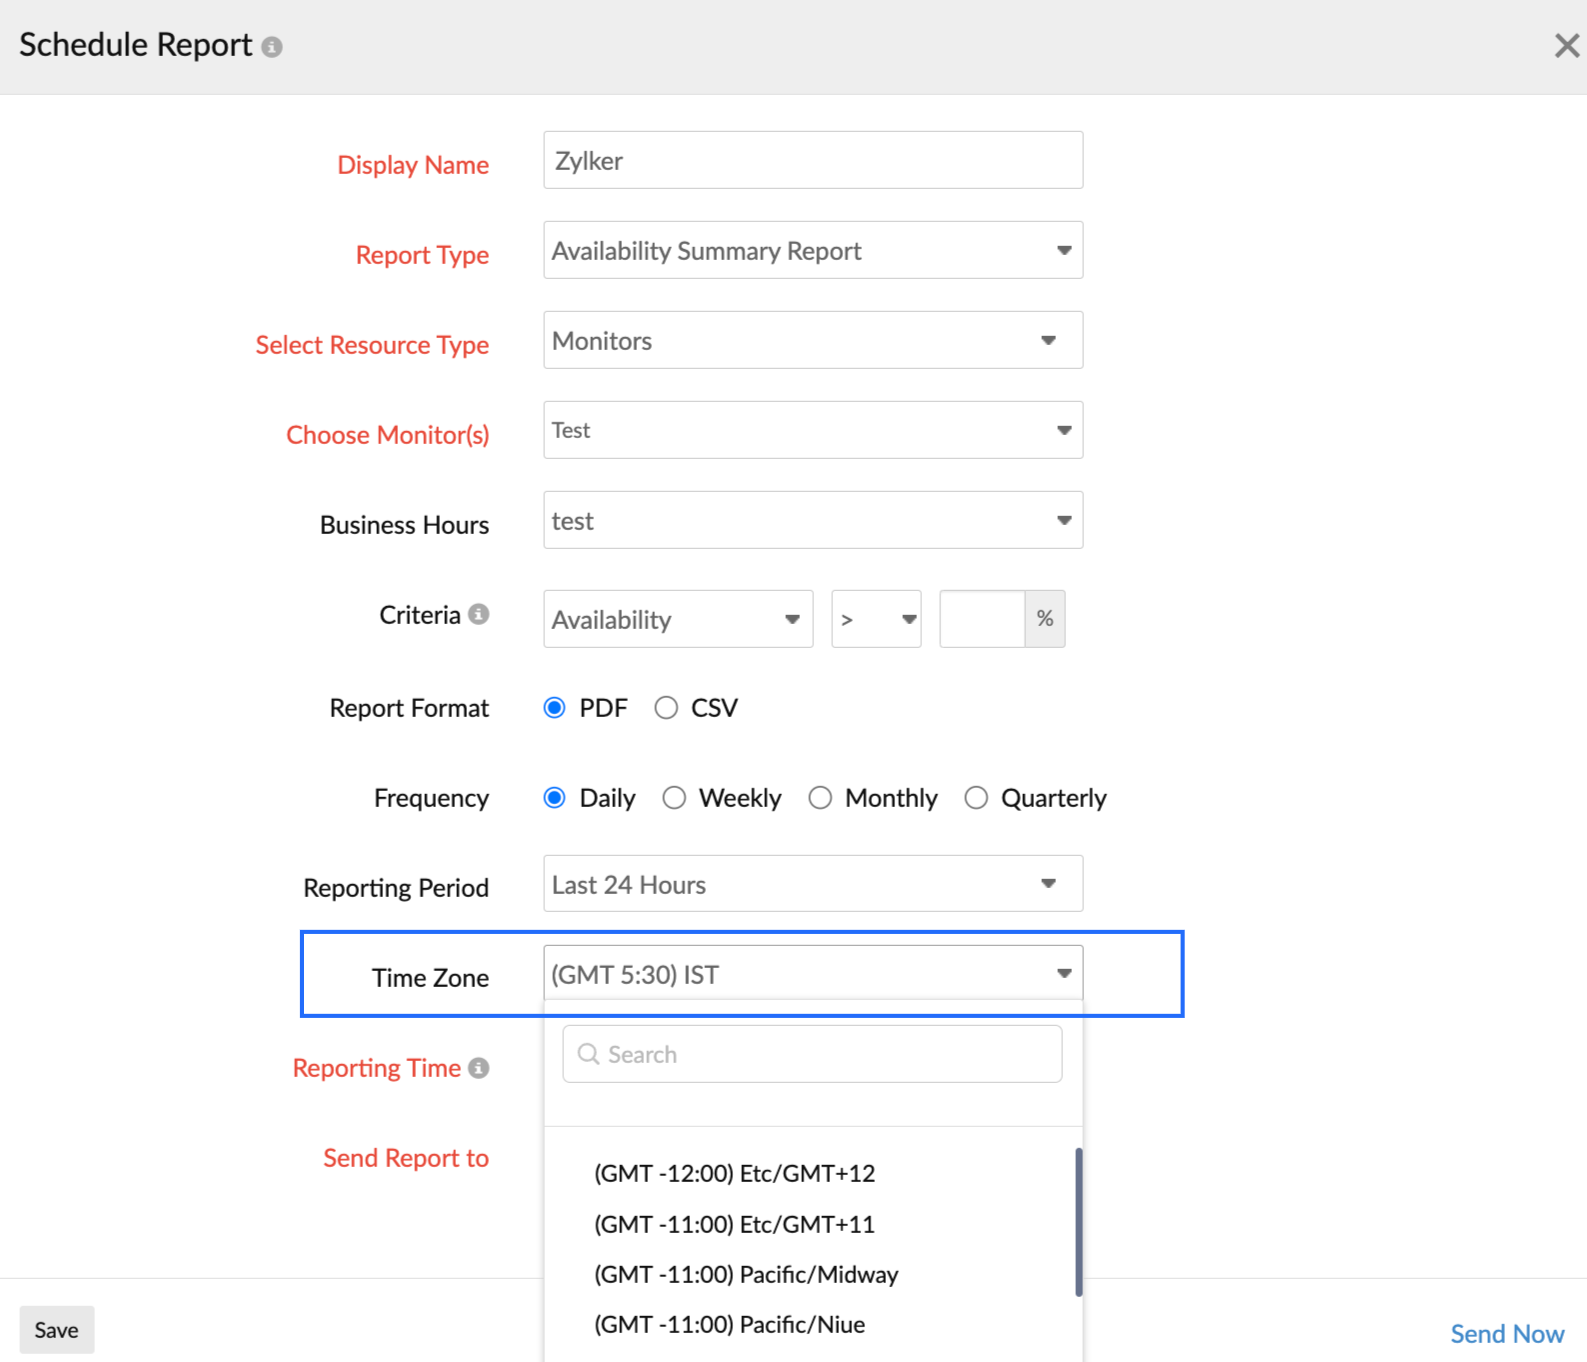
NoteWithout manual configuration, the time zone will automatically be set at the account level.
- Reporting Time: The exact date and time when you want the report to be generated can be set by choosing your preferences from the drop-down menu. You can choose 12 hour or 24 hour formats while setting the time preferences in My Account.
- Send Report to: Choose the necessary contact to whom the report should be sent. Click Send Now button to send the report to the designated user alert group.
- Click Save. Click Send Now to trigger the report instantly.
- The report created will be automatically listed in the Scheduled Reports screen along with the other reports that were created previously.
Performance Report
If you wish to send a Performance Report, you need to provide these additional parameters:
- Attribute: When you select any monitor with Attribute for which report generation is supported, you'll be provided with an option to choose the attributes from the drop-down menu.
- Template Name: Templates are where the attributes to be monitored are defined and every plugin will have a template associated with it. This option will be available only if you choose the monitor type as plugin monitors.
Availability Trend Report:
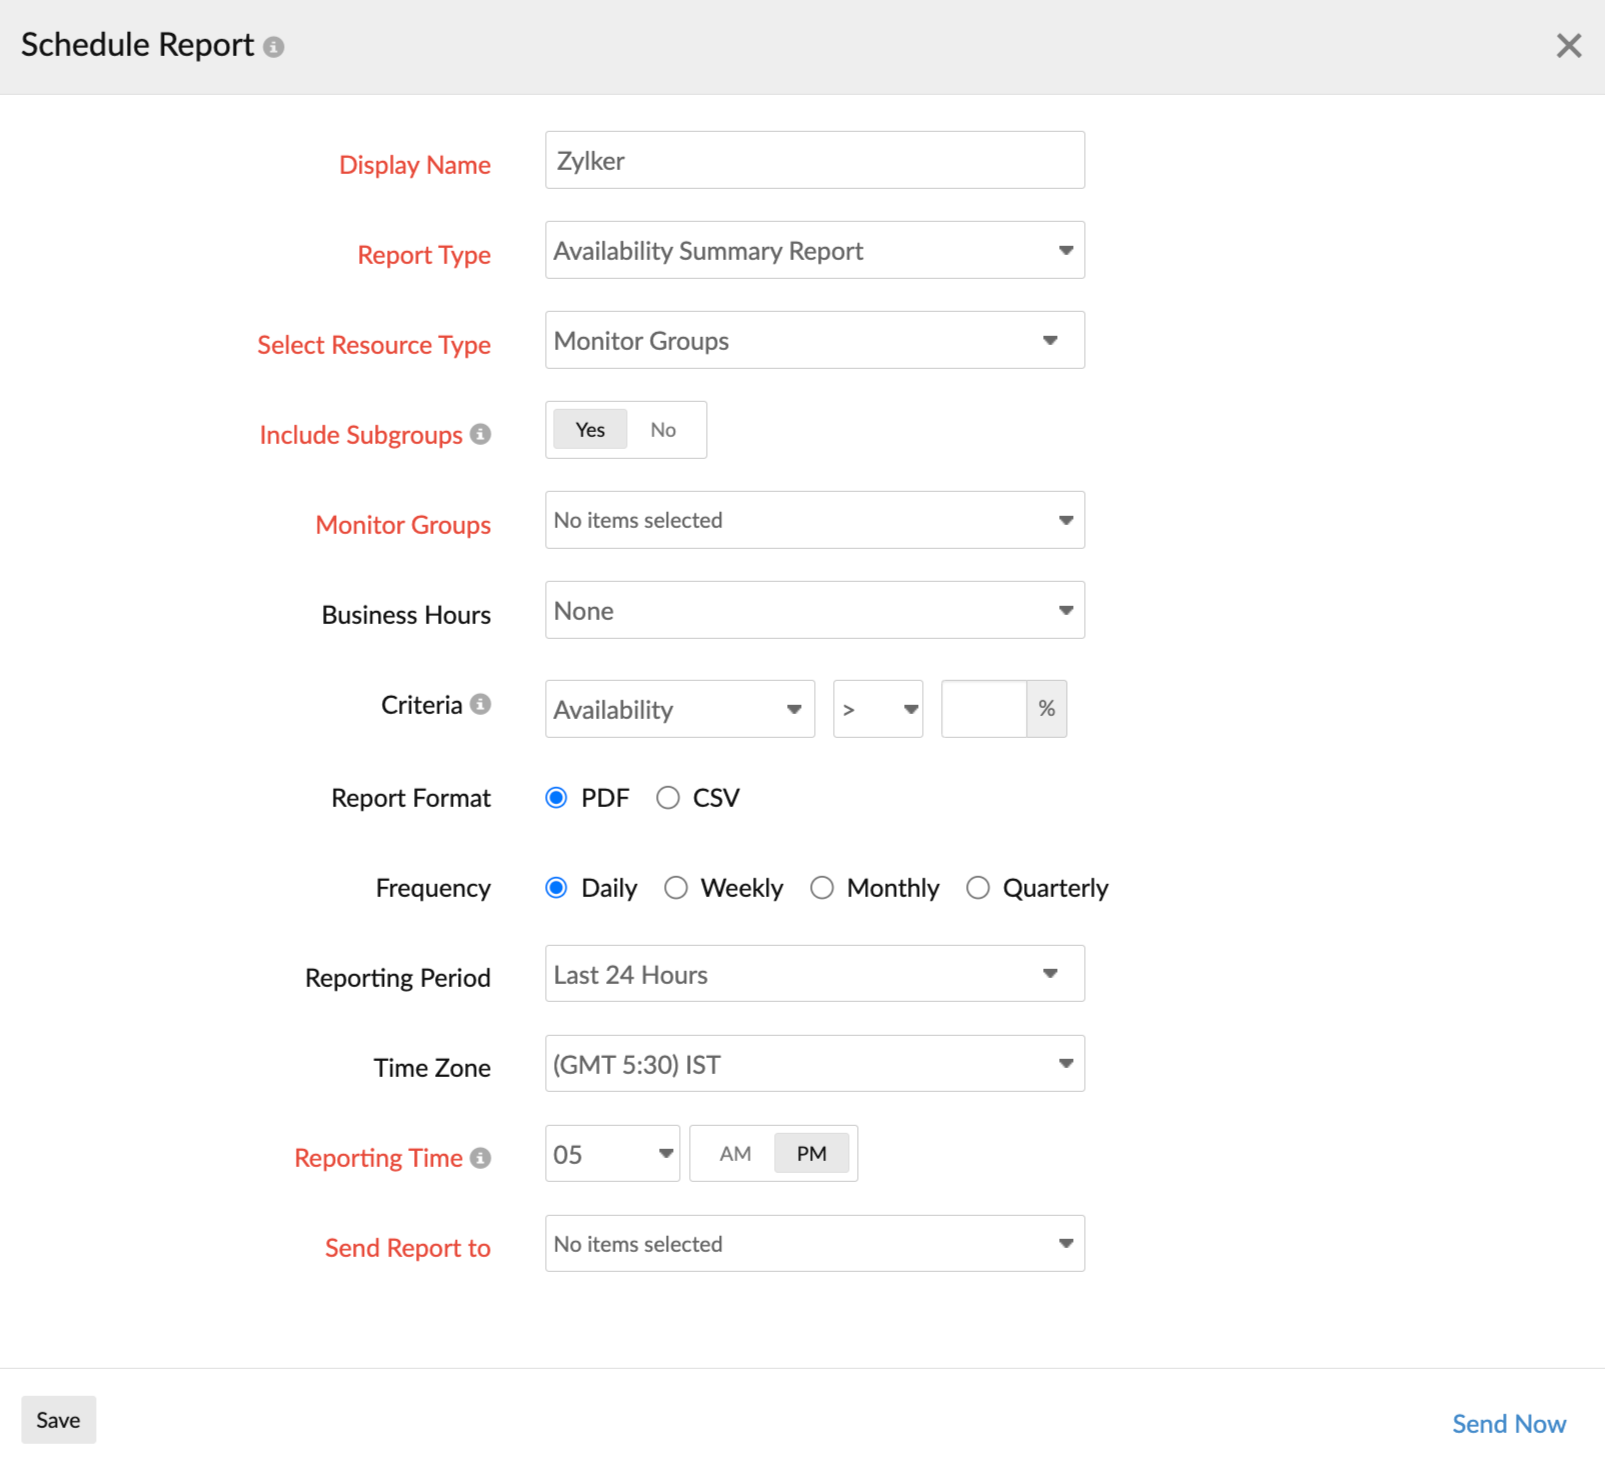
If you wish to send Availability Trend Report to your user alert groups, you must specify these additional parameters listed below in the Schedule Report form:
- Availability Trend Periods: You can pick upto five time periods from the Availability Trend Periods Selector. The email report attachment will have the availability trend mapped for these time periods.
- Include meta information: On selecting this checkbox, any monitor group or subgroups information, which the monitor is associated to will also be shared via CSV or PDF file attachment.
- Include SLA data: On selecting this checkbox, any availability SLA data, which is configured for the specified resource will also be shared in the CSV or PDF attachment. However, if you've multiple SLA reports for the selected resource, then only the first SLA report will be considered. Also, no SLA data will be shared if you do not have sufficient SLA data for the entire Trend Period.
- Report Format: You can share data via PDF or CSV format.
Executive Summary SLA Report:
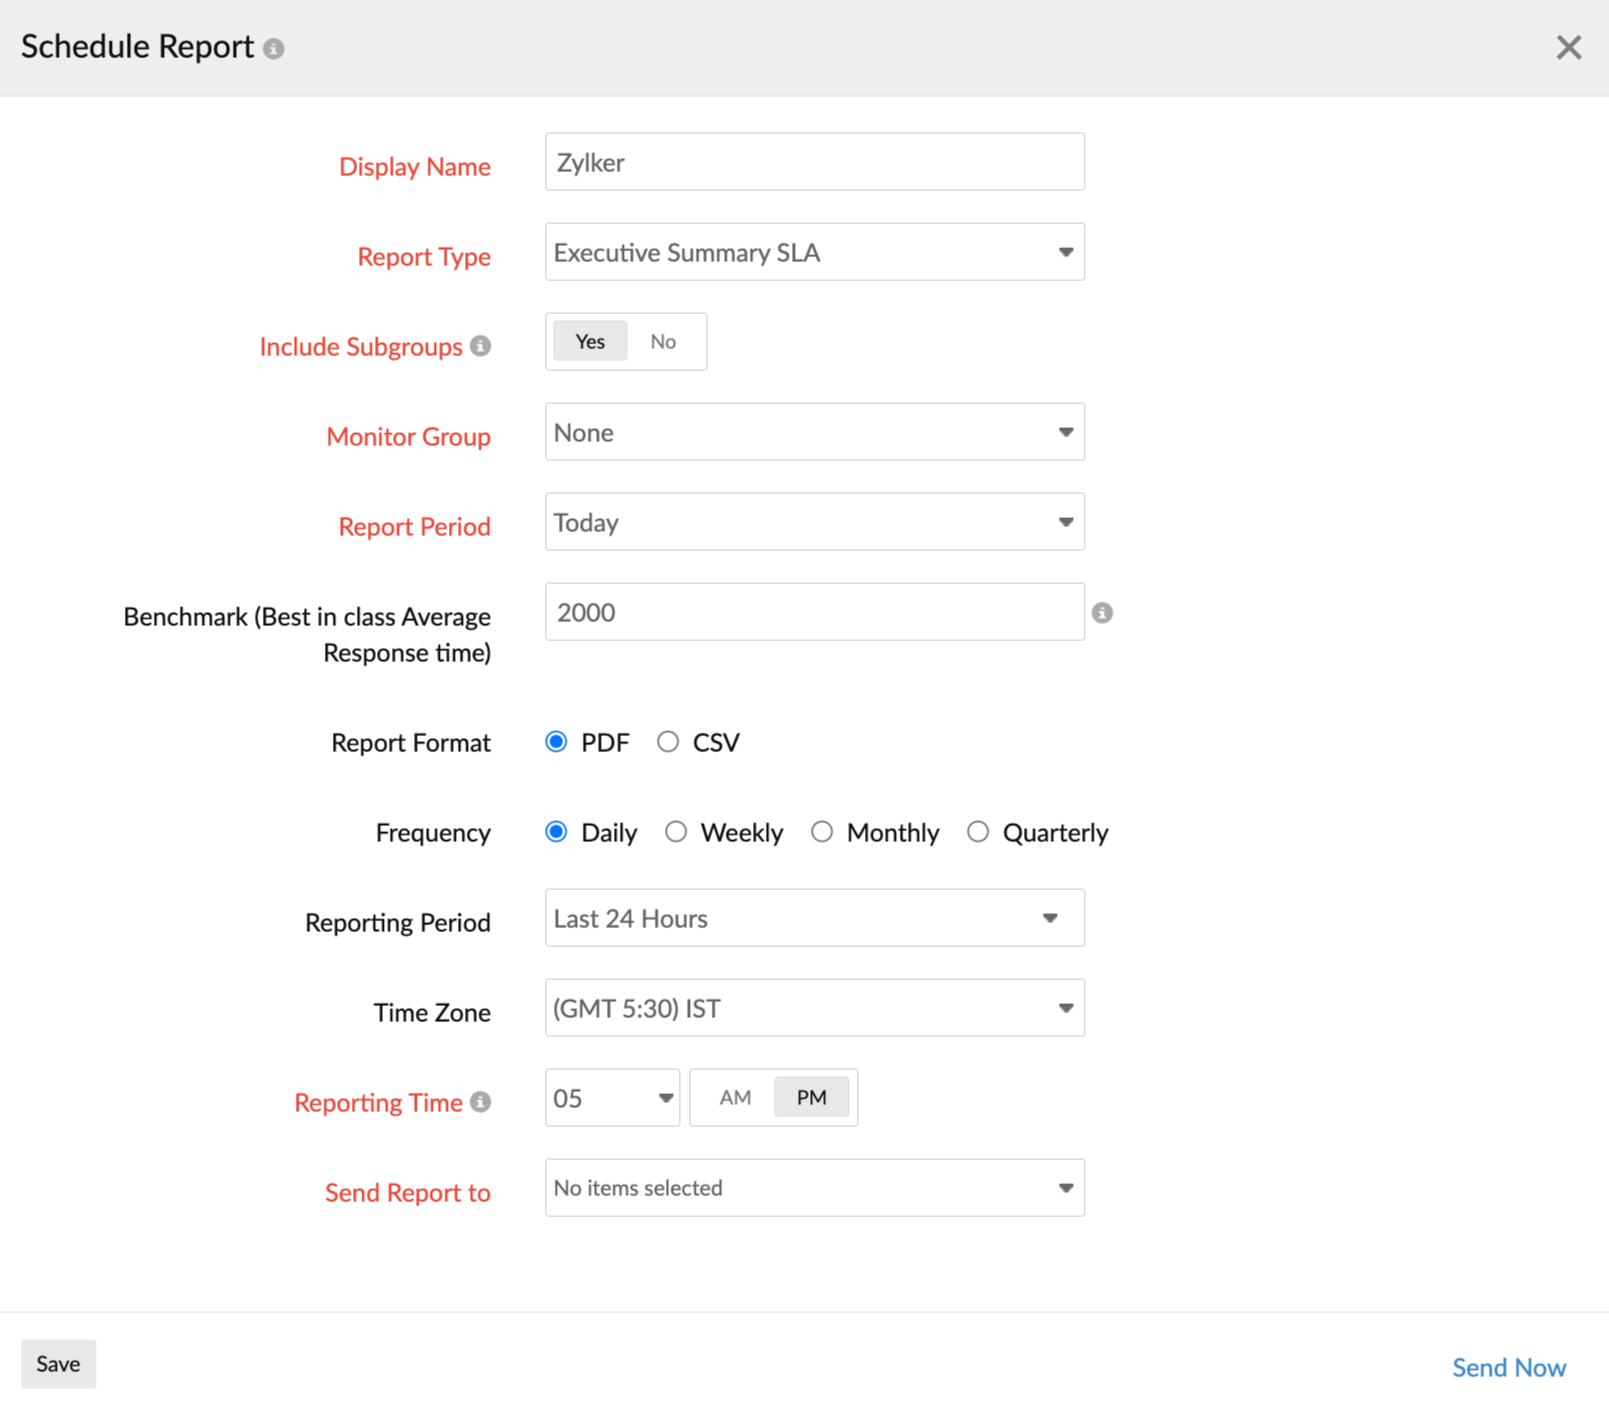
If you wish to send Executive Summary SLA Report to your User Alerts Groups, you must specify these additional parameters listed below in the Schedule Report form:
- Monitor Group: Specify the monitor group for which you wish to schedule the report. You can only select a single monitor group at a time. Report will be scheduled for all the monitors in this selected group.
- Include Subgroups: Enable this option to include subgroups of the selected Monitor Groups. Otherwise, only the selected Group will be considered.
- Report Period: Pick a preset time period, from among Today, Yesterday, This Week (sunday-today), Last Week (sunday-saturday), Last 7 days, This Month, Last Month, Last 30 days for which the report has to be generated.
- Benchmark (Best in class Average Response time): Response Time (in milliseconds) is a critical parameter that must be benchmarked for comparison. You can provide a value in this field. Site24x7 will compare the average response time values of all your monitors against your benchmarked value. By default, the value will be entered as 2000ms.
- Report Format: You can share data as CSV or PDF document.
SSL and Domain Expiry Report
If you wish to send SSL and Domain Expiry Report to your User Alerts Groups, you can specify these additional parameters listed below in the Schedule Report form:
- Days to Expire: Choose the number of days remaining for expiry, from the range provided to filter the monitors .
- Report Format: You can share data as a PDF document or as CSV.
Overall SLO Report
If you wish to send an Overall SLO Report, you must specify the additional parameter listed below in the Schedule Report form:
-
- Choose SLOs: This option lists all the SLOs that are available in your account. You can select either one or all the SLOs.
- Report Format: You can share the data in either CSV or PDF format.
Suspend/Activate the Report
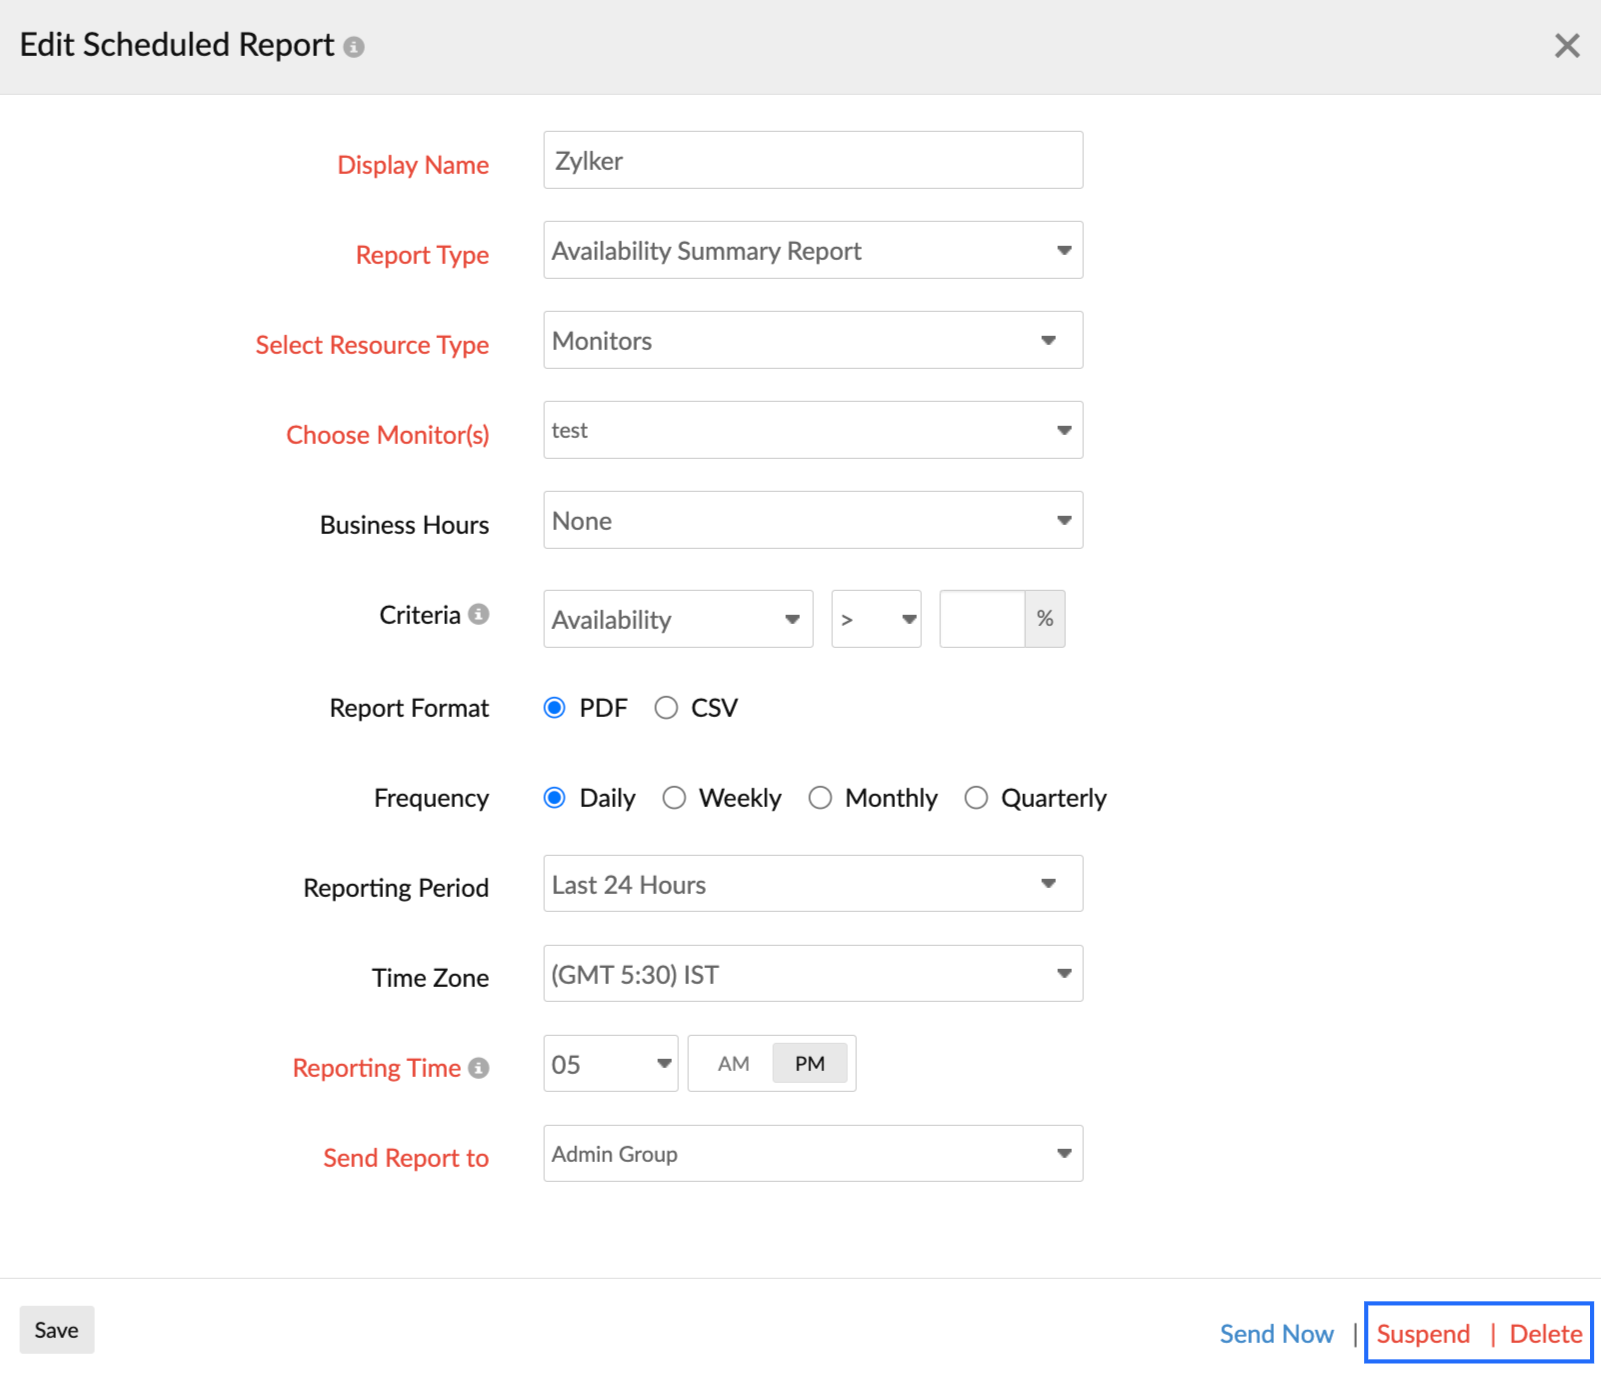
- Click on the report which you want to suspend or activate in the Schedule Reports screen.
- Click Suspend/Activate according to your preference.
NoteThe Suspended and Active status of the report can be found under Status in the Scheduled Reports screen.
Delete the Report
- Click the report which you want to delete.
- Click Delete in the Schedule Report window.
