Smart Groups in Site24x7
Automatically organize monitors that share dependencies or belong to the same infrastructure using Smart Groups in Site24x7. By leveraging topology, Application Discovery and Dependency Mapping (ADDM) that spans network topology, application calls, server and network communication, FQDN/IP-based relationships, and dynamic setups like Kubernetes, Smart Groups give you a contextual, unified view of your resources.
Smart Groups are available only for customers using the Enterprise plan.
Use cases
- Event correlation: When a database crash triggers multiple alerts (e.g., web server down, API failures, application errors), the event correlation tool groups them and highlights the database crash as the root cause, cutting noise and speeding up resolution.
- Accelerated root cause analysis: When a web server outage triggers multiple alerts across applications, databases, and APIs, Smart Groups correlate these events and trace them back to the failing server.
- Kubernetes setup: Pods, services, and nodes are automatically grouped so teams can view health, dependencies, and issues within a Kubernetes cluster in one place.
- Simplified maintenance: Group-level insights like outages, logs, and problems reduce the effort of navigating across multiple monitors.
Modules supported by Smart Groups
Accessing Smart Groups
Prerequisite: To enable Smart Groups, you should have APM, Kubernetes, internet service monitors, ADDM, or Layer 2 maps configured in your accounts.
- Log in to Site24x7.
- Navigate to Admin > Inventory > Smart Groups.
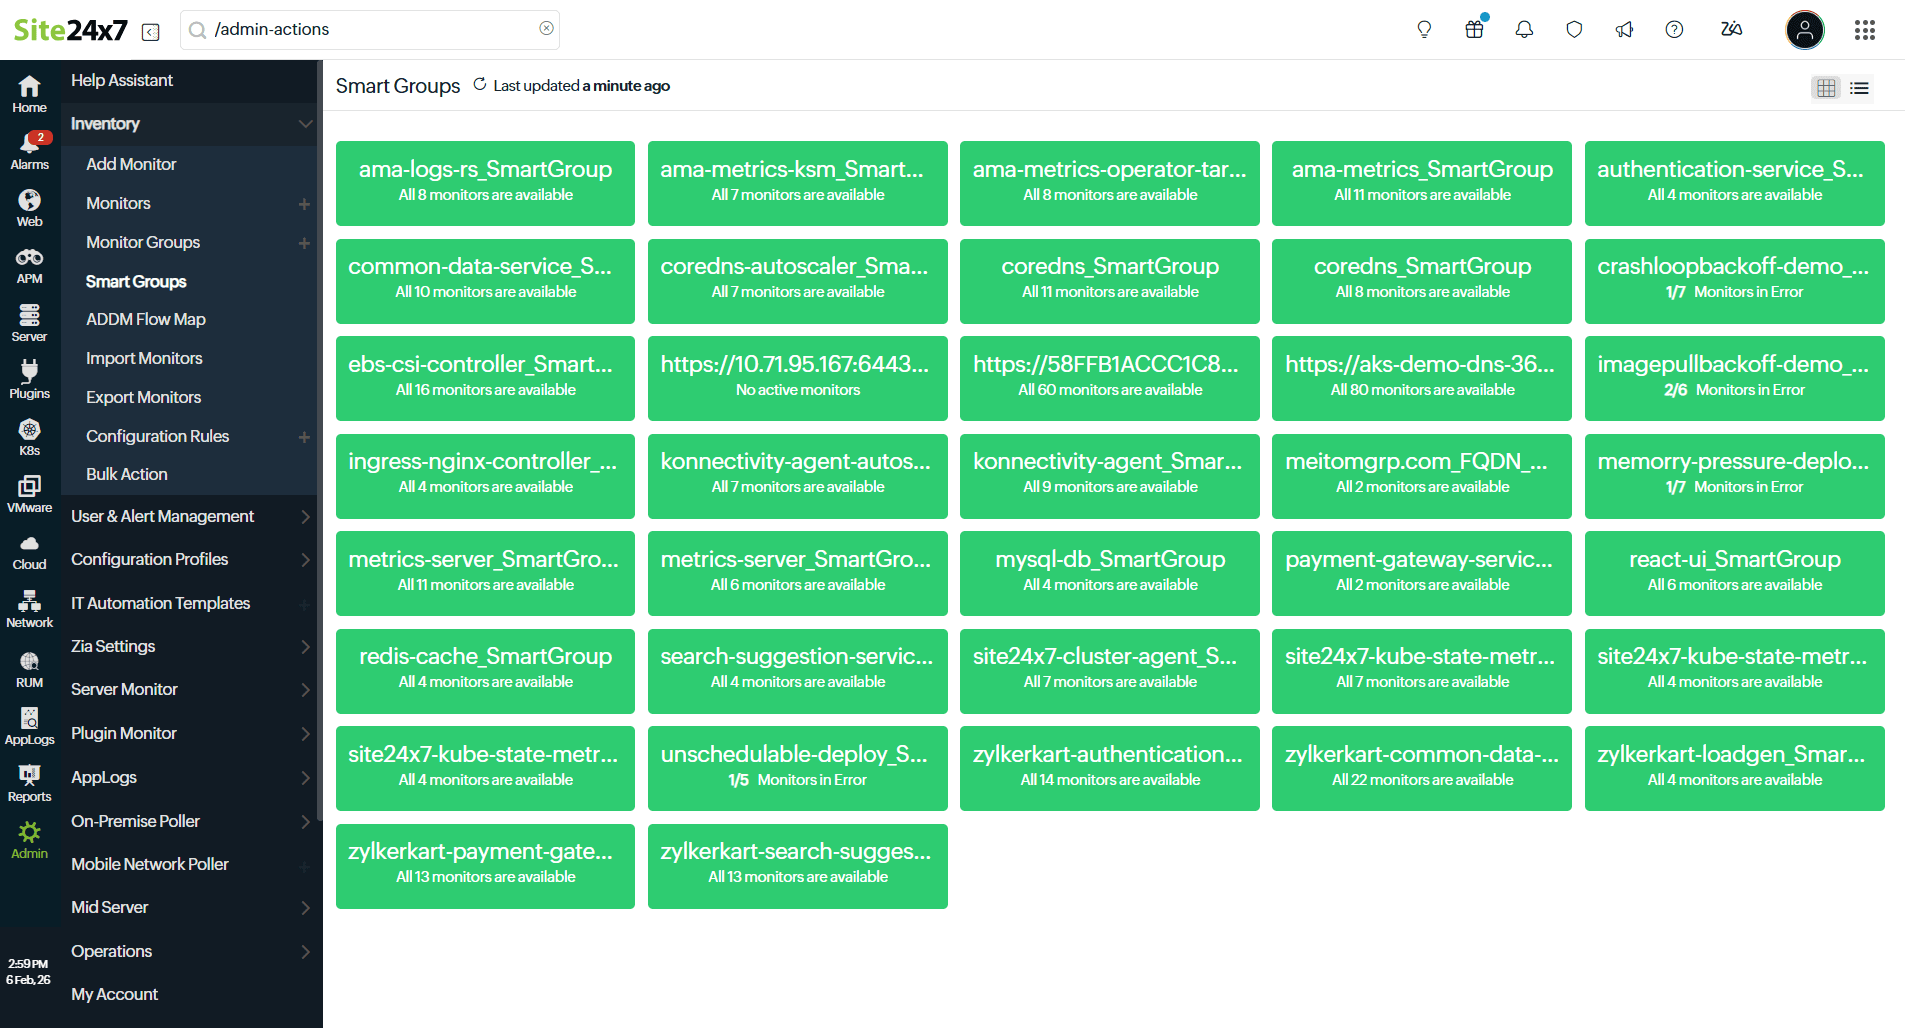
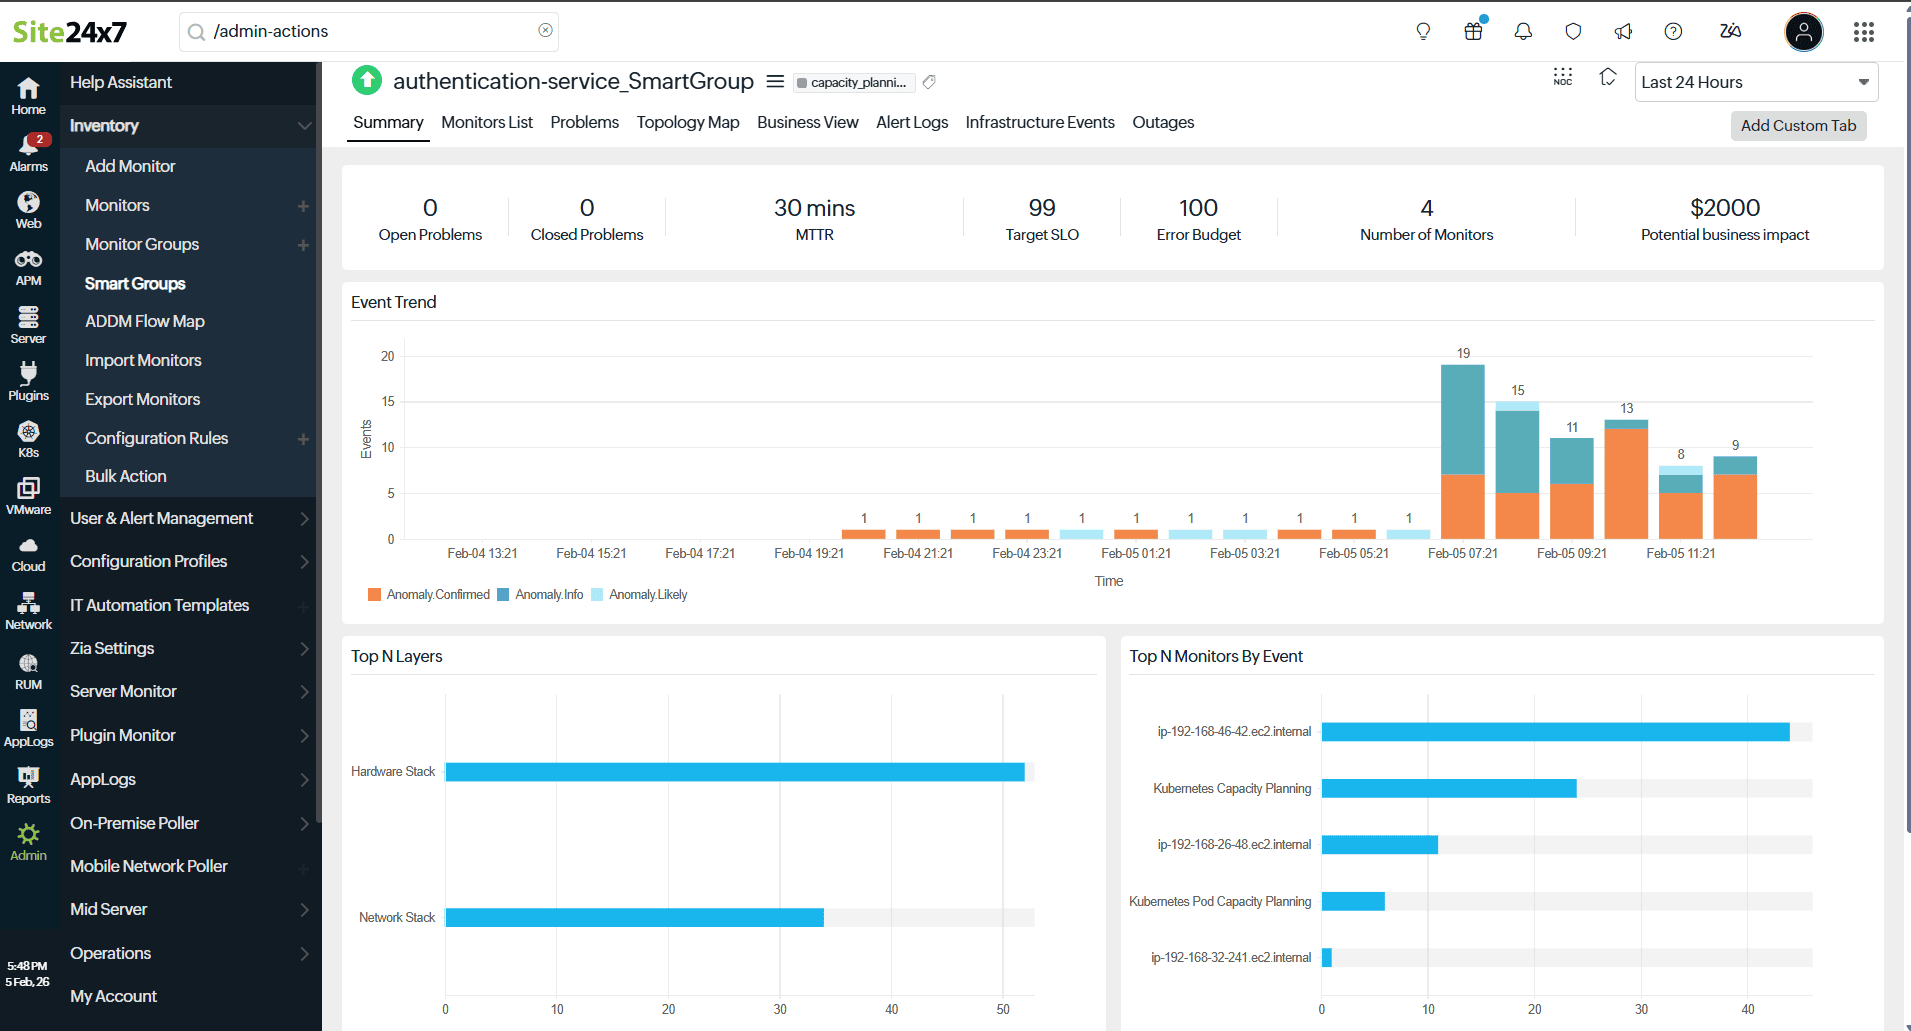
- On the Smart Groups list page, click the desired Smart Group to view the following details:
- Summary: A quick view of the topology map and associated problems.
- Monitors List: The list of monitors in the Smart Group, including type and last polled data.
- Problems: The correlated problems associated with the Smart Group.
- Topology Map: A map of monitor dependencies identified using ADDM.
- Business View: A high-level view of your critical services and applications.
- Alert Logs: The associated alert logs.
- Infrastructure Events: The associated events.
- Outages: The associated outages.
More actions to Smart Groups
In each Smart Group, you can:
How to edit Smart Groups
Follow the steps below to edit the smart groups:
- Select the desired Smart Group.
- Click the hamburger icon
 beside the group's name and select Edit.
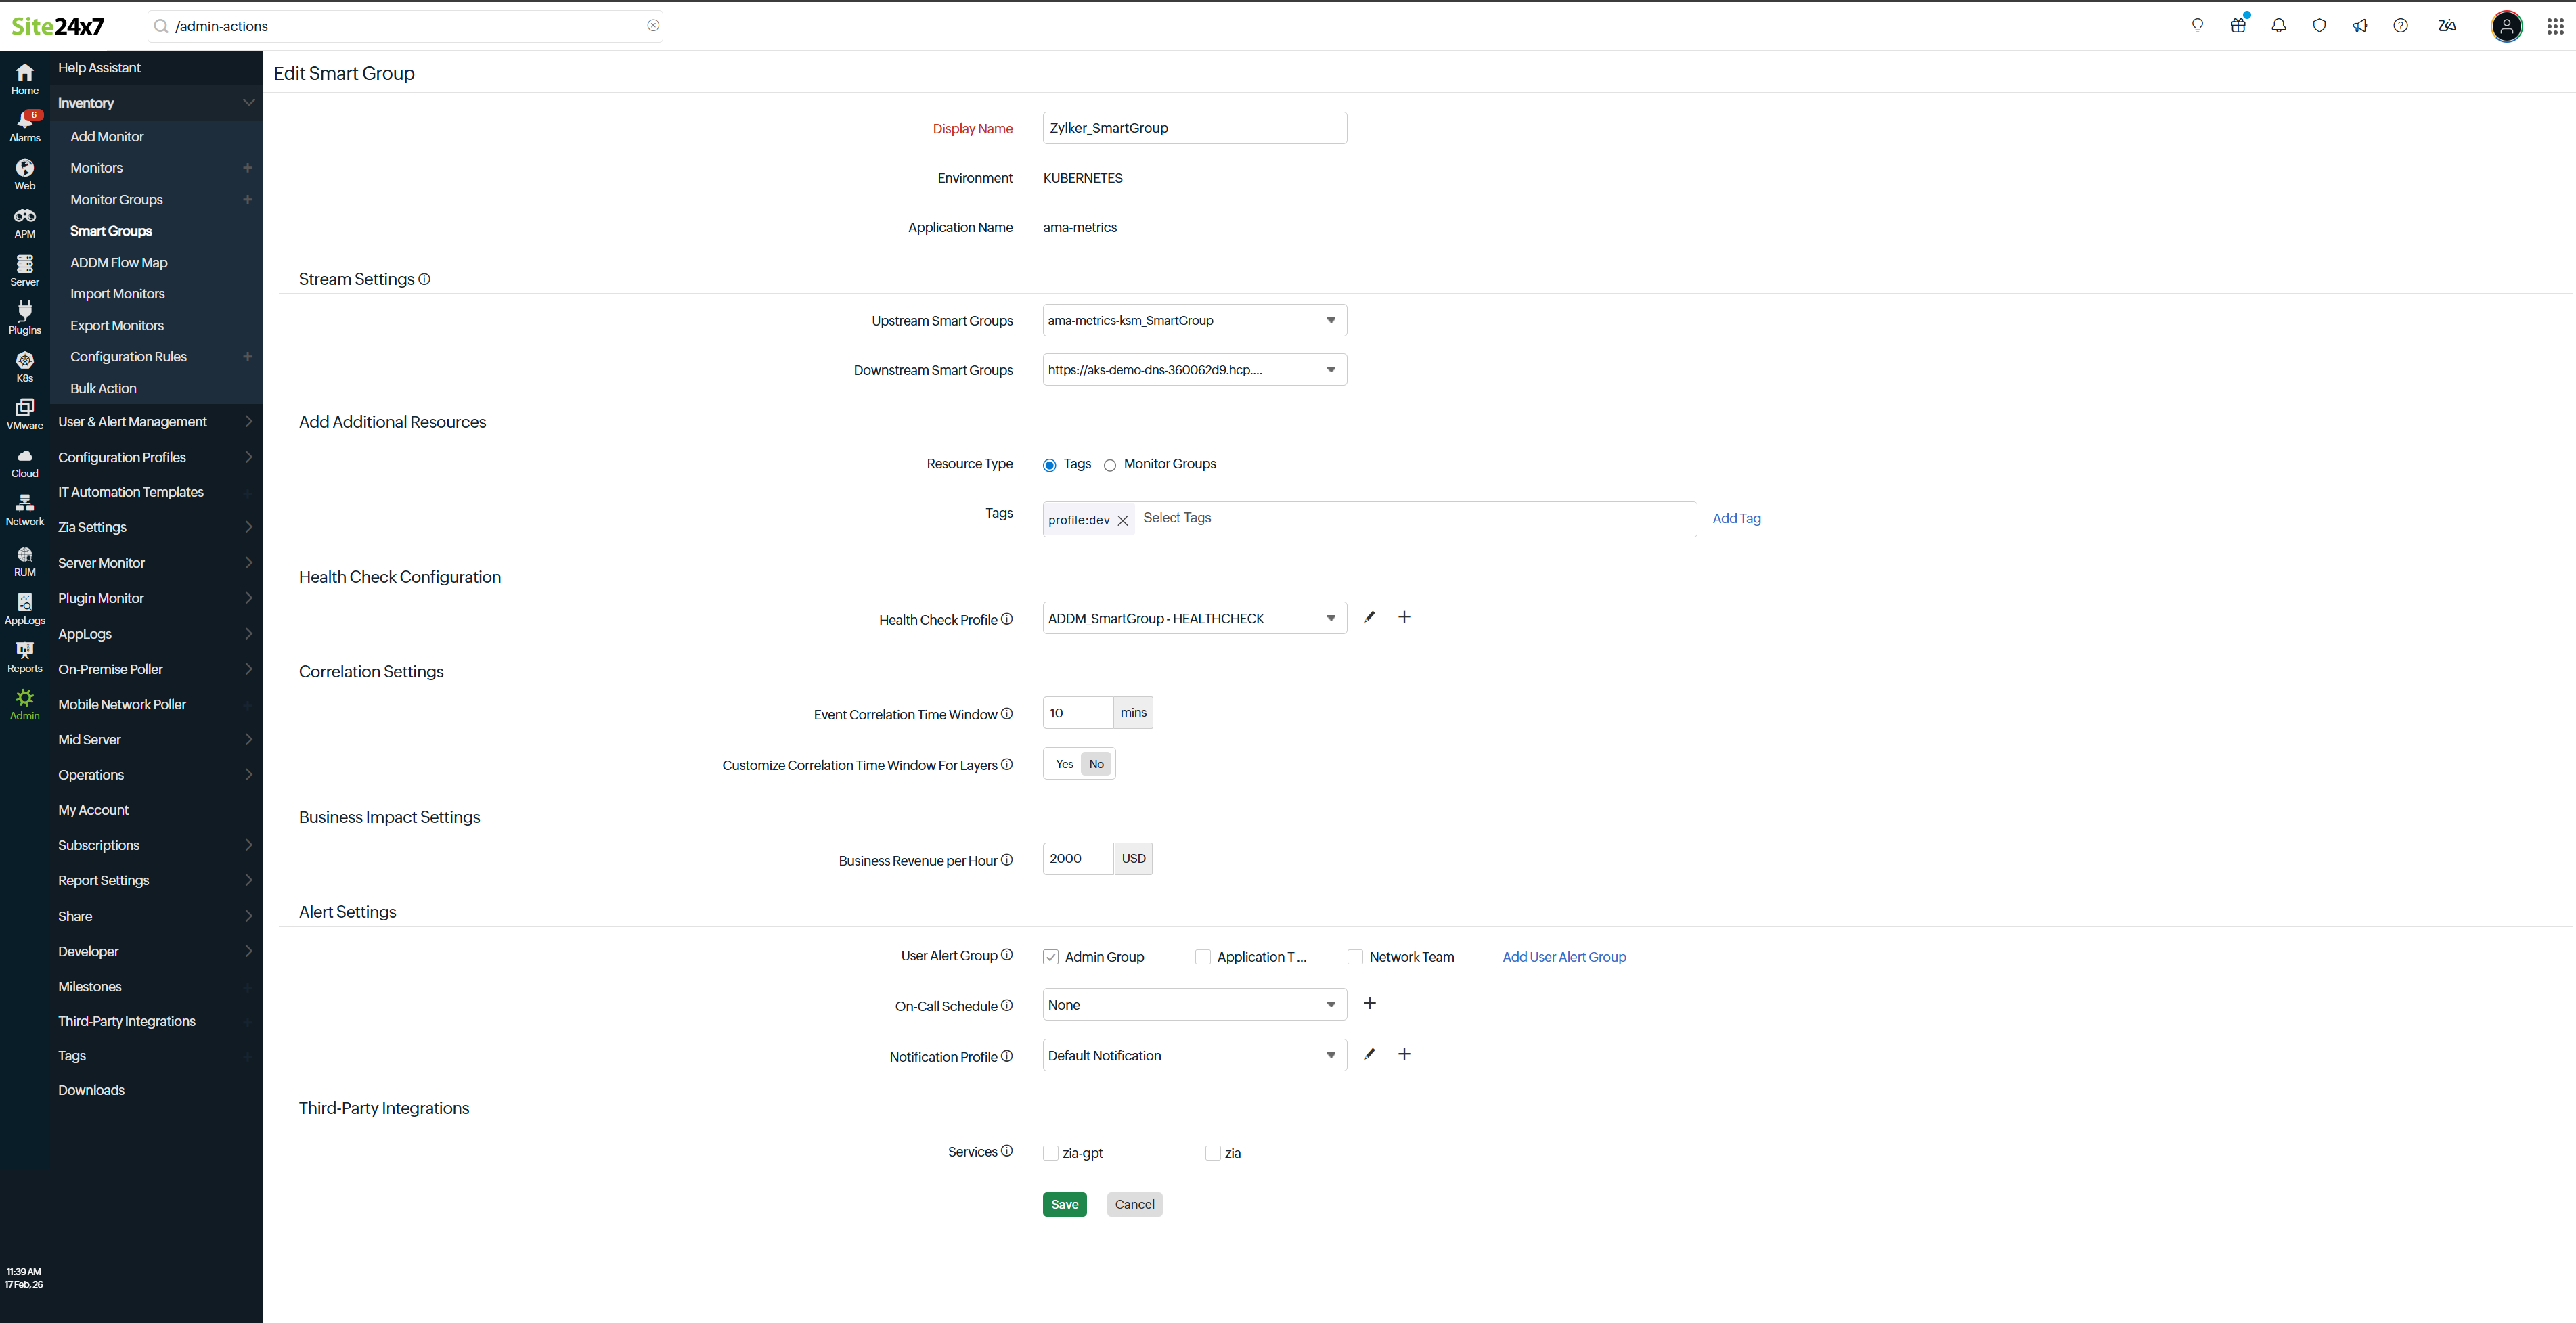
You can edit the desired smart group in the following ways:
- Modify stream settings
- Add resources to Smart Groups
- Configure a health check profile for Smart Groups
- Define the correlation time window for different event layers
- Modify business impact settings
- Configure alert settings and third-party integrations
Upstream and downstream displays the relationship between the Smart Groups and the direction in which transactions, requests, or dependencies flow across different layers of the infrastructure.
- Upstream refers to the source layer that sends requests or dependencies to another Smart Group. For example, a Network Smart Group that routes traffic to an Application Smart Group, meaning network disruptions can directly impact application availability.
- Downstream refers to the destination layer that receives requests or depends on another Smart Group. For example, a Kubernetes Infrastructure Smart Group that supports a Kubernetes Deployment Smart Group, meaning infrastructure failures can affect deployed workloads.
When configured, this setting displays a topology-map-like structure in Problems, helping visualize service dependencies and trace the flow of impact.
To add resources to smart groups, follow the steps below:
- On the Edit Smart Groups page, under the Add Additional Resources section, set the Resource Type to Tags or Monitor Groups.
- Use the + icon to select the additional monitors from the drop-down menu to add them to the Smart Group.
A Smart Group is auto-deleted when the associated APM, Kubernetes, or Layer 2 map is deleted by the user.
Configure a health check profile for Smart Groups
A health check profile for Smart Groups helps determine the overall health of a group of related monitors. By defining health evaluation rules at the Smart Group level, you can control when a group should be marked as Down, Critical, or Trouble , based on the collective state of its members. This enables accurate alerting, efficient correlation, and reduced alert noise. Health check profiles can be used to:
- Evaluate the health of multiple related monitors as a single logical unit.
- Prevent false alerts caused by transient or partial failures.
- Correlate multiple alerts into meaningful incidents.
- Apply consistent downtime and threshold rules across grouped resources.
Follow the steps below to configure a health check for Smart Groups:
- Under the Health Check Configuration section, click the + icon next to the Health Check Profile field to add a threshold profile.
- Select Health Check from the Monitor Type drop-down menu.
- Enter an appropriate name in the Display Name field.
- Enable Sync Smart Group Status with Health Check Status to ensure the Smart Group’s status reflects the evaluated health check result instead of individual monitor states.
- Select Yes for Mute Alert for Monitored Resources to suppress alerts from individual monitors and avoid duplicate notifications when the Smart Group health is evaluated.
- Select Yes to Notify as Trouble when a monitored resource is Down/Trouble/Critical to ensure the Smart Group is marked as Trouble when any individual resource becomes unhealthy, preventing unnecessary escalation to Critical or Down while still highlighting partial impact.
- Select Yes for Mute Alert for Subgroups to prevent alerts from child groups and reduce alert noise from dependent resources.
- Select Yes for Notify for Count-Based Thresholds to receive alerts only when the defined number of monitors breach the configured thresholds.
|
Situation |
When Sync Smart Group Status with Health Check Status is toggled to |
When Notify for Count Based Thresholds is toggled to |
Result |
|
1 |
Yes |
Yes/No |
The Smart Group status gets synced with the Health Check status. |
|
2 |
No |
Yes |
The Smart Group status will not be synced with the Health Check status. However, the Health Check status will be updated based on the Monitor count threshold to decide the Smart Group's status. |
|
3 |
No |
No |
The Smart Group status is updated based on the Monitor count threshold to decide the smart group's status. The Health Check status is updated based on the Health Check threshold configuration. |
9. The supported metrics are displayed in the Threshold Configuration section. You can set threshold values for all the supported metrics.
10. Use advanced threshold configuration to combine multiple conditions using logical operators, allowing you to define complex health evaluation scenarios for Smart Groups.
11. Click Save.
Modify the correlation time window
- On the same page, under the Correlation Settings section, set the Customize Correlation Time Window For Layers option to Yes.
- Configure the correlation time window for each event layer (default is 10 minutes).
You can specify the revenue your business generates per hour for the services or monitors of this group. Site24x7 uses this value to calculate potential revenue loss when incidents occur, helping prioritize critical problems.
1. Under Business Impact Settings, configure the Business Revenue per Hour option in USD to quantify the financial impact of downtime for the Smart Group.
Configure alert settings and integrations
Configure alerts and integrations to notify the right teams and tools about critical Smart Group problems in real time.
- Under Alert Settings , select any User Alert Group or click Add User Group to add a new user alert group.
- From the On-Call Schedule, and Notification Profiles options, select the desired settings from the drop-down menus.
- Under Third-Party Integrations, configure the desired third-party tool to communicate with in case of issues.
How to manage user access to Smart Groups
Managing user access permissions for a Smart Group ensures only authorized users can view or manage the monitors and insights within that group. Follow the steps below to assign user access to a Smart Group:
- Select the desired Smart Group.
- Click the hamburger icon beside the group's name and select Manage User Access .
- Using the Manage User Access Permissions for this Monitor Group form, configure:
- Add Users: Select and assign users who should have access to the Smart Group from the drop-down menu.
NoteThe users with global access to all monitors automatically get access to all Smart Groups.
- Add Users: Select and assign users who should have access to the Smart Group from the drop-down menu.
- Click Save to confirm the access permissions.