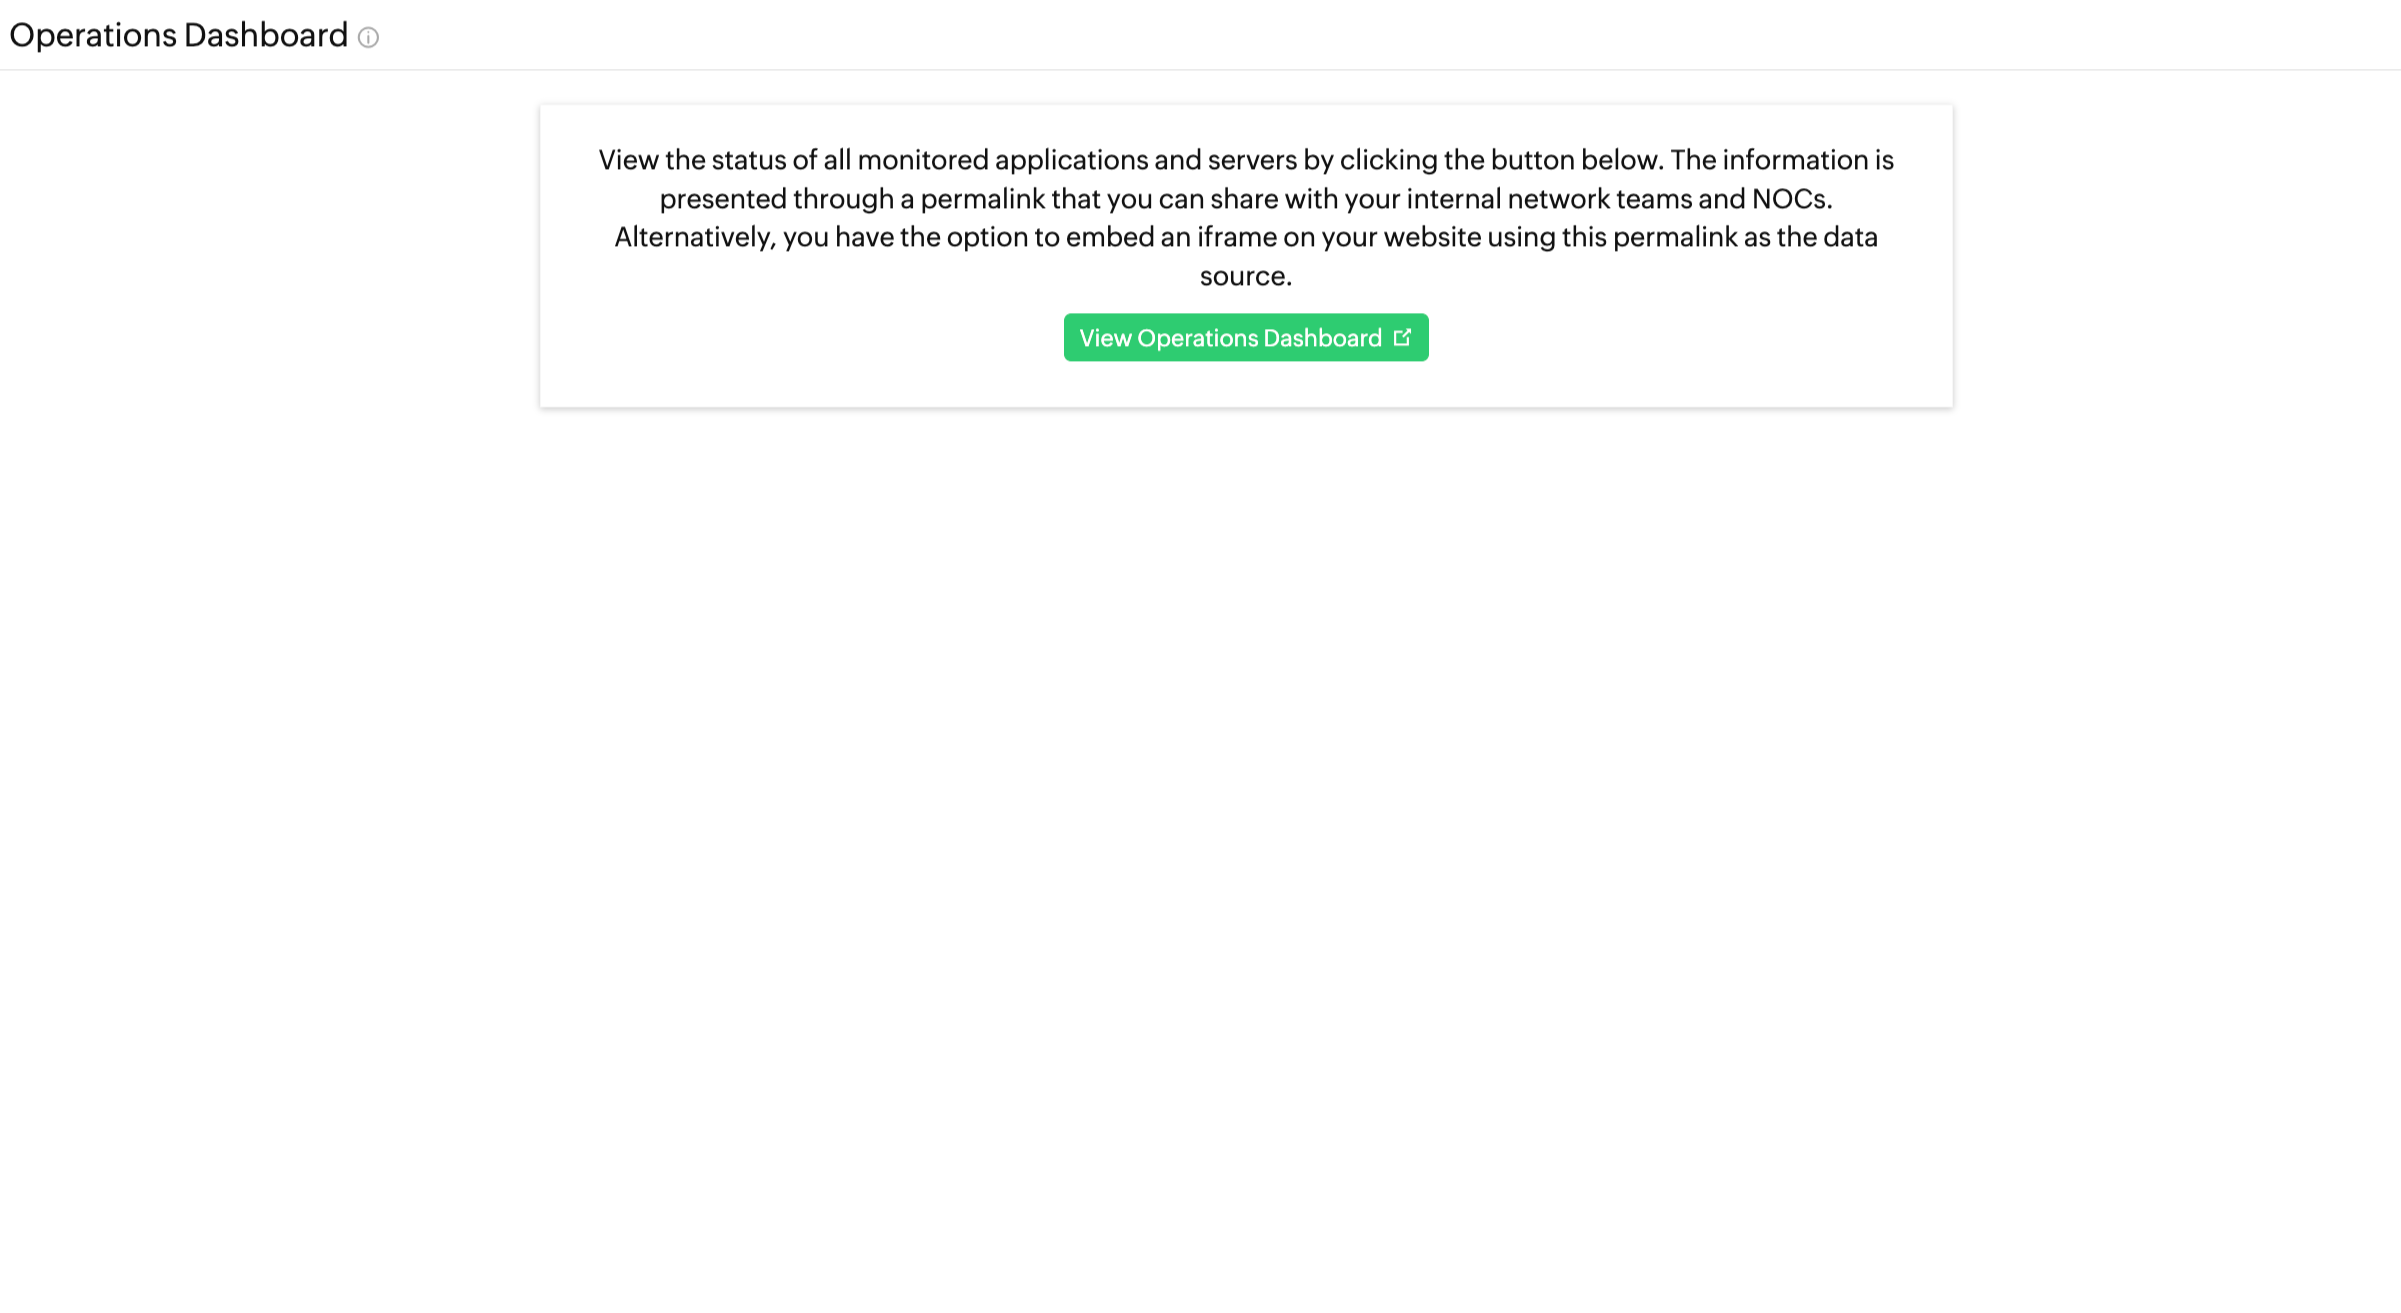
Operations Dashboard
Get an at-a-glance status of all applications and servers monitored. Simple embed options make it really useful for a NOC.
Add Dashboard View
- Click Admin > Share > Operations Dashboard.
- Click Add Dashboard View in Operations Dashboard screen.
- Specify the following details to add an Operations Dashboard:
- Dashboard Name: Provide an appropriate display name for identification purpose.
- Select Resource Type: Select the required monitors or monitor groups from the dropdown list for which you need a dashboard view for.
- Include Subgroups: Enable this option to include subgroups of the selected Monitor Groups. Otherwise, only the selected Group will be considered.
- Select Dashboard Layout: Select the required layout from the list provided.
If Layout 1 is selected, mention the following detail: - Show service owners who accessed the account during outage: Check this option to show the operators who visited the account during the outage.
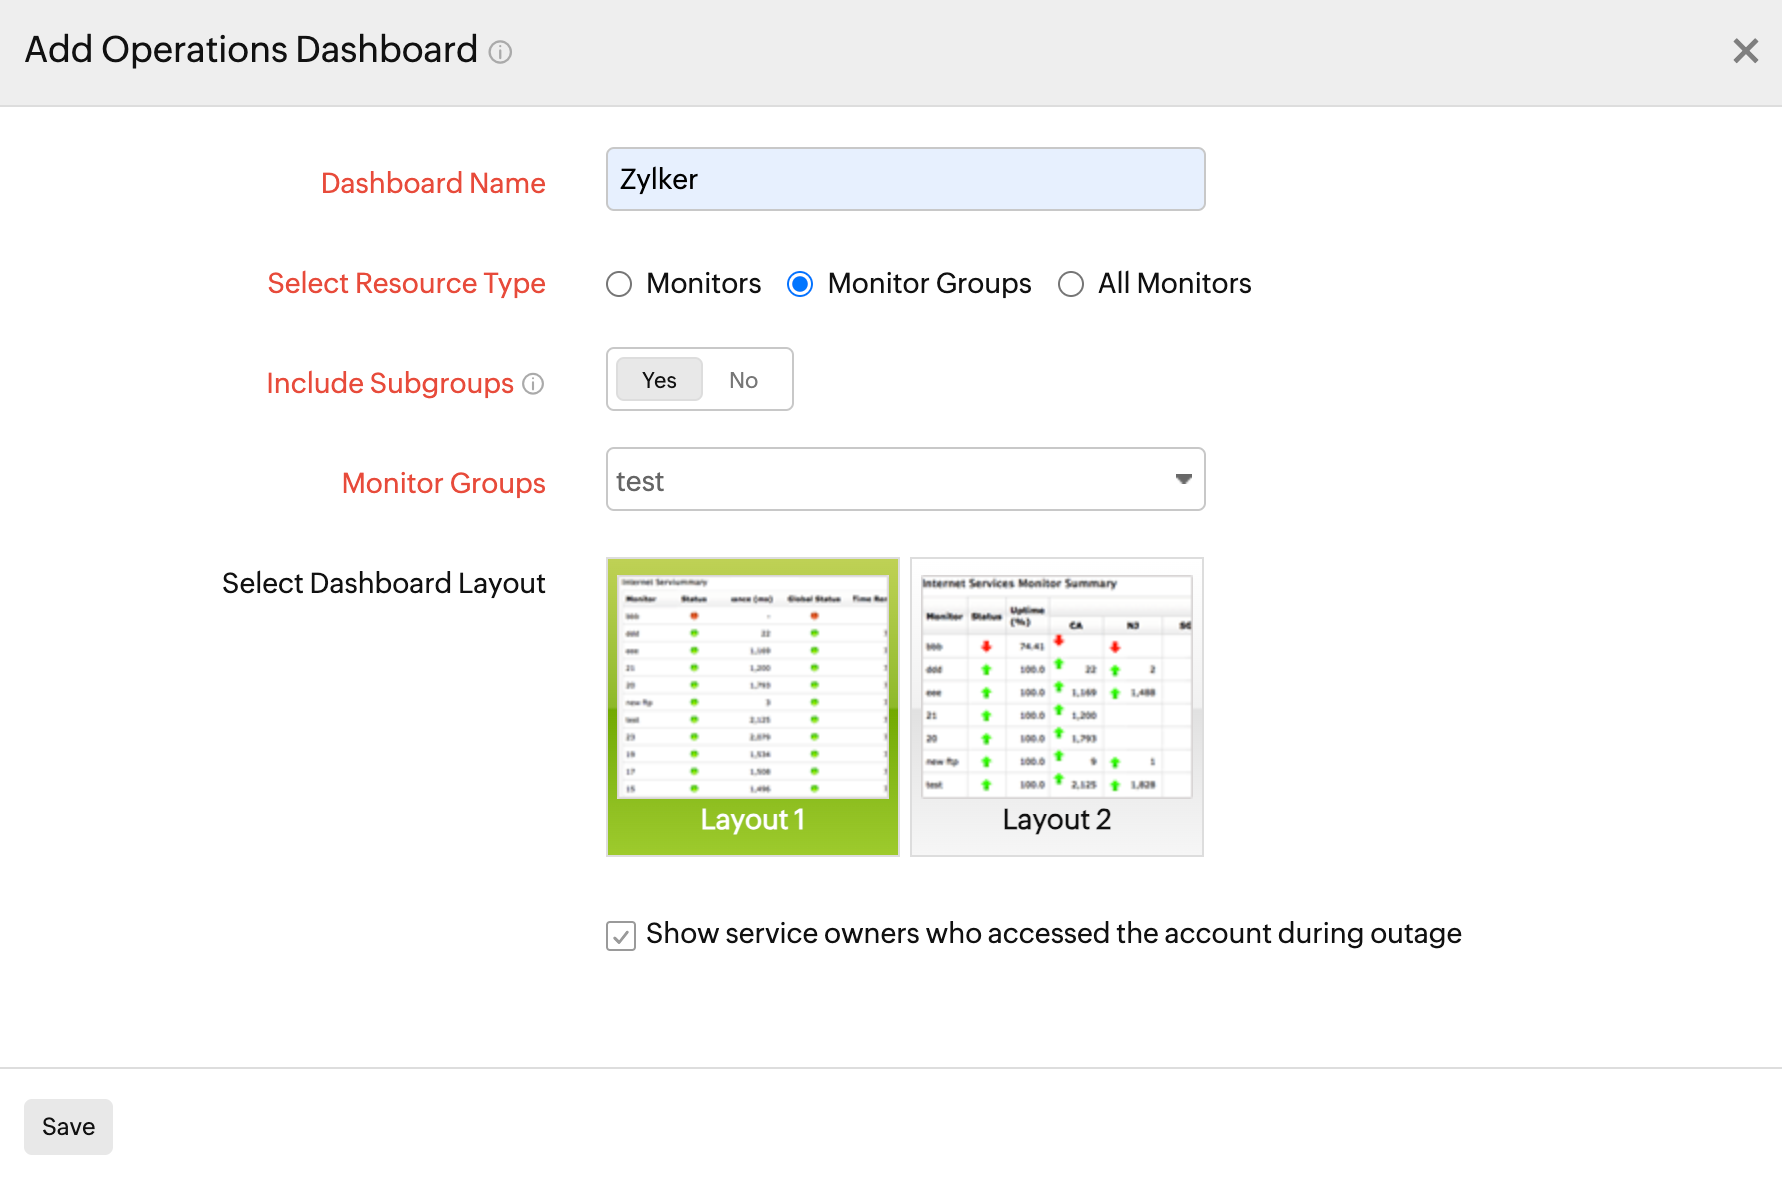
- Click Save.
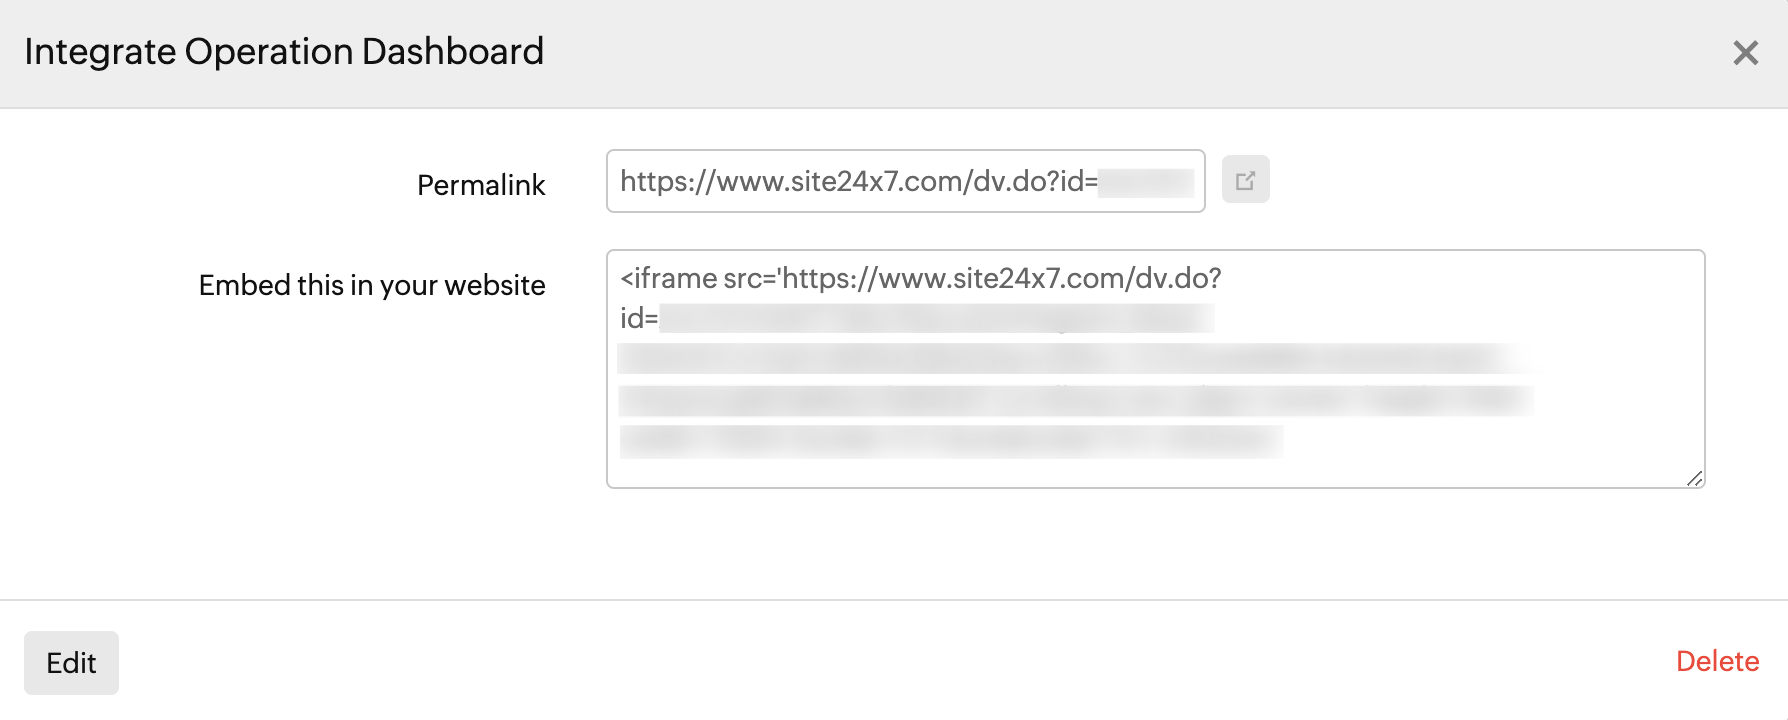
- Once saved, this will navigate to Integrate Operation Dashboard window.
- To View the Operations Dashboard Links, perform anyone of the following:
- Permalink: A default permalink is provided for the users. You can use this link to view the operations dashboard.
- Embed this in your website: Use this Iframe code to embed into any other HTML document.
- The Dashboard view created will be automatically added in the Operations Dashboard screen with those already created.
NoteA default Dashboard view is also provided for the users in Operations Dashboard screen where they can edit and add the required monitors for their dashboard view.
Edit the Operations Dashboard
- Click on the Operation Dashboard view which you want to edit.
- Click Edit in Integrate Operation Dashboard window.
Delete the Operations Dashboard
- Click on the Operation Dashboard View which you want to delete.
- Click Delete in Integrate Operation Dashboard window.
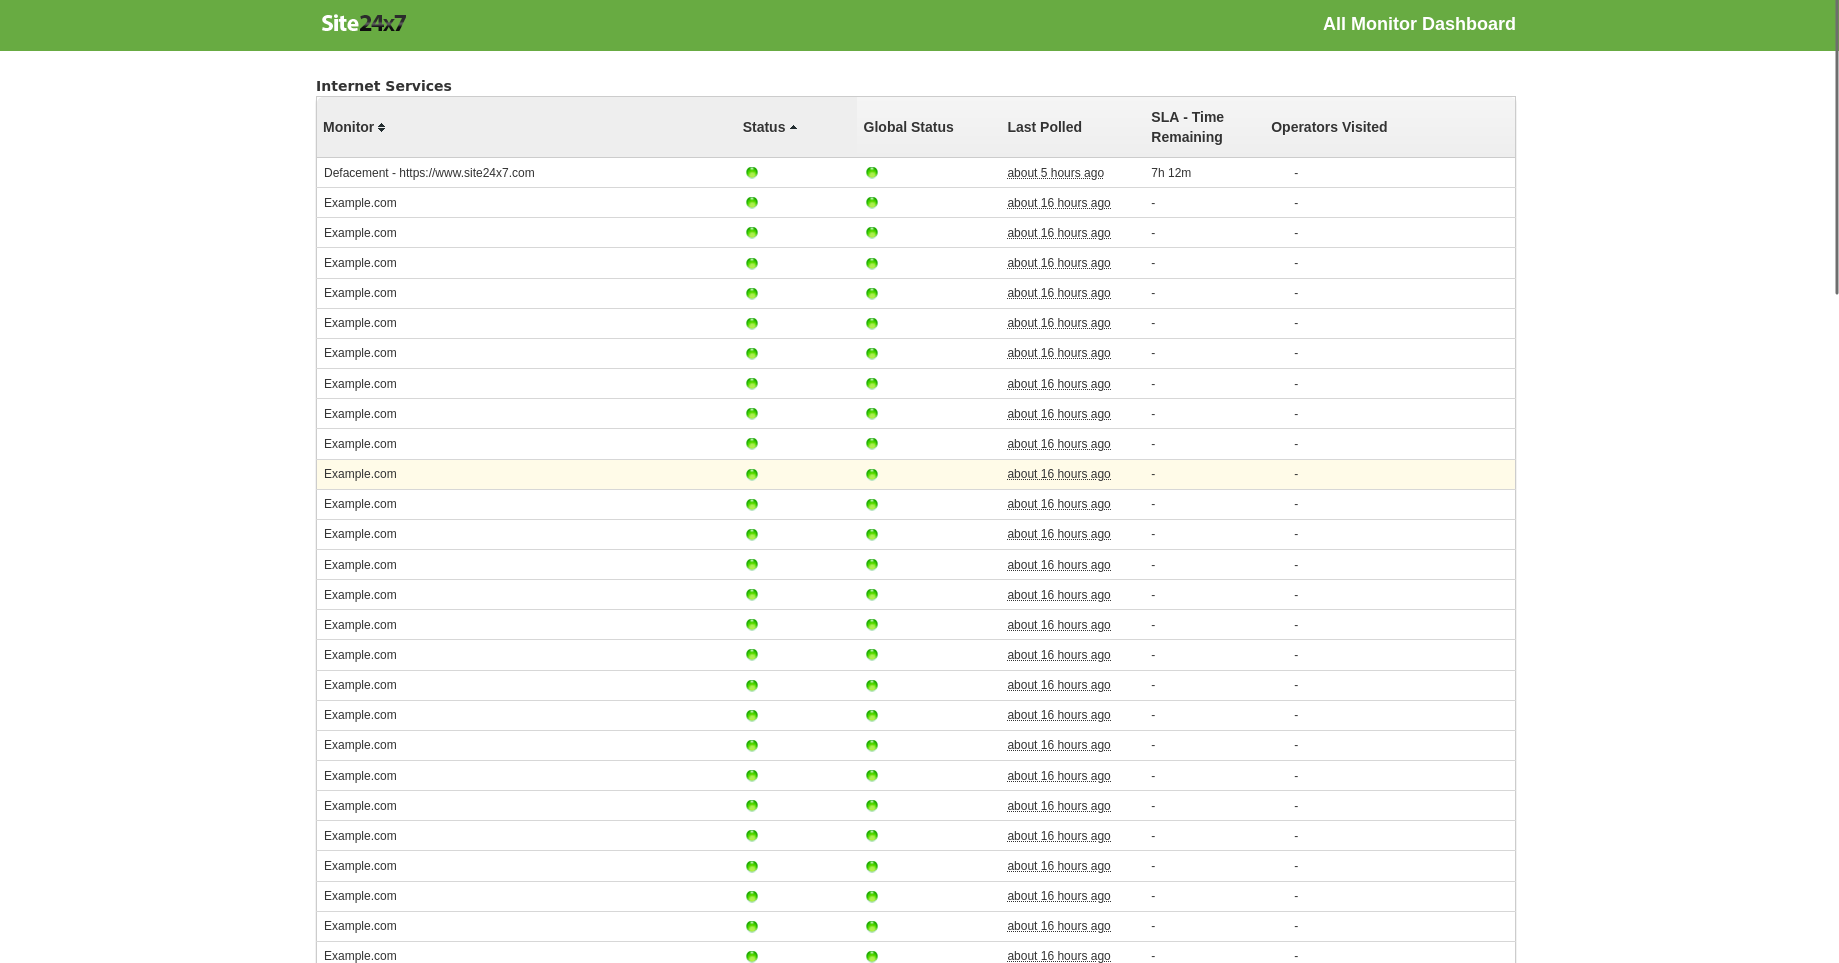
View Operations Dashboard
Get an at-a-glance status of the uptime and performance of all your applications and servers from multiple locations. View reports in a customized dashboard inside your webclient Home tab and share it across all your IT teams. Furthermore, track critical metrics like CPU percentage, Memory percentage, disk percentage, Network traffic rate, and much more. You can use the Download CSV button to export data on the dashboard.