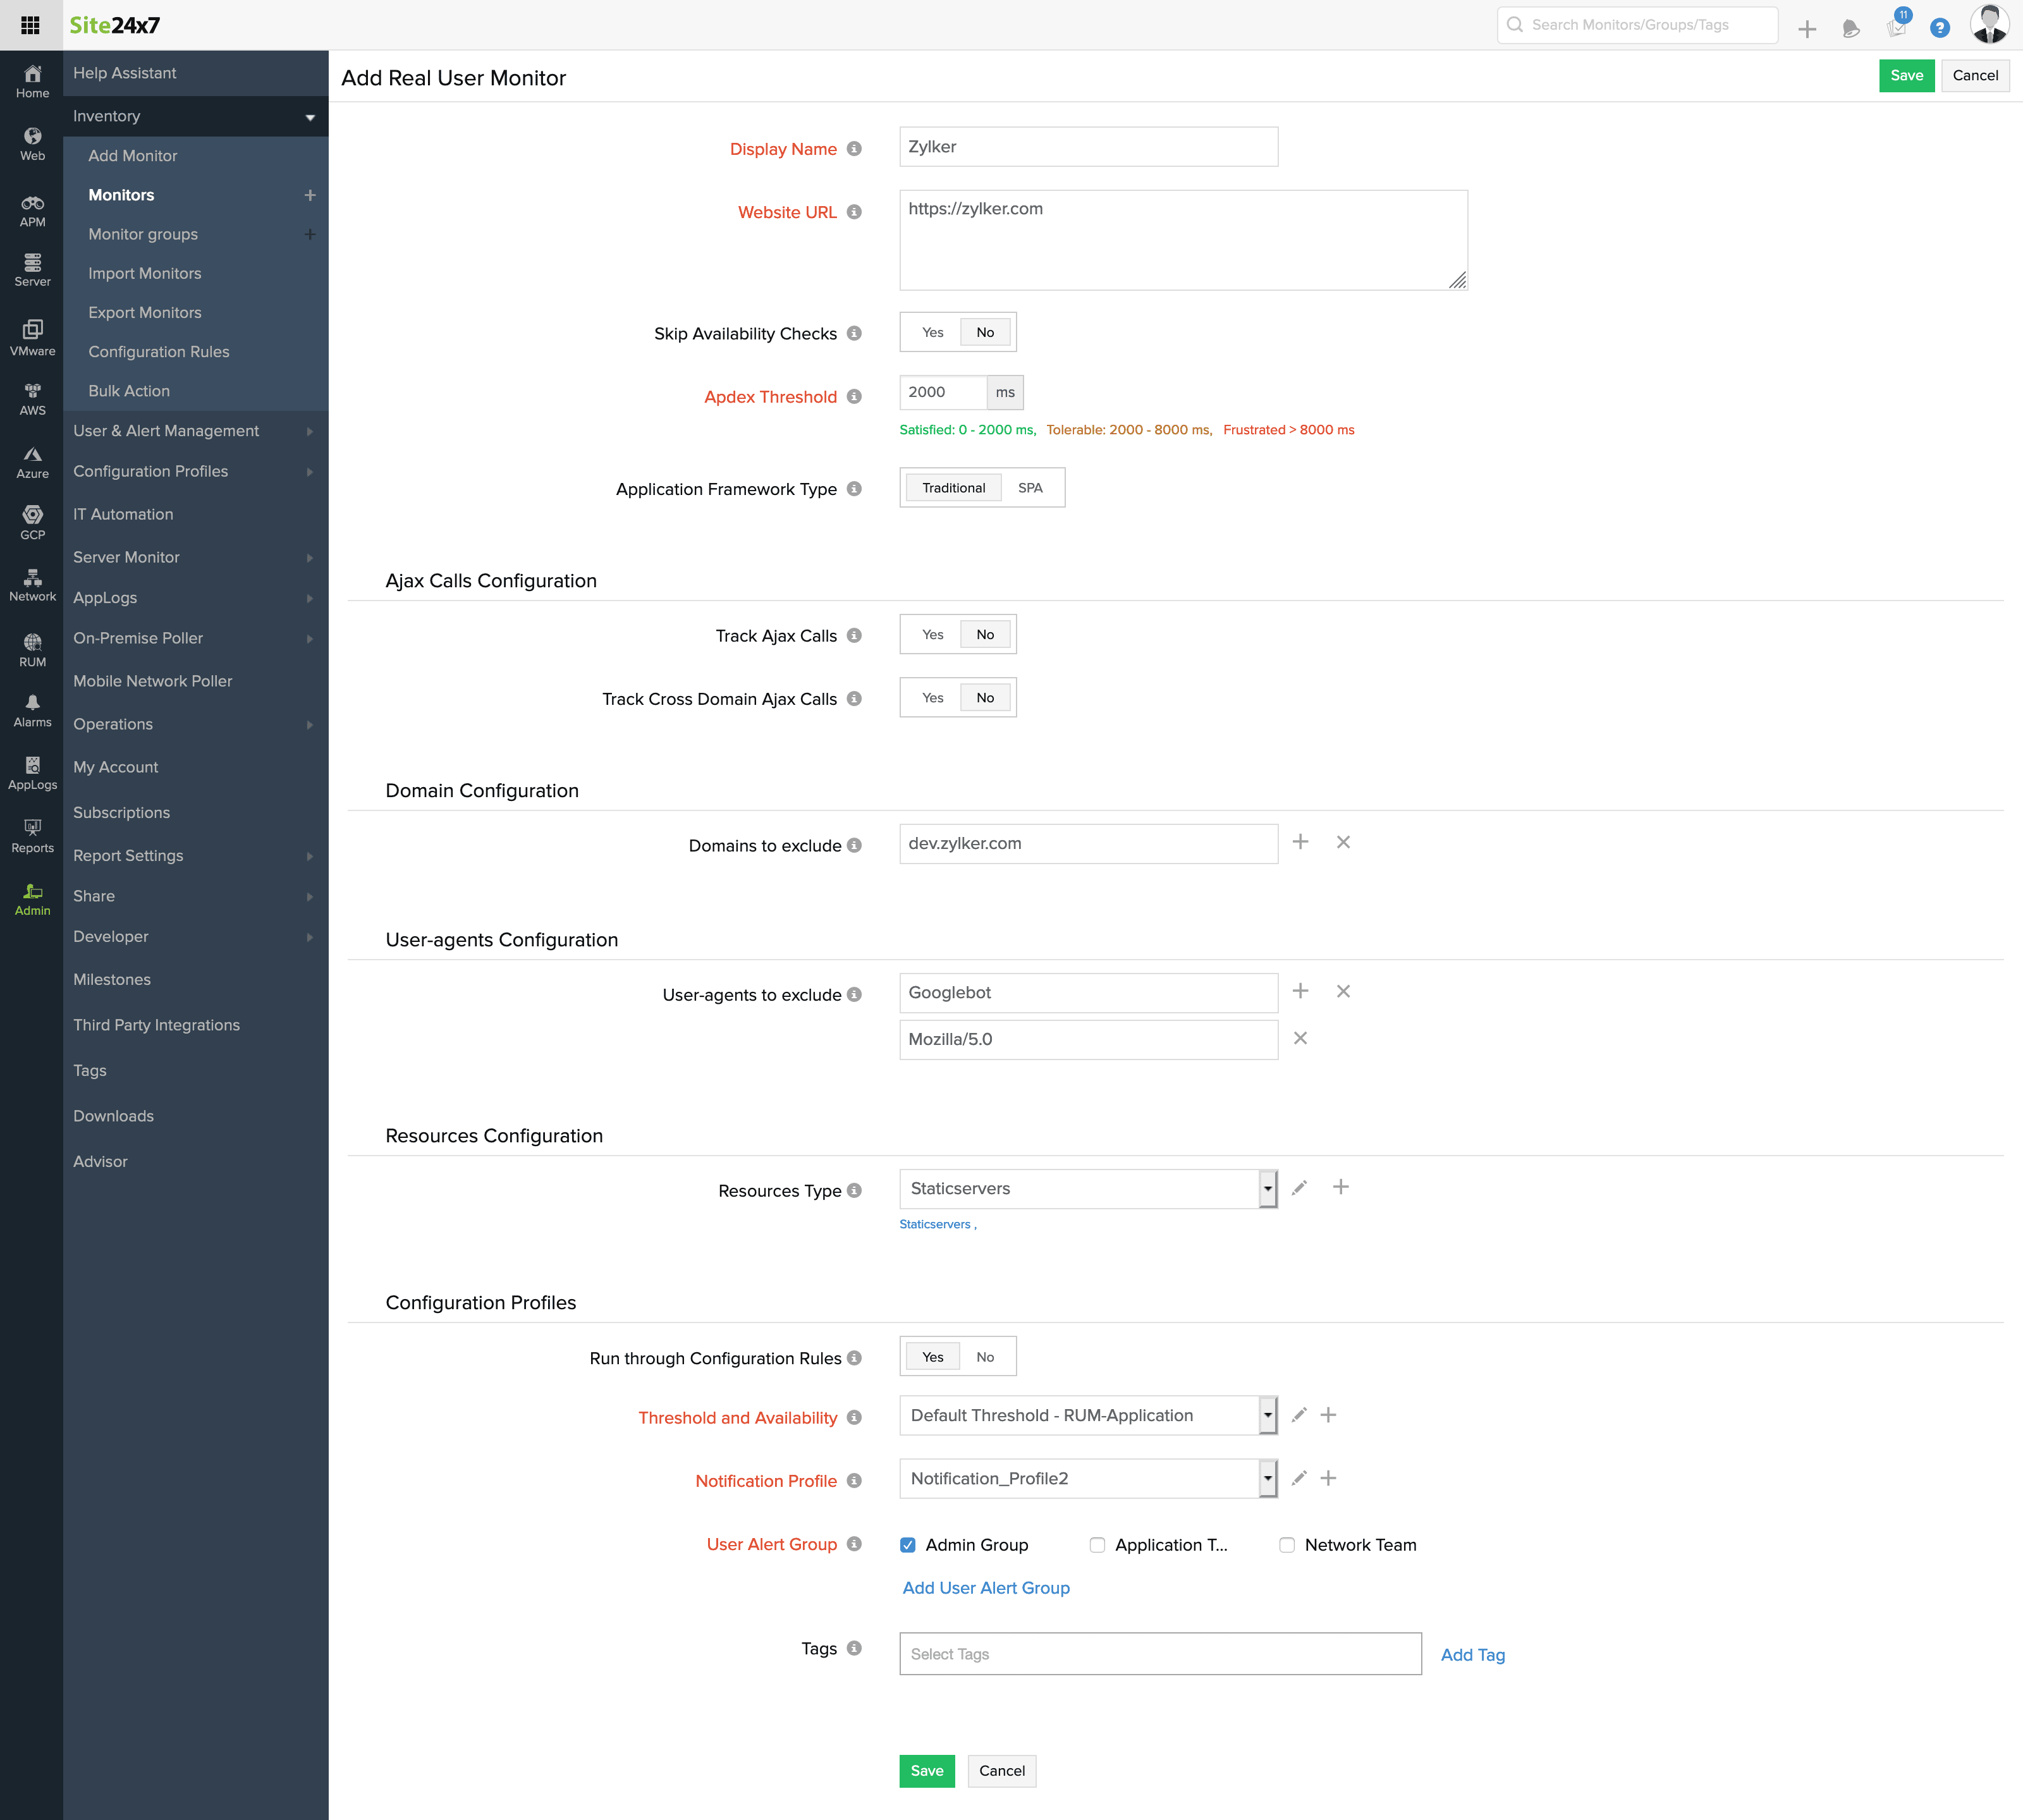
Add RUM monitor
Real User Monitoring (RUM) gives you visibility into behind-the-scene performance of a web application and accurate insight into end-user experience. RUM visualizes application interaction patterns and gives in-depth understanding of problems affecting real users accessing websites and applications in real-time. You also get to analyze application performance from every aspect like browser, platform, geography, ISP and more.
How It Works?
Users simply need to generate a small Javascript snippet and install it in the header or footer part of the HTML code of the web application that needs to be tracked. From there on, all the performance data would be captured and presented in a single Site24x7 console. Site24x7 Real User Monitoring supports major browsers like Chrome, Firefox, Safari and Opera.
Create a Javascript Snippet
- Login into Site24x7
- Select APM > Web RUM > Add Application.
- Enter the Application Name and Apdex Threshold.
- Click Save.
- A script code will be generated in Add Real User Monitor screen. Copy and paste the script code to the pages of your application or website which you would like to monitor.
- Click Continue followed by Finish.
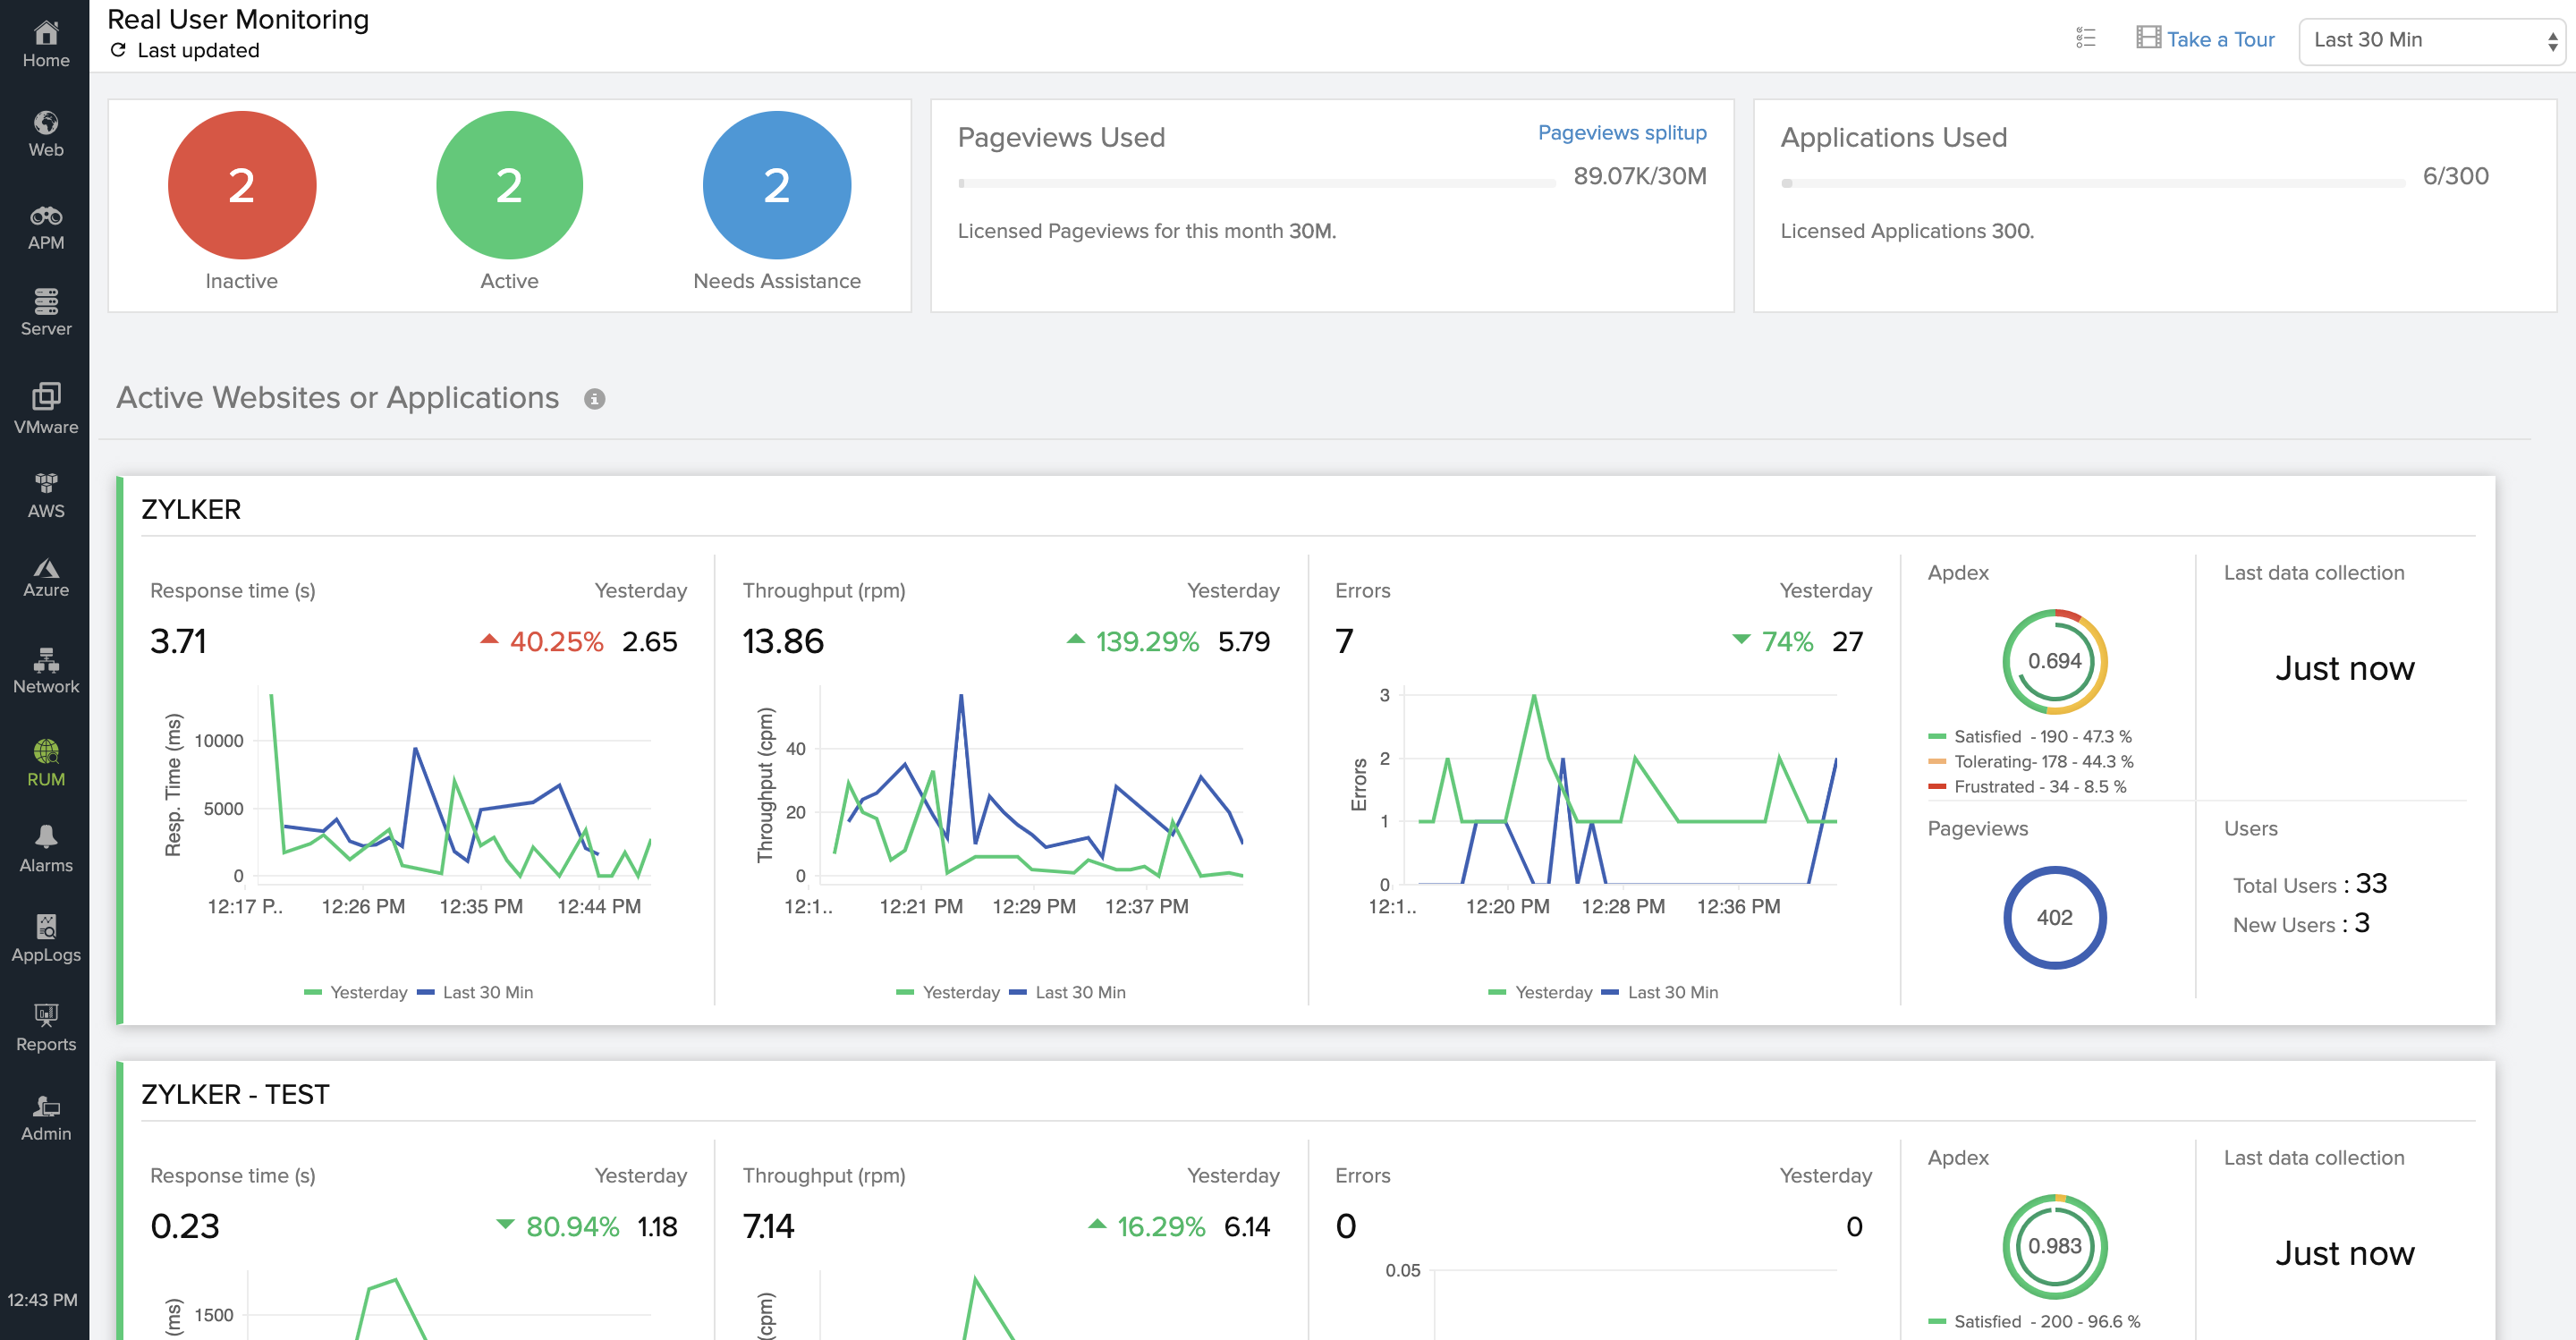
The RUM monitor you added will appear on the main RUM dashboard. Now you can access the performance data from Site24x7 RUM console.
Browsers Supported
Browsers |
Versions |
| Internet Explorer | 9 and above |
| Firefox | 31 and above |
| Chrome | 31 and above |
| Safari | 8 |
| Opera | 25 and above |
| Android Browser | 4.1 and above |
| Chrome for Android | 39 |
Read Monitor Details
Details of every aspect of your web applications can be assessed using various tabs in the page.
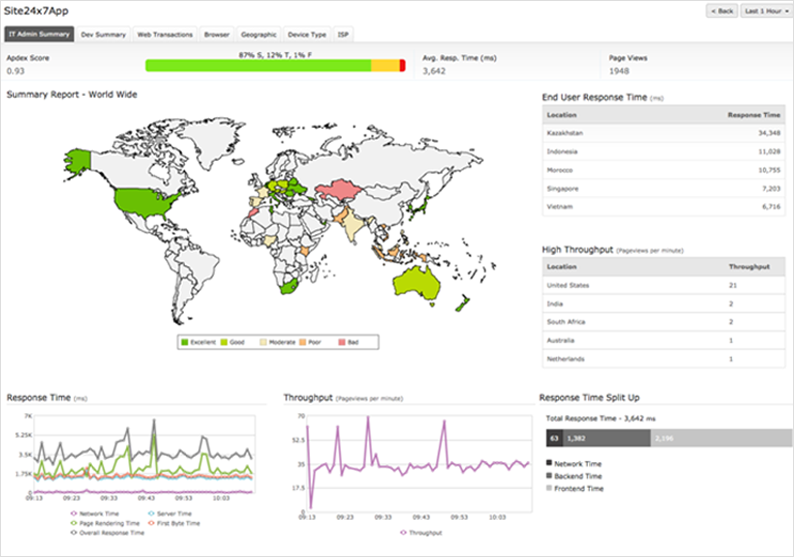
Clicking on IT Admin Summary tab gives you a graphical representation of application response time and throughput globally.
Clicking on the Dev Summary tab displays the response time under various components like network time,back end time and front end time.
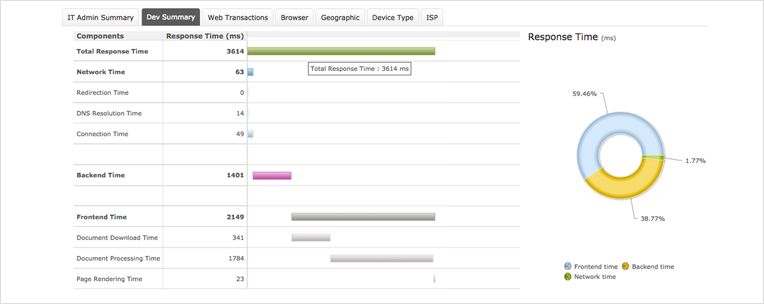
- The network time consists of the redirection time, the DNS Resolution time and the connection time. This includes the time spent in redirects and estabilishing connection with the server.
- The backend time is the interval between the time at which the request was sent and the time at which the first byte of response was received.
- The frontend time consists of the document ready time and the page rendering time. This is the time taken by the browser to receive the response, construct the DOM object and render the page.
Metrics |
Description |
| Redirection Time | Time taken for the HTTP redirects or equivalent while navigating. |
| DNS Time | Time taken for domain name lookup for the current document. |
| Connection Time | Time taken for establishing connection with the server so that current document can be retrieved. |
| Document Ready Time | Time taken for receiving the response from the server and to build the DOM object. |
| Page Rendering Time | Time taken to completely render the page. |
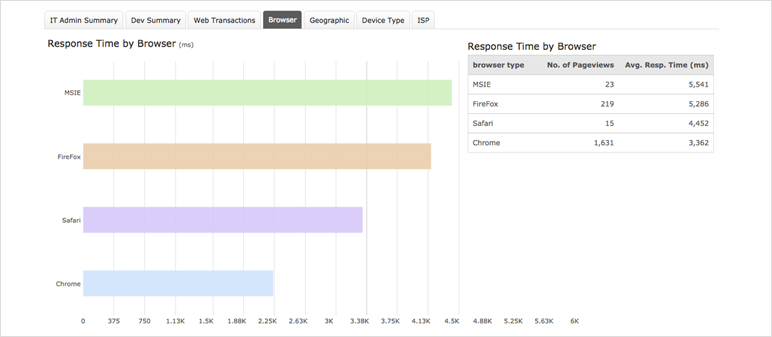
Clicking on the Browser tab displays the avg. response time split by browsers. Details include browser type, no. of requests and avg. response time.
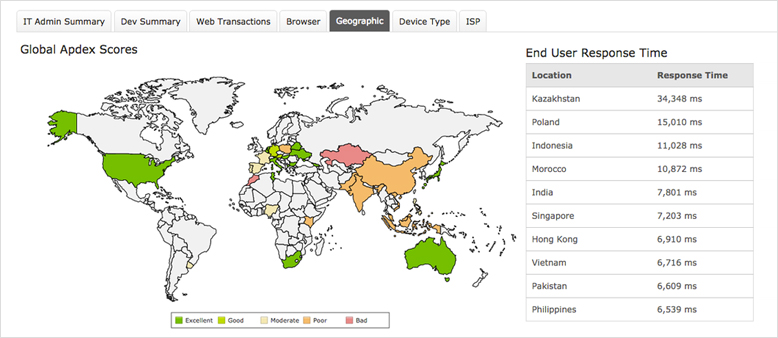
Clicking on the Geography tab gives a graphical representation of application response times globally and if it is excellent, good, moderate, poor or bad.
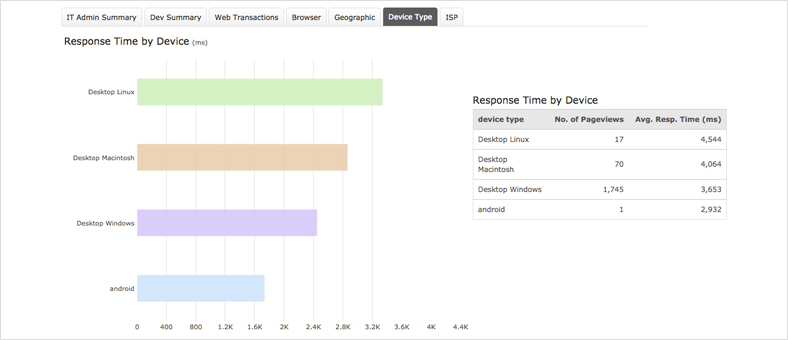
Clicking on the Device Type tab displays the avg. response time by devices. Here you can see response time metrics from various platforms like desktop, tablet, mobile and operating system.
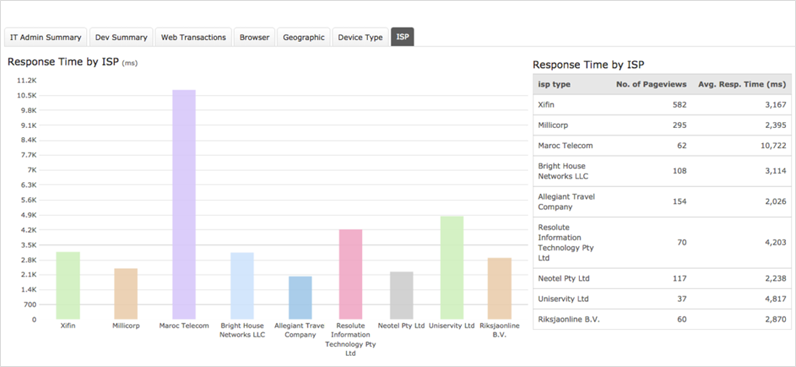
Clicking on the ISP tab displays the avg. response time by Internet Service Providers. Details include response time by ISP type, no. of requests and avg. response time.
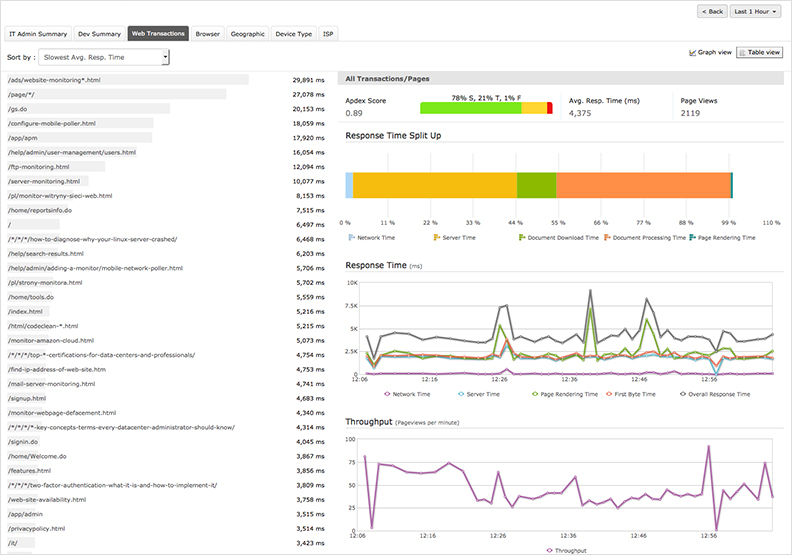
Clicking on Transactions tab displays the response time by each web transaction with graphical representation of both response time and throughput.
