DNS Server
DNS Server monitor regularly checks the performance of your DNS servers and alerts you instantly when the DNS lookups are faulty or when the socket connection time to the DNS Server exceeds the set limit. You can also ensure forward lookups are working and your domain names are resolving correctly. Site24x7 supports different DNS record lookup types, viz., A, AAAA, CNAME, NS, MX, SOA, PTR, SRV.
Add DNS Server monitor
- Login to Site24x7.
- Click Admin > Inventory > Add Monitor.
- Select DNS Server in Add Monitor page.
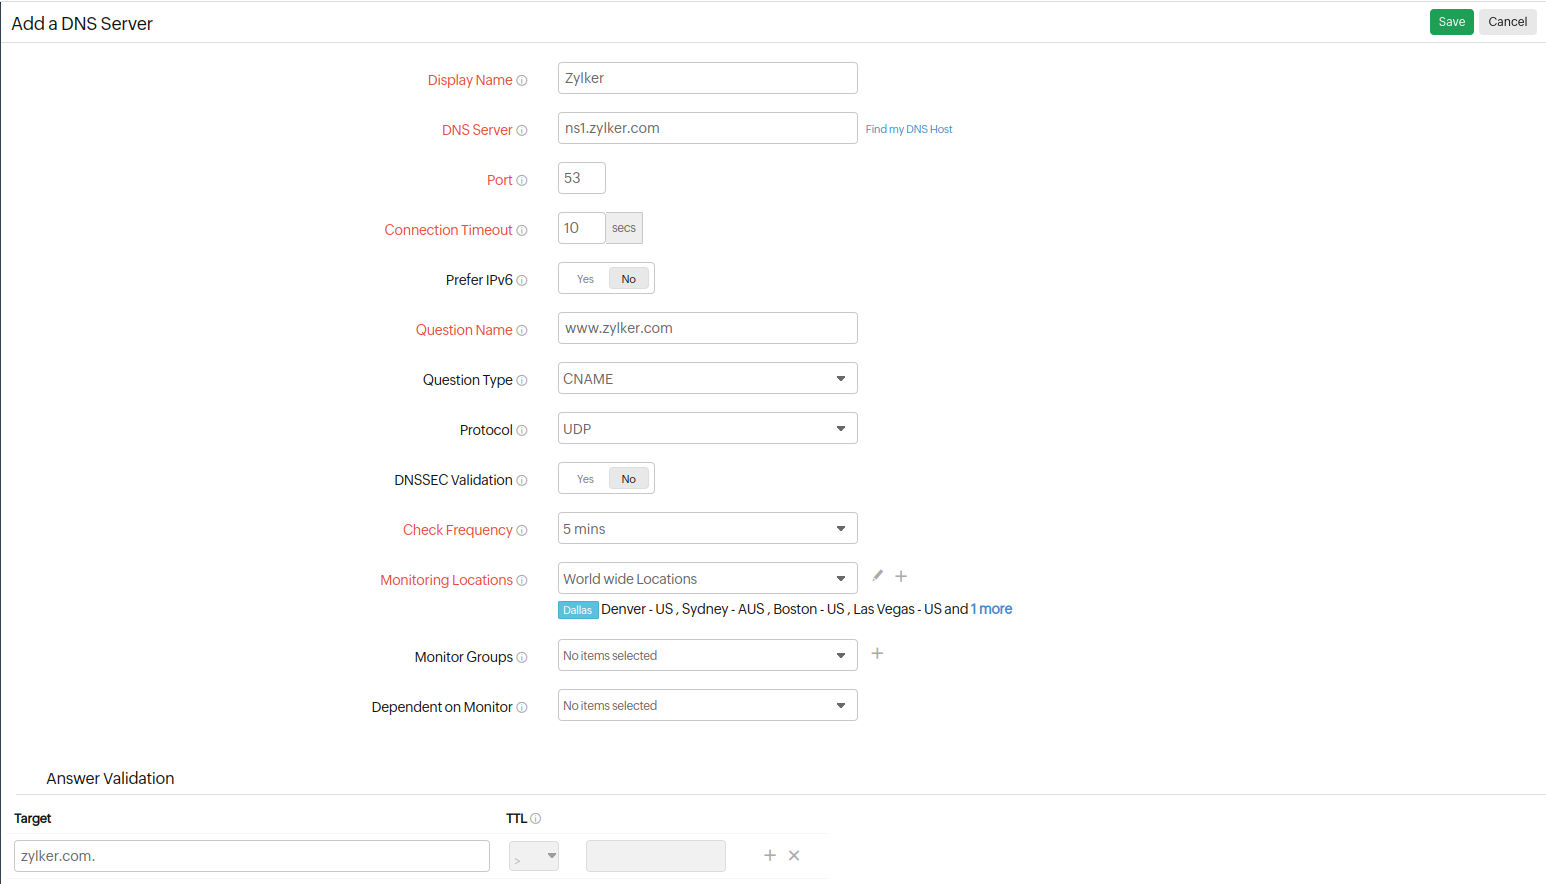
- Specify the following details to add the DNS Server:
- Display name: Provide an appropriate name for the DNS server .
- DNS Server: Enter your DNS Host name. You can use Find my DNS Host option to find your DNS Host.
Note
- Enter your domain name to find name servers and IP addresses for your domain.
- After fetching the results, copy any one of the the name server or IP address to DNS Host field in the DNS Server screen.
- Port: Enter your DNS Port number.
- Connection timeout: Specify time in seconds the connection need to establish with the target server. When time exceeds, the DNS server will report a Connection Error.
- Prefer IPv6: If you want to test the DNS resolution and validation over IPv6 enabled locations, simply move the rocker button to Yes when creating or editing a monitor form.
Note
- Site24x7 lets you monitor your dual-stacked IPv4/IPv6 based infrastructure as per you need. IPv4 will be enabled as the default protocol. You'll be able to monitor your IPv6 infrastructure, once you enable the rocker button to IPv6. If the connectivity over IPv6 fails, it will not fall back to IPv4 automatically. Read more.
- Enabling IPv6 in the monitoring form doesn't make it compatible to monitor IPv4, by default. If you want to monitor a resource, which is compatible with both IPv4 and IPv6–you'll have to set up two separate monitor checks for this.
- Question name: Specify the domain name to query the server for.
For example: www.mydomain.com - DNSSEC Validation: Enable to authenticate DNS responses using Domain Name System Security Extensions (DNSSEC).
NoteYou can read our Kbase article to learn more about DNSSEC validation errors and troubleshooting tips.
- Question Type: Select the appropriate lookup type from the drop down list.
NoteSite24x7 supports different DNS record lookup types, viz., A, AAAA, CNAME, NS, MX, SOA, PTR, SRV,TXT, DNSKEY, CAA, DS.
- Protocol: Choose the protocol using which you wish to monitor your domain name server. You can choose TCP/UDP based on your requirements.
- Check Frequency: Choose the required poll frequency. The frequency can be set from 10 seconds to one day. The frequencies of 10, 15, and 30 seconds can be configured if you're using Enterprise, Enterprise Web, Enterprise Plus Web, Elite, Elite Web Packs, Team 2024, Team, Team Web, and MSP. For all other users, one minute will be the minimum supported check frequency.
Note
- Configuring a 30-second check frequency will consume the license of two basic monitors.
- Configuring a 15-second poll frequency will consume the license of four basic monitors and can be configured only with the On-Premise Poller locations.
- Configuring a 10-second poll frequency will consume the license of six basic monitors and can be configured only with the On-Premise Poller locations.
- Monitoring Locations: Select a location profile from the drop down list from where the DNS server can be polled from the selected location. The monitors with 10-second and 15-second poll frequencies will be supported only with On-Premise Poller locations. To know more, refer Location Profile.

-
- Monitor Groups: You can associate your monitor with multiple monitor groups by selecting the relevant monitor groups from the drop down list. This allows in logical grouping of your monitors.
To learn how to create a monitor group for your monitors, refer Monitor Groups. - Dependent on monitor: Select a monitor from the drop-down list to choose it as your dependent resource. You can add up to 5 monitors as dependent resources. Alerts to your monitor will be suppressed based on the Down status of your dependent resource.
Note
- Configuring a dependent resource and suppressing alerts based on the dependent resource's status is part of providing you with better false alerts protection. Learn more about alert suppression at monitor-level.
- If you select None in the dependent resource field, alerting will progress as per your normal configuration settings. No alerts will be suppressed in this case as the monitor doesn't have any dependent resource.
- Multiple monitor group support for monitors allow a monitor to be associated with multiple dependent resources in different monitor groups. If during a normal monitor status check, any one of these dependent resources' status is identified as Down, the alert for the monitor will be automatically suppressed. However, the dependency configuration at monitor level is always given the higher priority over any other monitor group level dependency configuration for suppressing alerts.
-
Answer Validation: Answer validation is available for all lookup types. With this option, you can check the DNS record values against the resolved DNS records and it supports 10 record checks for the configured question type.
You can also use the Regular Expression(regex) pattern in the Answer Validation section. The regex has to be specified in the below format:
${<regex>}Here are a few examples:
${127.0.0.1|127.0.0.2} - This regex will alert if any new record other than 127.0.0.1 and 127.0.0.2 is added.
${^127.*$} - This will check whether the IP address starts with 127 or not.
Learn more about monitoring and validating DNS IP changes using regex.TTL: Specify the TTL or Time To Live, and get alerted when the time goes beyond the specified value.
- Monitor Groups: You can associate your monitor with multiple monitor groups by selecting the relevant monitor groups from the drop down list. This allows in logical grouping of your monitors.
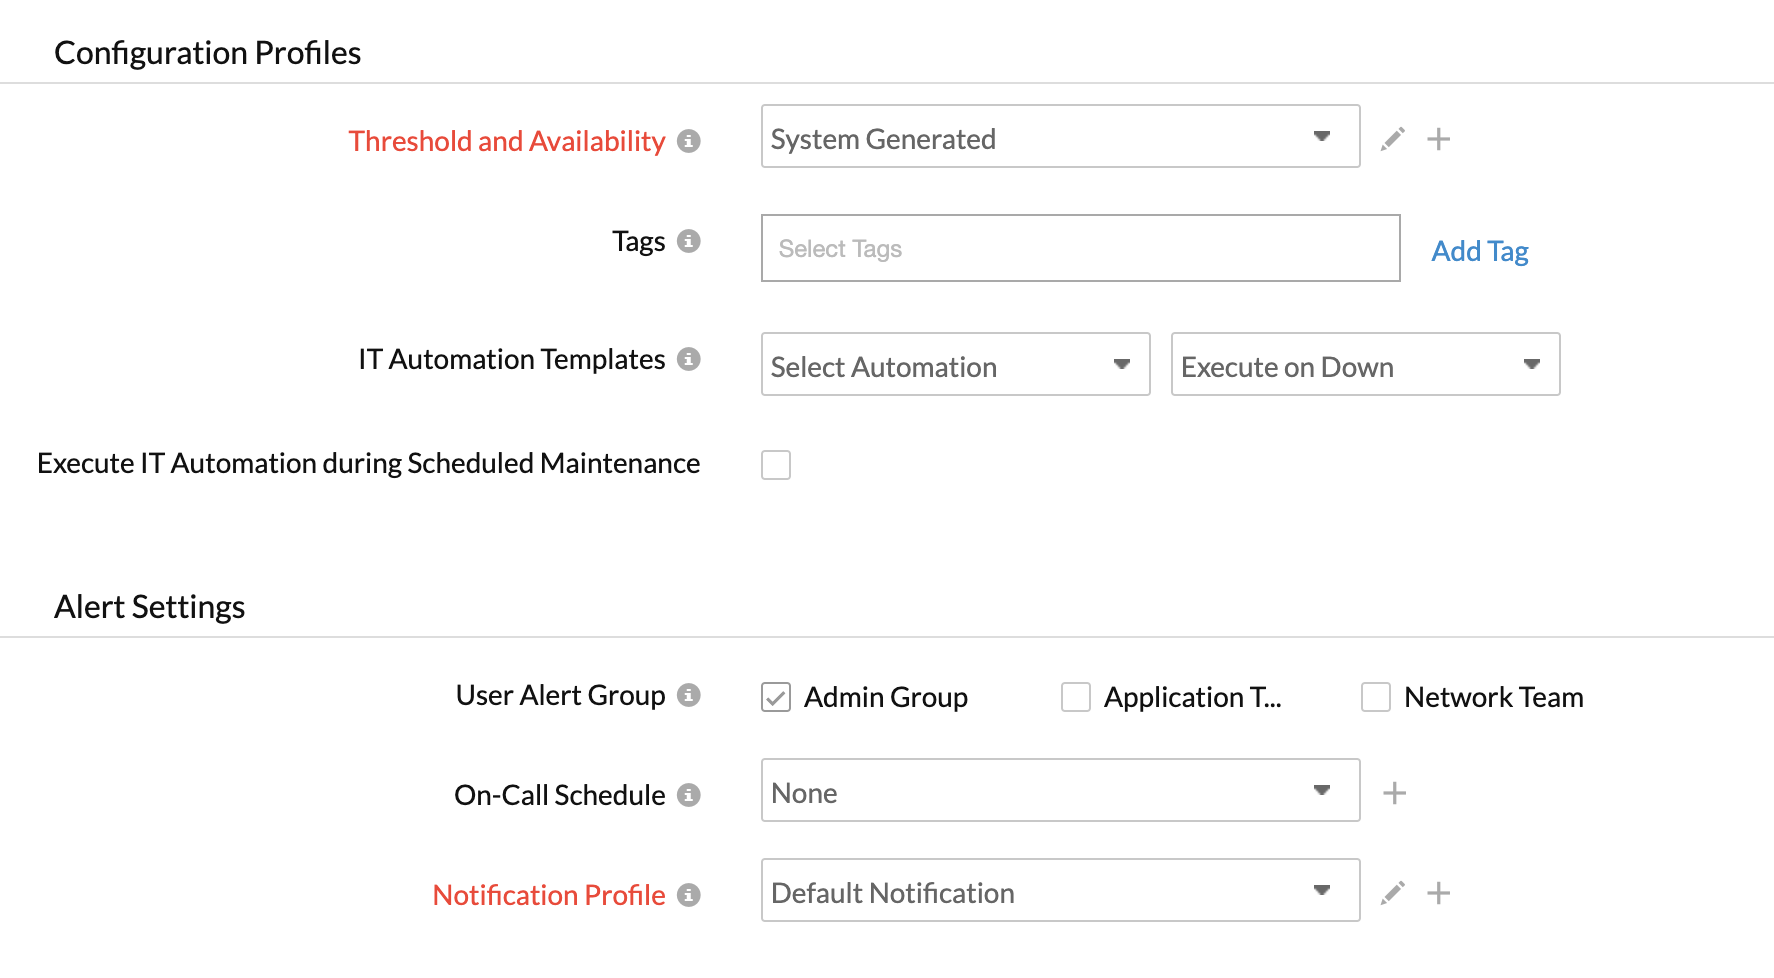
- Specify the following details for Configuration Profiles:
- Threshold and Availability: Select a threshold profile from the drop down list or choose the default threshold set available and get notified when the resources cross the configured threshold and availability.
To create a customized threshold and availability profile, refer Threshold and Availability. - Tags: Associate your monitor with predefined Tag(s) to help organize and manage your monitors creatively. Learn how to add Tags.
- IT Automation: Select an automation to be executed when the website is down/trouble/up/any status change/any attribute change. The defined action gets executed when there is a state change and selected user groups are alerted.
To automate corrective actions on failure, refer IT Automation.
If you want to get notified when there is any change in the query records, you can enable the check box next to Notify when the records are modified, in the Edit Threshold Profile page.
- Threshold and Availability: Select a threshold profile from the drop down list or choose the default threshold set available and get notified when the resources cross the configured threshold and availability.
- Alert Settings:
- User Alert Group: Select the user group that need to be alerted during a outage. To add multiple users in a group, see User Groups.
- On-Call Schedule: The On-Call Schedule option helps you to ensure that the notifications are sent to assignees in specific shift hours helping them to quickly respond to alerts or incidents. Choose an On-Call of your preference from the drop-down.
- Notification Profile: Choose a notification profile from the drop down list or select the default profile available. Notification profile helps to configure when and who needs to be notified in case of downtime. Refer Notification Profile to create a customized notification profile.
NoteYou can receive alerts if the monitors are associated to user groups irrespective of the On-Call shift you've configured.
- Third-Party Integrations: Associate your monitor with a pre-configured third-party service. It lets you push your monitor alarms to selected services and facilitate improved incident management.
NoteIf you haven't setup any integrations yet, navigate across to Admin > Third-Party Integrations to create one. Tell me more.
- Click Save.
NoteOnce the monitor setup is completed, Site24x7 deep discovery wizard scans your domain and auto detects all related internet resources for your domain that can be added to your account for a comprehensive internet services monitoring. Explore more about internet services deep discovery.
Learn more about the various performance metrics of a DNS Server monitor. To understand the distinction between various website monitoring features, read more.
