Burstable Bandwidth report
The Burstable Bandwidth report analyzes traffic spikes to track bandwidth usage, optimize network performance, and control costs. It helps identify the 95th percentile values for In Traffic, Out Traffic, and Total Traffic in a high availability (HA) setup.
Use case: 95th percentile in an HA network setup
Consider an organization that uses two core switches (SW01 and SW02) in an HA setup, where only one handles traffic at a time. In one month, its ISP reports a 95th percentile outbound traffic of 1.27Gbps, exceeding its 1Gbps plan.
Using consolidated data from both interfaces (taking the higher value when both are active), the 95th percentile is calculated based on sorted traffic records. The result prompts the ISP to recommend upgrading to a 2Gbps plan to avoid overage charges and maintain performance.
How it works
In an HA setup, only one interface actively carries traffic at a time. Here's how Site24x7 determines the 95th percentile bandwidth:
Step 1: Collect bandwidth data
Consider two switches, SW01 and SW02. First, the tool gathers all recorded traffic data for the month from both switches, separately capturing:
- SW01 In Traffic and Out Traffic
- SW02 In Traffic and Out Traffic
Step 2: Consolidate bandwidth data
For each recorded timestamp:
- If SW01 IN = 0, SW02 IN is the consolidated IN value.
- If SW01 OUT = 0, SW02 OUT is the consolidated OUT value.
- If both switches have values for In Traffic, the tool takes the greater of the two.
- If both switches have values for Out Traffic, it takes the greater of the two.
- If both switches report zero traffic (IN = 0, OUT = 0), it keeps the value as zero.
Step 3: Arranging the data in descending order
Now, there are two consolidated data sets:
- In Traffic values (sorted in descending order)
- Out Traffic values (sorted in descending order)
Step 4: Apply the 95th percentile formula
The 95th percentile is calculated using:
95th percentile = (N×0.05) + 1
Where N = Total number of records in the consolidated dataset.
Step 5: Determine the Burstable Bandwidth
- The selected value from Step 4 represents the Burstable Bandwidth (95th percentile value) for the HA network interfaces.
- This is the threshold beyond which only 5% of the highest spikes occurred.
How calculating Burstable Bandwidth helps
- Know if the interface is underutilized or experiencing congestion.
- Identify whether bandwidth spikes are frequent or occasional.
- Identify patterns of network activity and potential bottlenecks.
- Enable IT teams to optimize QoS policies and adjust capacity based on actual usage.
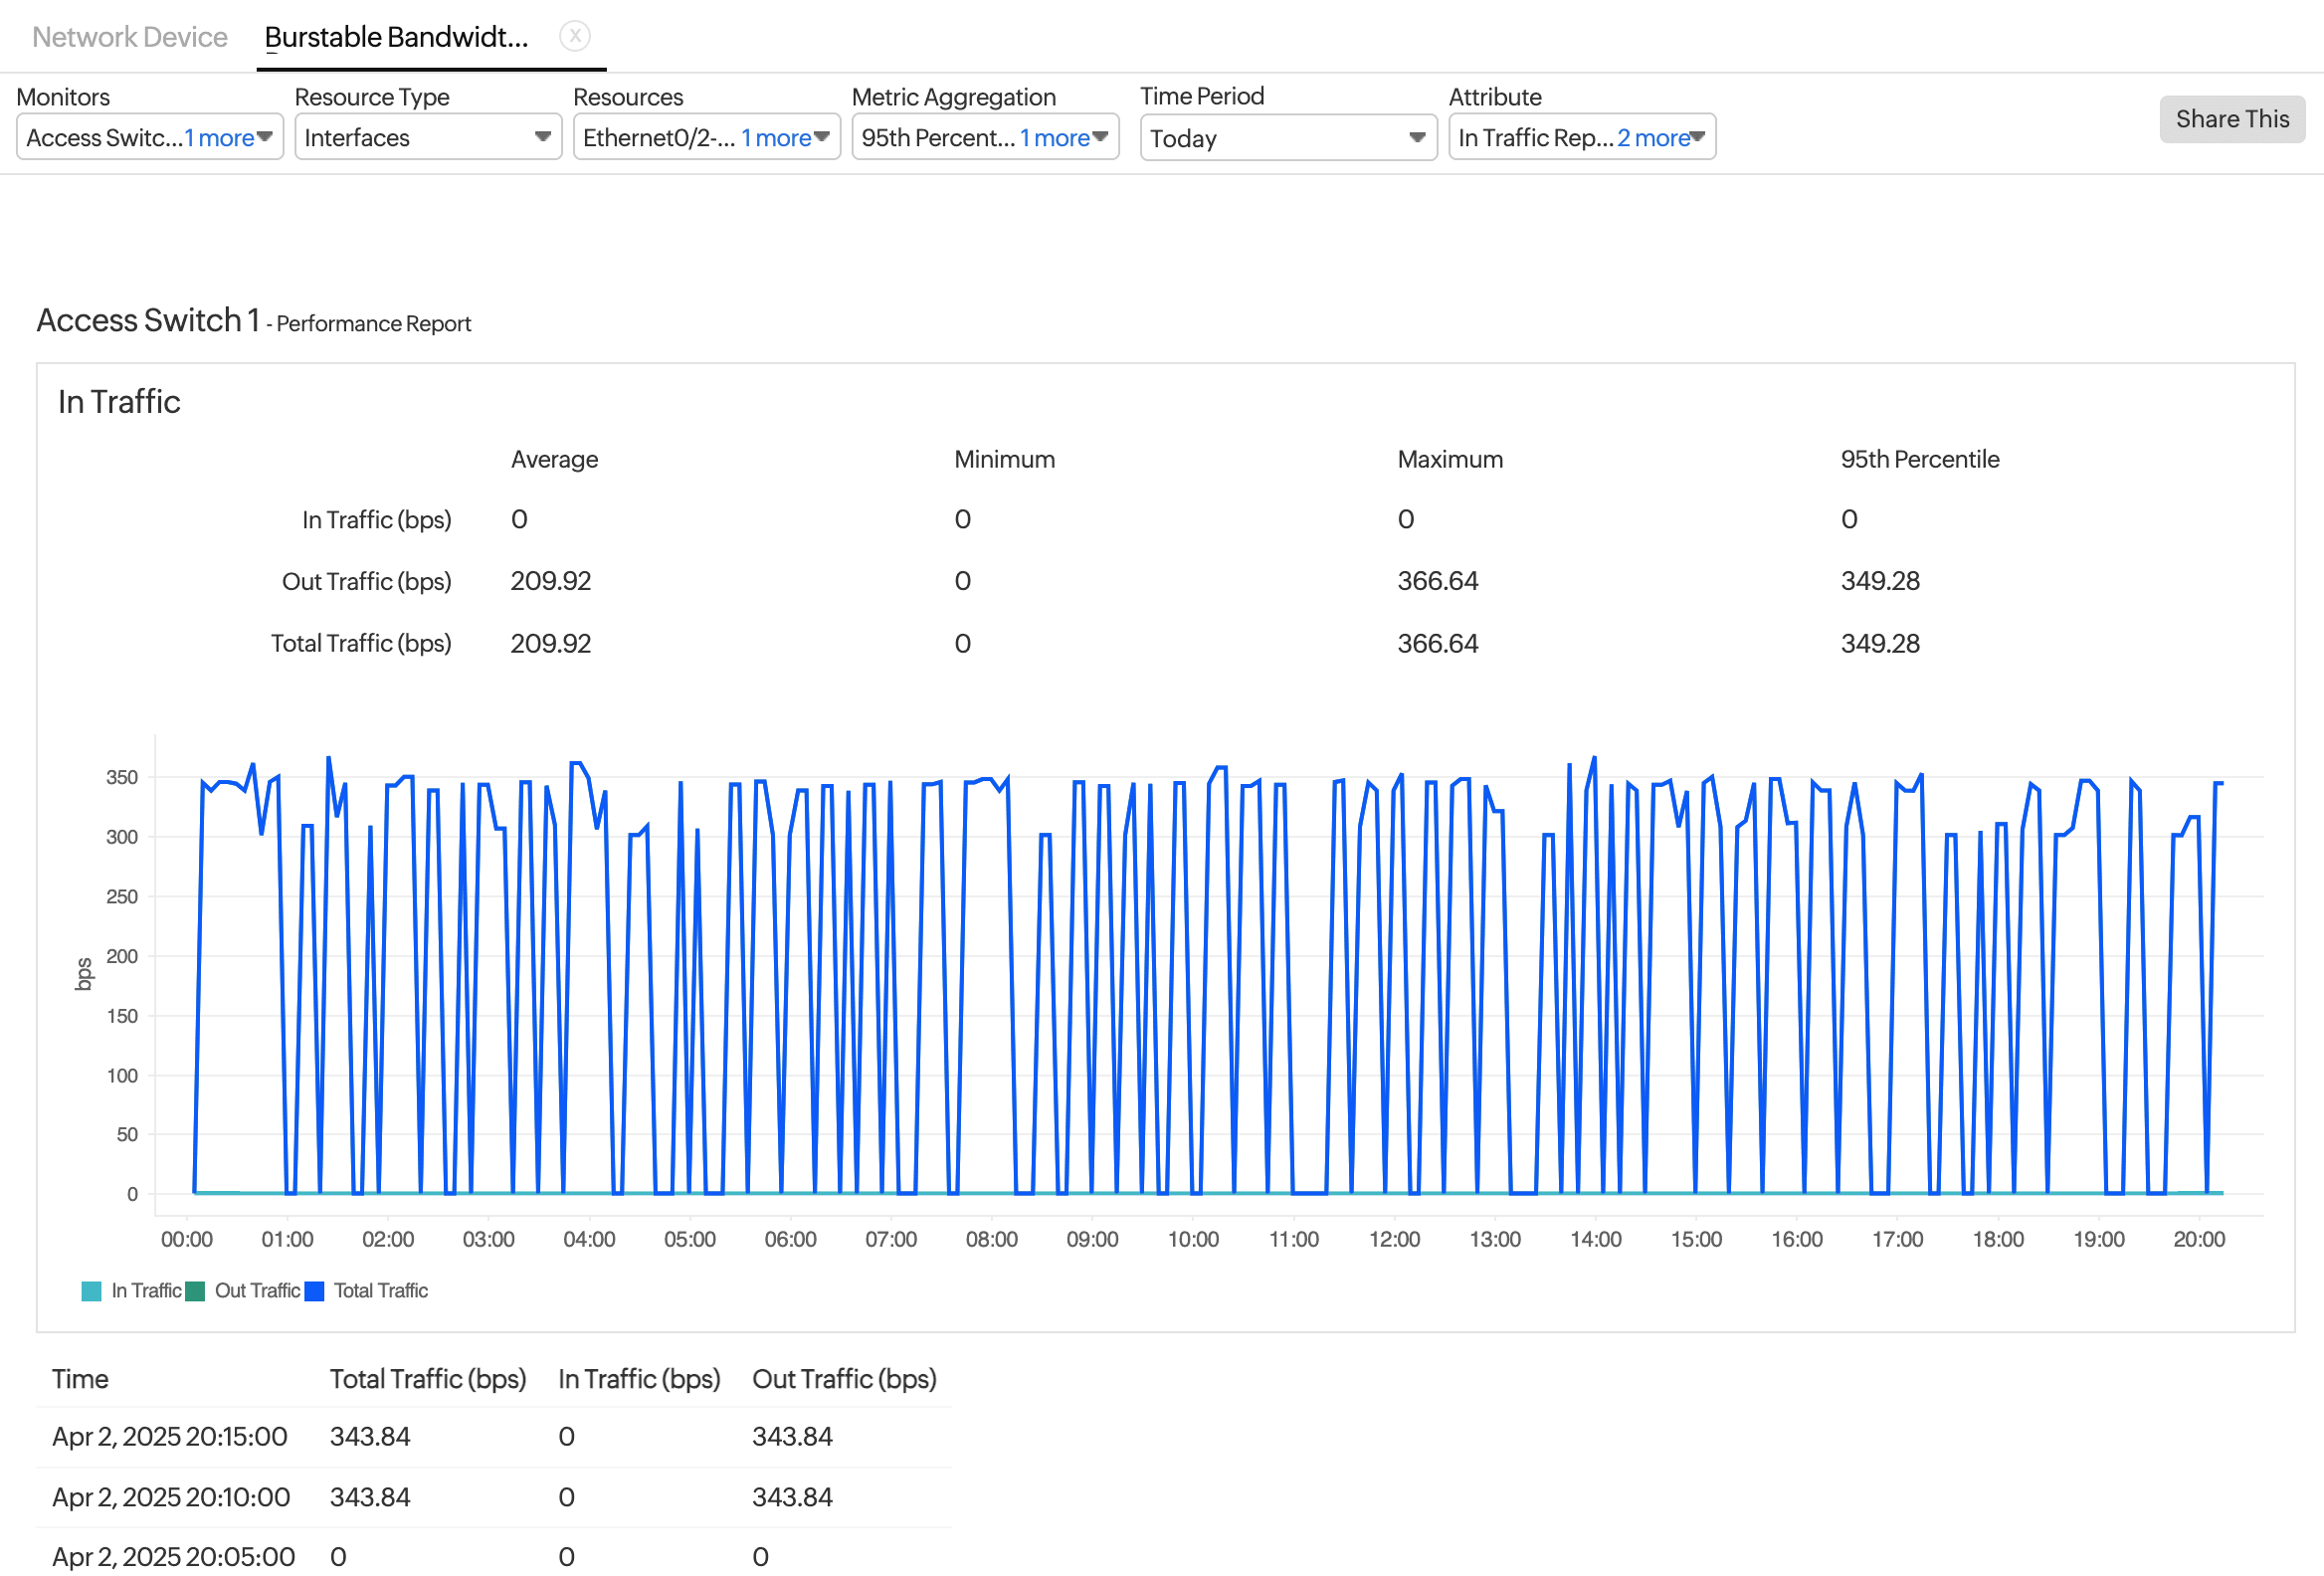
Generating the Burstable Bandwidth report
- Log in to your Site24x7 account.
- Navigate to Reports, search for Network Device > Burstable Bandwidth Report.
- Change the listed parameters to view a customized report:
- Select the required Monitor from the Monitors drop-down menu.
Note Selection is limited to two monitors. - Select Interfaces in the Resource Type drop-down menu.
- Select the required interfaces in the Resources drop-down menu.
NoteSelection is limited to two interfaces.
- Next, select the Time Period.
- In the Attribute field, select In Traffic Report, Out Traffic Report, and Total Traffic, as needed.
- Select the required Monitor from the Monitors drop-down menu.
- To share the report, click the Share This button in the top-right corner to Export CSV, Export PDF, Email, or Schedule Report.