Outage Report
Get a detailed view of why a resource is unavailable, including downtime events such as Down, Trouble, and Critical states, using the Outage Report. It explains when an outage occurred, how long it lasted, and why it happened, all in one place.
The Outage Report simplifies troubleshooting availability issues, validating SLAs, analyzing recurring failures, and sharing outage details with internal teams or stakeholders. By applying filters such as monitor, time period, location, and status, you can quickly narrow down outages that matter most and take informed, corrective actions.
Use cases
- When a monitor experiences repeated downtime, use the Outage Report to review past outages, compare durations, identify patterns, and pinpoint recurring causes.
- During troubleshooting, your team can avoid duplicate efforts by quickly reviewing outage reasons and recent comments from previously resolved incidents.
- If users report issues from specific geographies, filter outages by monitoring location to determine whether the problem is localized or global, helping you distinguish between network issues, ISP-related outages, or regional infrastructure failures.
- Keep customers informed and build transparency by sharing Outage Reports that provide a clear historical record of service availability.
Generate an Outage Report
- Log in to Site24x7.
- Navigate to Reports > Monitor Groups > Outage Report.
- If it is for all monitors, navigate to Reports > select the monitor type > All Monitors > Outage Report.
NoteWhen a specific monitor type is selected, All Monitors displays only monitors of that type. To access Outage Reports for all monitors at the account level, navigate through Monitor Groups.
- Select the required monitor from the header drop-down and change the listed parameters to view a customized report.
- Monitors/Tags: Select the desired monitor or tag from the drop-down list.
- Time Period: Select the desired time period. When the Time Period is selected as Custom Period, select the Date Range.
- Locations: Select the desired geographical location from the list of available locations.
- Status: Filter outages by one or more availability state, such as Down, Trouble, Critical, or Maintenance.
- Once the report is generated, click Ask Zia to get AI-driven insights such as a summary or pattern identification.
- To share the report, click Share This in the top-right corner.
- Publish Report: Click to publish the report and populate the form. This creates a permalink that will make the report accessible to customers without a login.
- Email: Share the report via an email. Emails can be sent to only those verified users who have agreed to receive emails from Site24x7.
- Export CSV: Export the report as a CSV file.
- Export PDF: Export the report as a PDF file.
- Schedule Report: Schedule the report to be sent as a summary email to the specified email address(es).
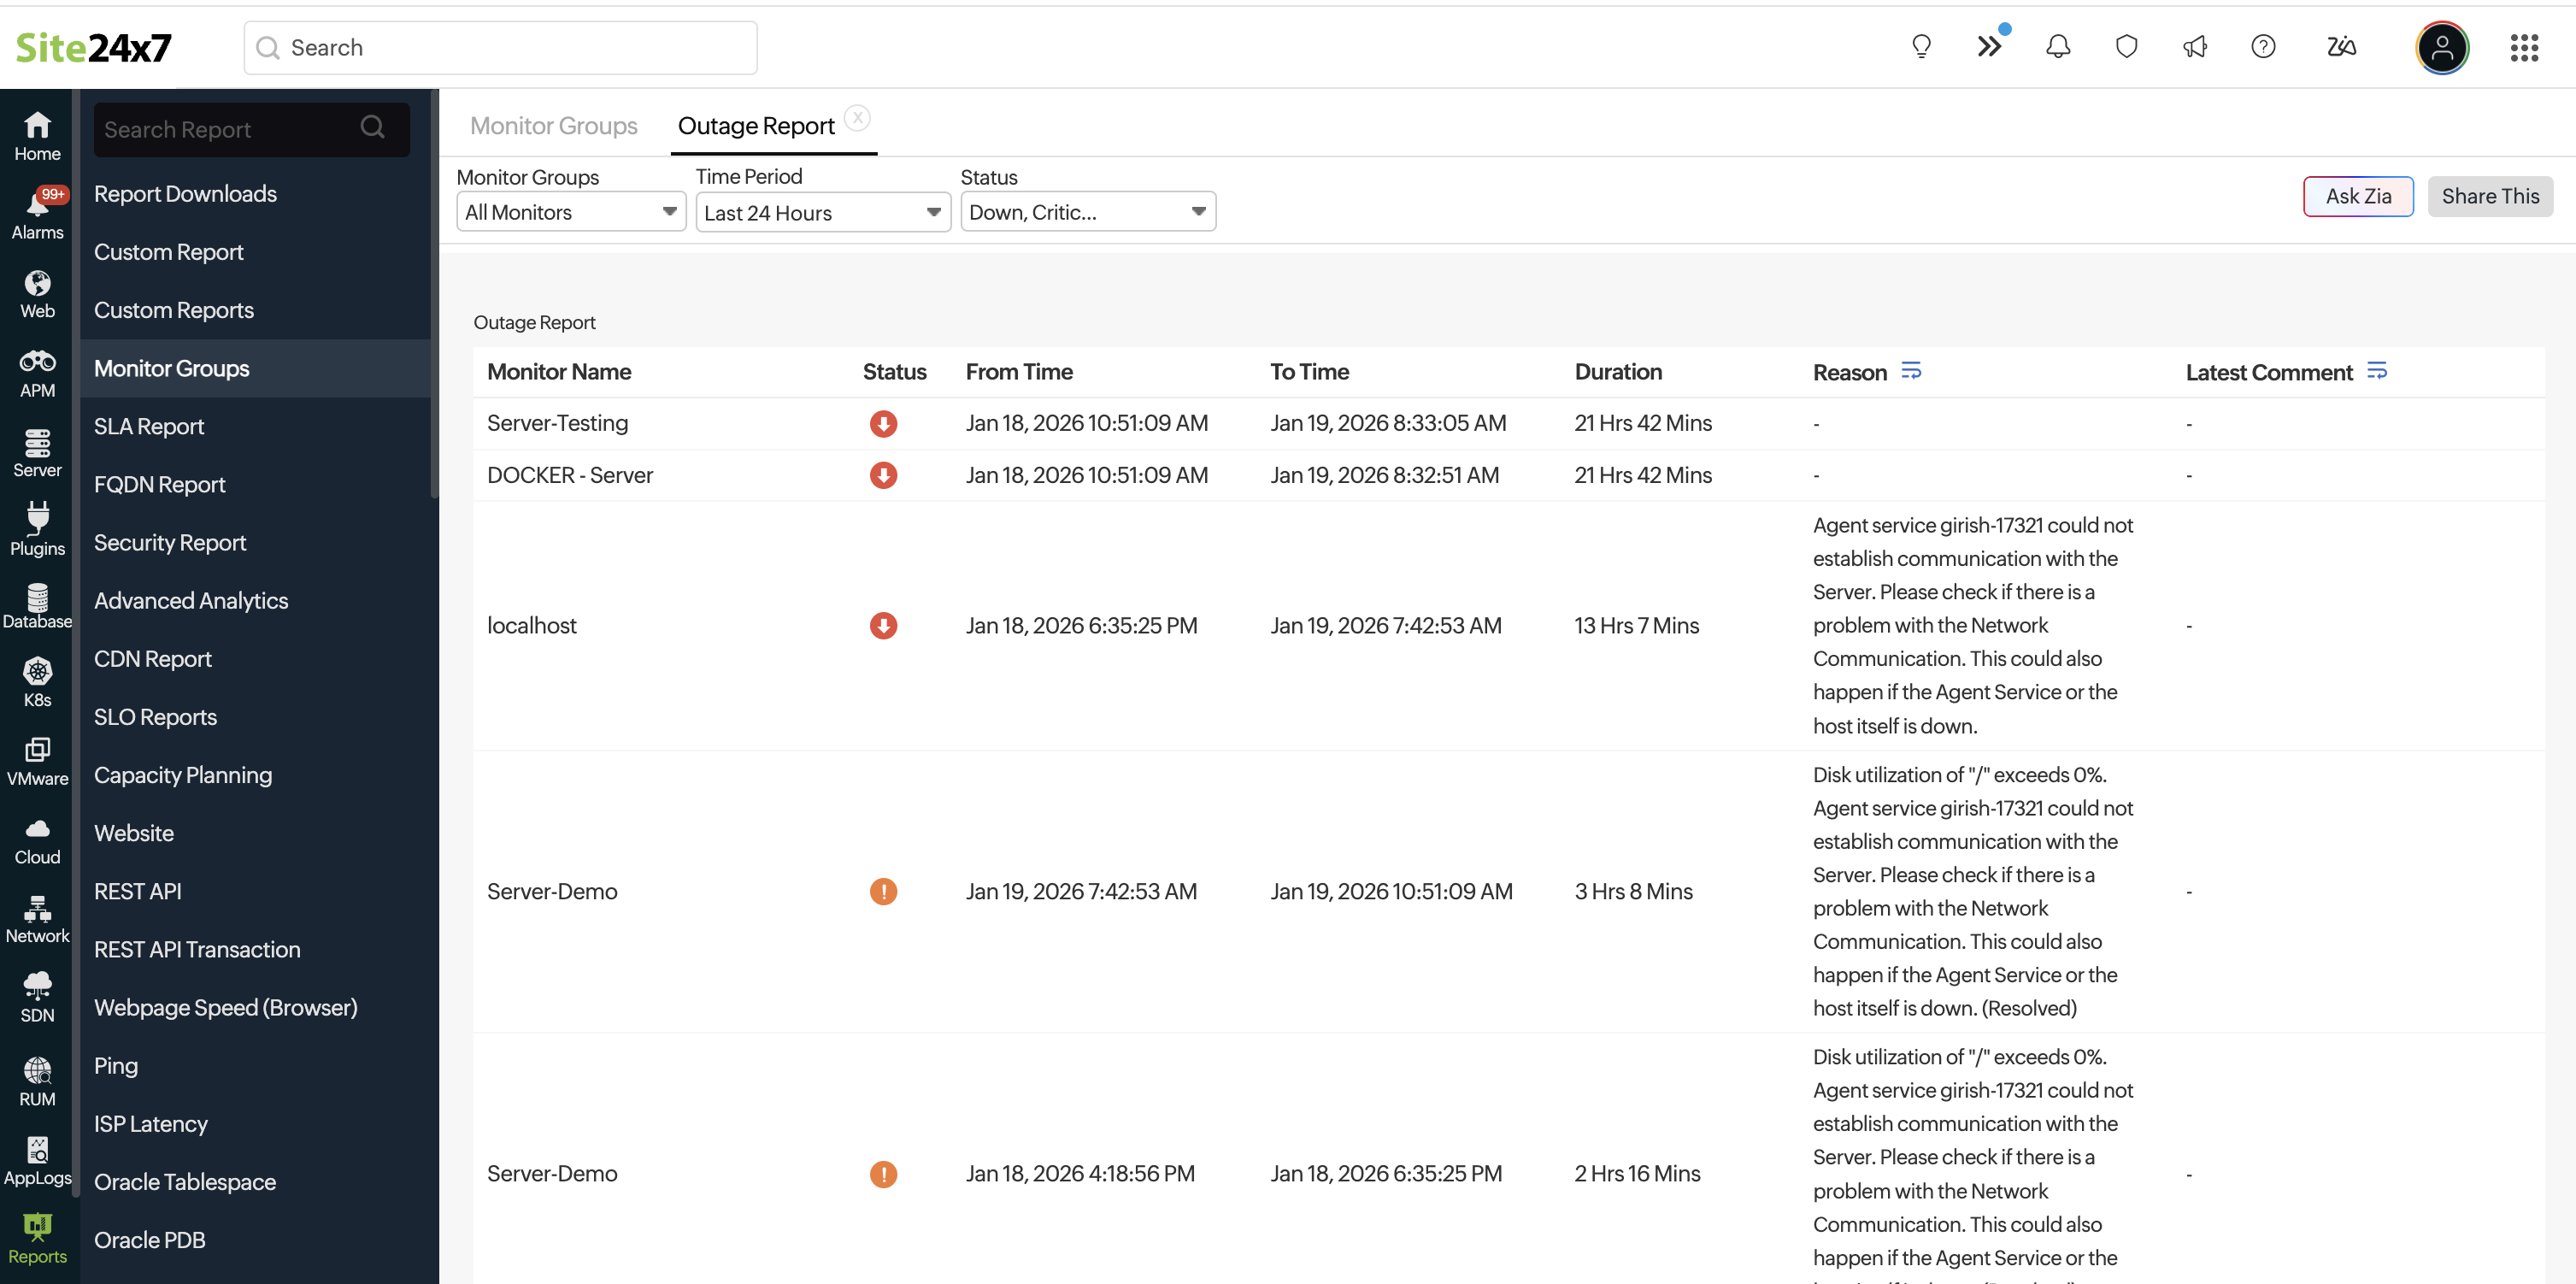
Interpreting the Outage Report
The Outage Report presents the following key outage details:
- Status: Displays the status of the monitor when the report is generated.
- From Time: Displays the time when the outage started.
- To Time: Displays the time when the outage ended.
- Duration: Displays the total time for which the outage lasted.
- Reason: Displays the possible reason for what caused the outage.
- Latest Comment: Displays the most recent comment added to the outage.