Custom SNMP Monitoring
Cisco, Aruba, HP, Fortinet—no matter what your device vendor is, Site24x7 can monitor any device and any attribute of that device. All you need is support for SNMP, and you can fully customize your monitoring.
Here is a video that demonstrates performance counters:
When is custom SNMP monitoring useful?
- If you'd like to monitor a device that Site24x7 hasn't added a device template for, you can create a custom device template.
- If you wish to monitor a parameter that isn't offered by default, like the power consumption in the past hour in kilowatt-hours for an uninterruptible power supply (UPS), you can create a custom performance counter.
- If you want to monitor exhaustive values of an attribute like the temperature of a Cisco device (including the temperatures of left and right inlets, outlets, fan, and more), we offer support for tabular performance counters, which monitor your tabular object identifiers (OIDs).
What are custom performance counters?
Custom performance counters are used to track special attributes that the user would like to monitor in addition to the basic performance metrics provided.
More on custom performance counters
You can also use custom performance counters to perform relevant mathematical operations using OIDs to monitor the values of your choice.
For example, if you want to monitor the memory utilization percentage of a Cisco router, the value can be obtained from the mathematical expression (A*100)/(A+B), where:
- A = .1.3.6.1.4.1.9.9.48.1.1.1.5.1 (this indicates the number of bytes from the memory pool that are currently in use by applications on the managed device).
- B = .1.3.6.1.4.1.9.9.48.1.1.1.6.1 (this indicates the number of bytes from the memory pool that are currently unused on the managed device for the processor).
The final expression will look like this:
(.1.3.6.1.4.1.9.9.48.1.1.1.5.1*100)/(.1.3.6.1.4.1.9.9.48.1.1.1.5.1+.1.3.6.1.4.1.9.9.48.1.1.1.6.1)
What are custom device templates?
Custom device templates are templates created by users. They can edit one of the over 11,000 default device templates or add new templates.
What are the requisites for custom SNMP monitoring?
Your devices are expected to have basic SNMP support so you can customize your monitoring. You'll need the SNMP OIDs or system object identifiers (sysOIDs) to monitor new attributes using custom performance counters. You can find these SNMP OIDs from the MIB browser.
Adding custom device templates
If no preset template describes your device accurately, you can create a custom one that fits the device.
- Navigate to Network > Device Templates.
- On the Device Templates screen, click Add Device Template, located in the top-right corner, and enter the following details as shown in Figure 1.
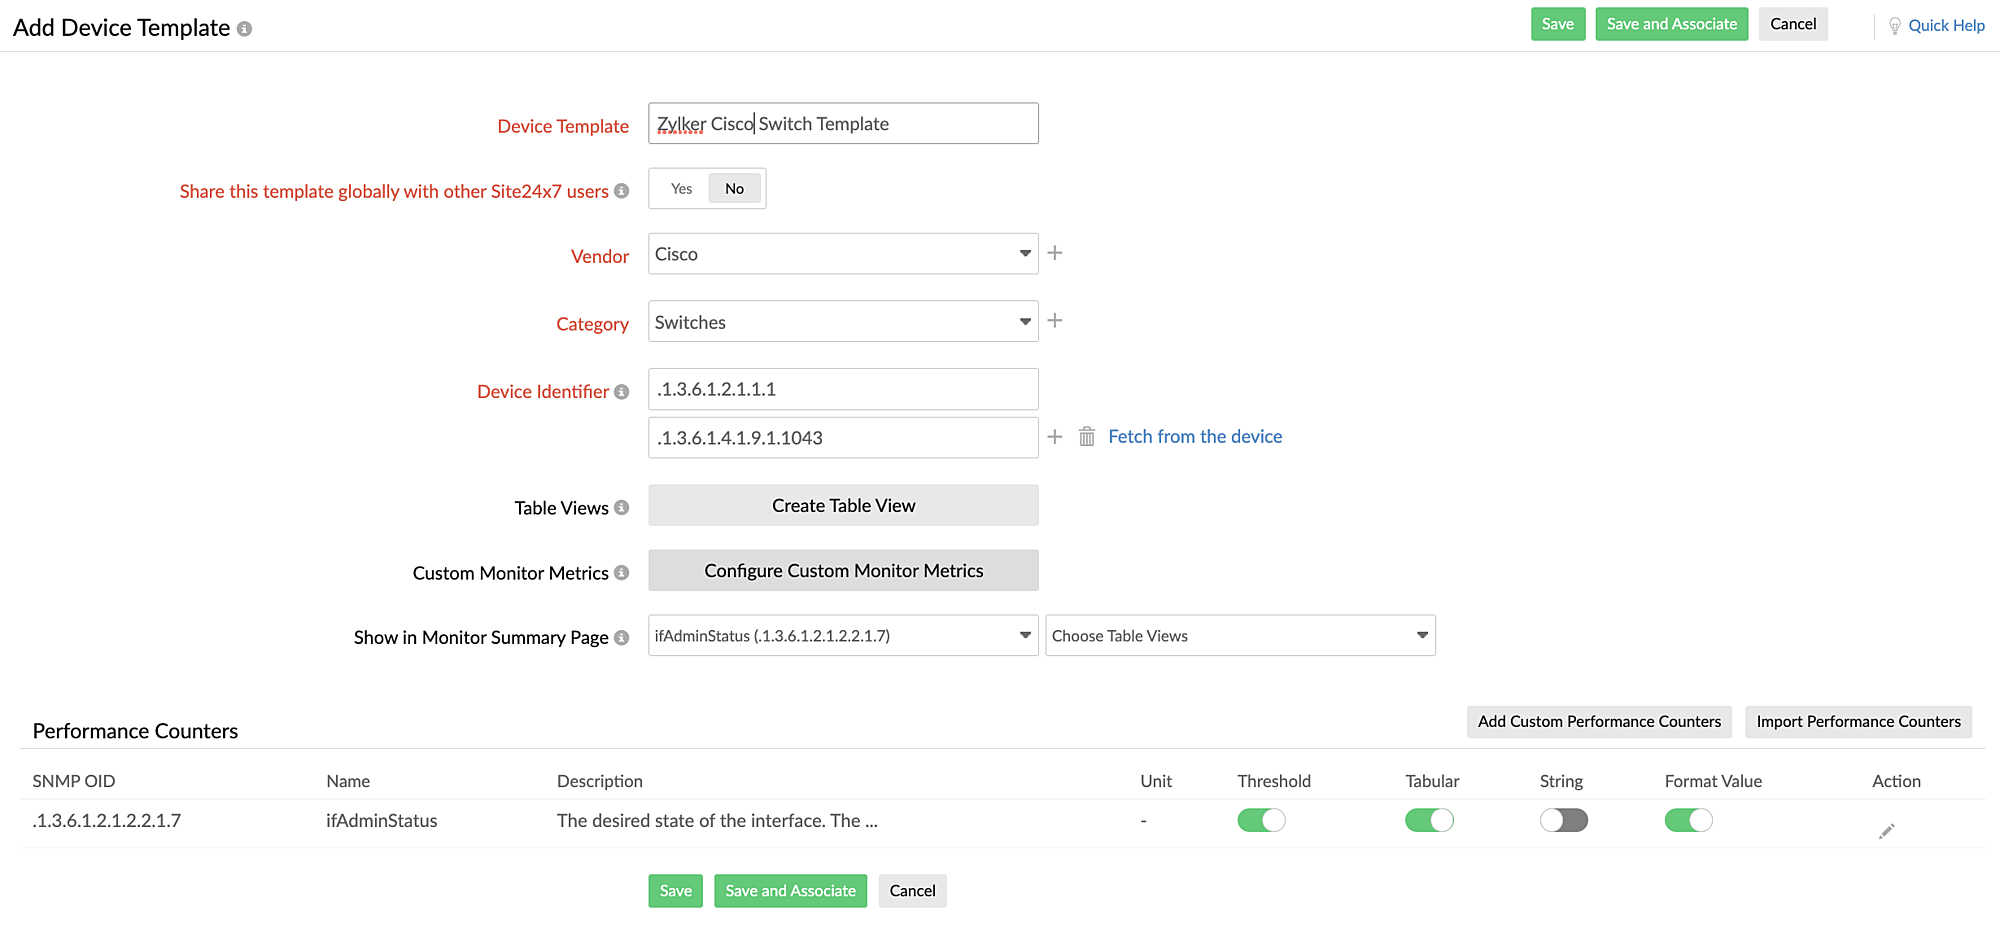
Figure 1. Adding a device template. - In the Device Template field, provide a name to identify the template.
- For the Share this template globally with other Site24x7 users option, select Yes if you wish to share your custom template with other Site24x7 users.
- For Vendor, select a vendor from the drop-down menu or add one by clicking +.
- For Category, select the category from the drop-down menu to which the device belongs.
- You can also add a new custom category by clicking +. In this case, you will have to add a Parent Category first, and then the Category will be a subtype of the parent.
NoteThe device will be classified based on the Category or the Parent Category. For instance, if you select Desktop, Server, or Domain Controller in the Category or the Parent Category, the device will be categorized as an agentless server. If you select any other option, the device will be categorized as a network device. - Device Identifier: Enter the sysOID.
- You can also click Fetch from device beside the field to fetch the details from the device. To do so, provide the device information as shown in Figure 2 and Figure 3.

Figure 2. Fetching the device identifier by providing the monitor name.
Figure 3. Fetching the device identifier by providing the IP address.
- You can also click Fetch from device beside the field to fetch the details from the device. To do so, provide the device information as shown in Figure 2 and Figure 3.
- Under Performance Counters, add or import performance counters.
- Click the Add Custom Performance Counters button to add custom performance counters.
- In the MIB BROWSER section, select GENERIC MIBS or CUSTOM MIBS.
- GENERIC MIBS: These management information bases (MIBs) are available by default in Site24x7. Select the Vendor and the MIB from the drop-down menus (Figure 4).
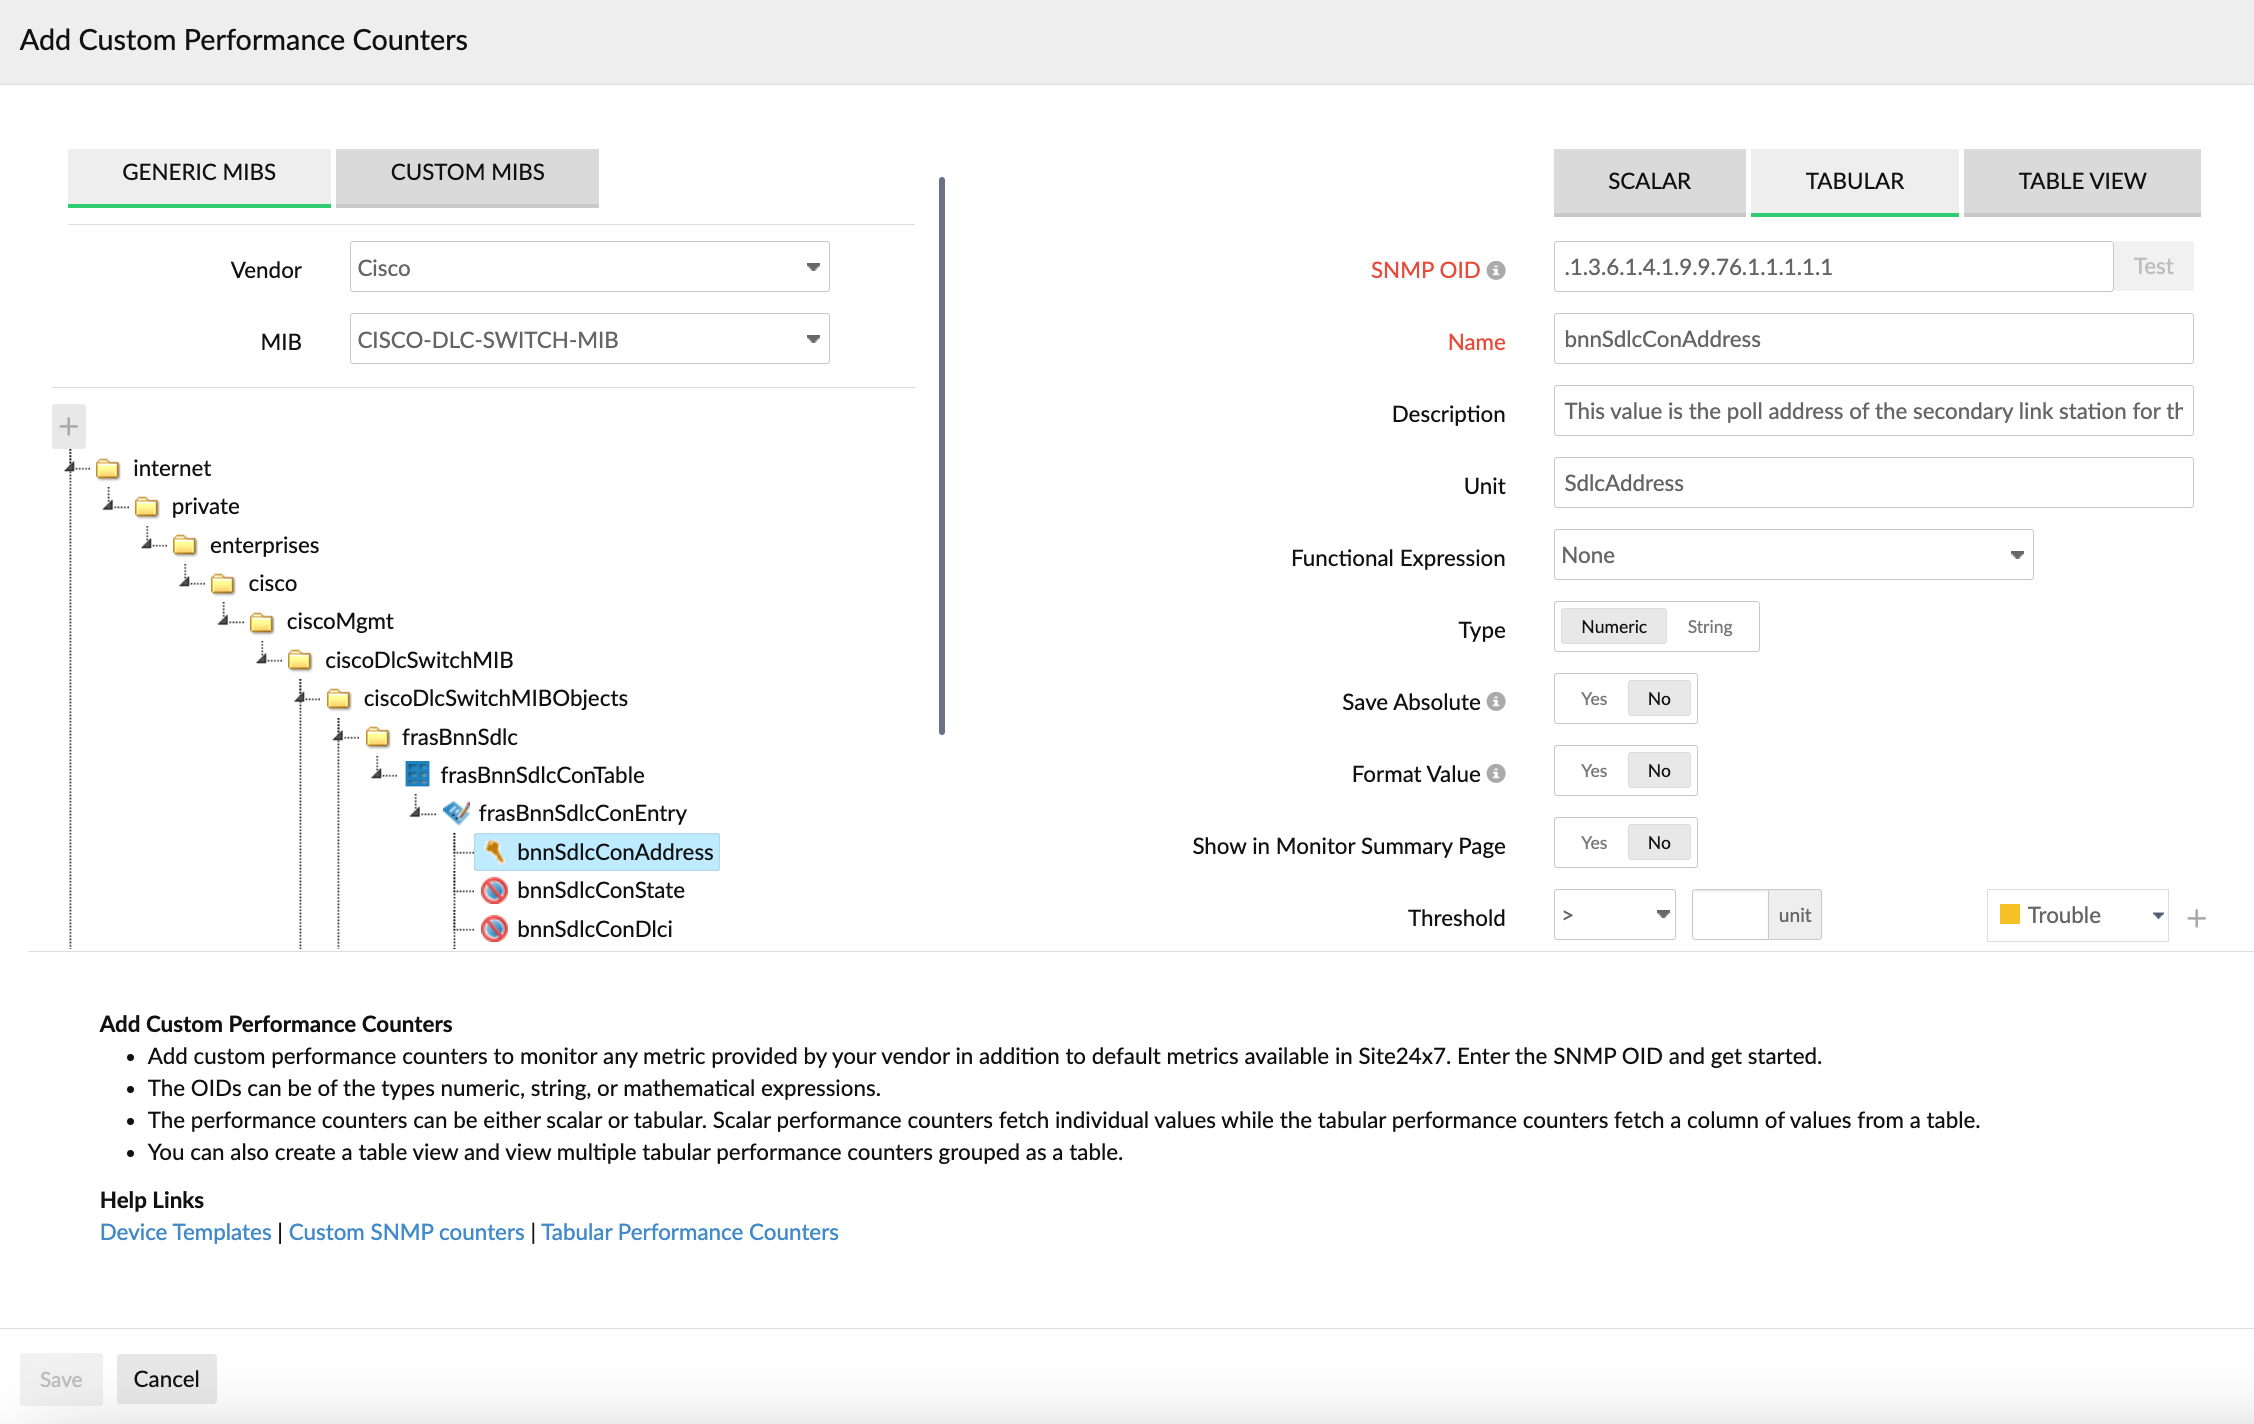
Figure 4. Selecting generic MIBs. - CUSTOM MIBS: You can upload MIBs from your system and use them to add custom performance counters.
- On-Premise Poller: Selecting an On-Premise Poller will list all the MIBs inside the folder Poller-home/NetworkPlus/mibs. Select the On-Premise Poller that stores the MIB files you have uploaded. If you select Recently Viewed, all the recently used MIBs will be shown.
- MIB: Select an already uploaded MIB from the drop-down menu.
NoteIf you click Upload MIB, select files and upload them from your computer on the Upload MIB screen (Figure 5). Also, select the On-Premise Poller that has to store the MIB files.

Figure 5. Uploading MIBs on the Upload MIB screen.NoteIf you click Delete MIB, you can select a MIB file that you wish to delete and click Delete.
- GENERIC MIBS: These management information bases (MIBs) are available by default in Site24x7. Select the Vendor and the MIB from the drop-down menus (Figure 4).
- The performance counters can be SCALAR, TABULAR, or in TABLE VIEW(you can view them as a table).
SCALAR
Any SNMP OID that returns a single (or scalar) value will be monitored as a scalar performance counter. Add scalar performance counters by entering the values for the SNMP OID, Name, Description, Unit, Functional Expression, Type, Save Absolute, Format Value, Show in Monitor Summary Page, and Threshold fields. You can enter them manually or use the built-in MIB browser.
TABULAR
Any SNMP OID that returns a list of values that belong to the same column of a table will be monitored as a tabular performance counter. Add tabular performance counters by entering the values for the SNMP OID, Name, Description, Unit, Functional Expression, Type, Save Absolute, Format Value, and Show in Monitor Summary Page fields. You can enter them manually or use the built-in MIB browser.
- Selecting a table on the MIB allows you to create a table view that includes all the corresponding tabular performance counters. Select Yes for the Show in Monitor Summary Page field if you wish to show the performance counters on the monitor summary page.
- For Unit, enter the unit of the performance counter to be displayed on the alerts.
- For Functional Expression, select an option from the drop-down menu to convert the performance counter value to the appropriate metric—for example, Bytes to kB (Figure 6).
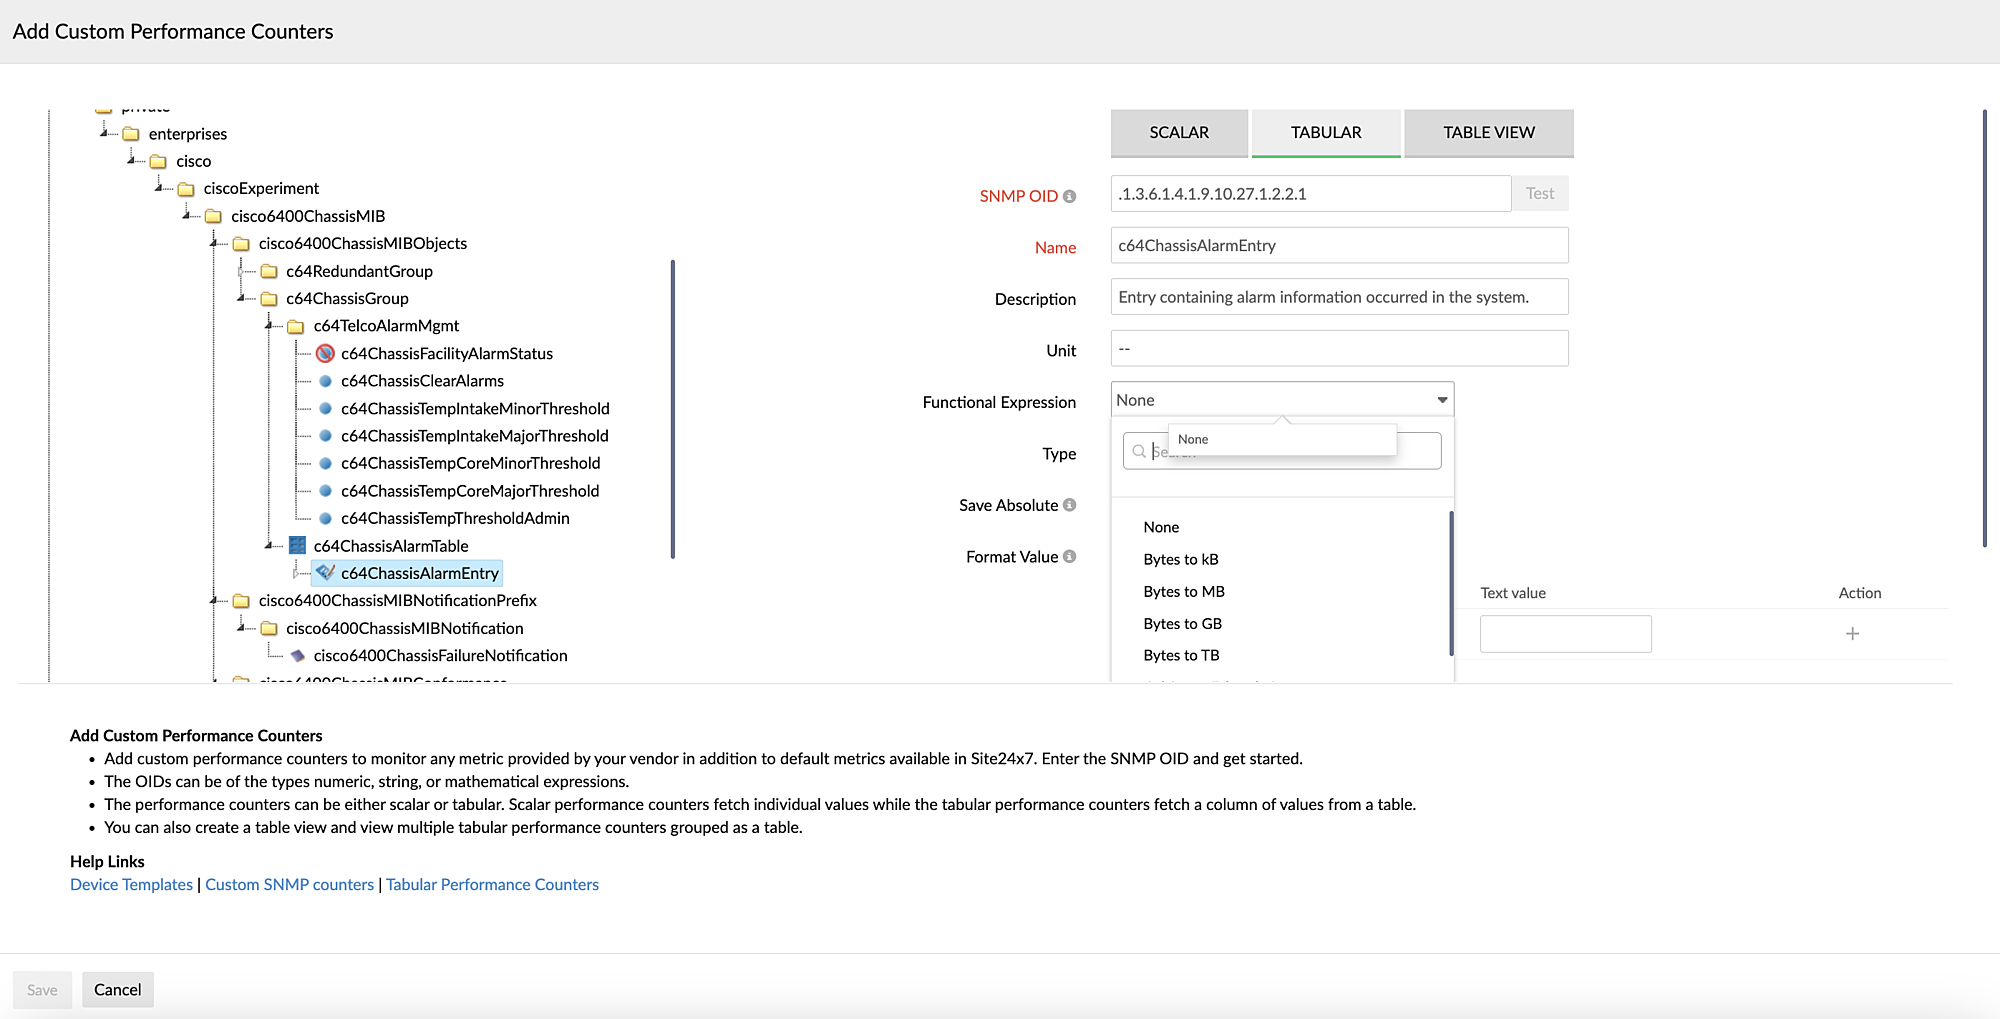
Figure 6. Selecting an option for Functional Expression. - For Type, select Numeric if the value fetched by the SNMP OID is numeric. Otherwise, select String. Please use the Test button (as explained in the Import Performance Counters subsection of this help doc) to verify the type of value returned (Figure 7, marked as 1).
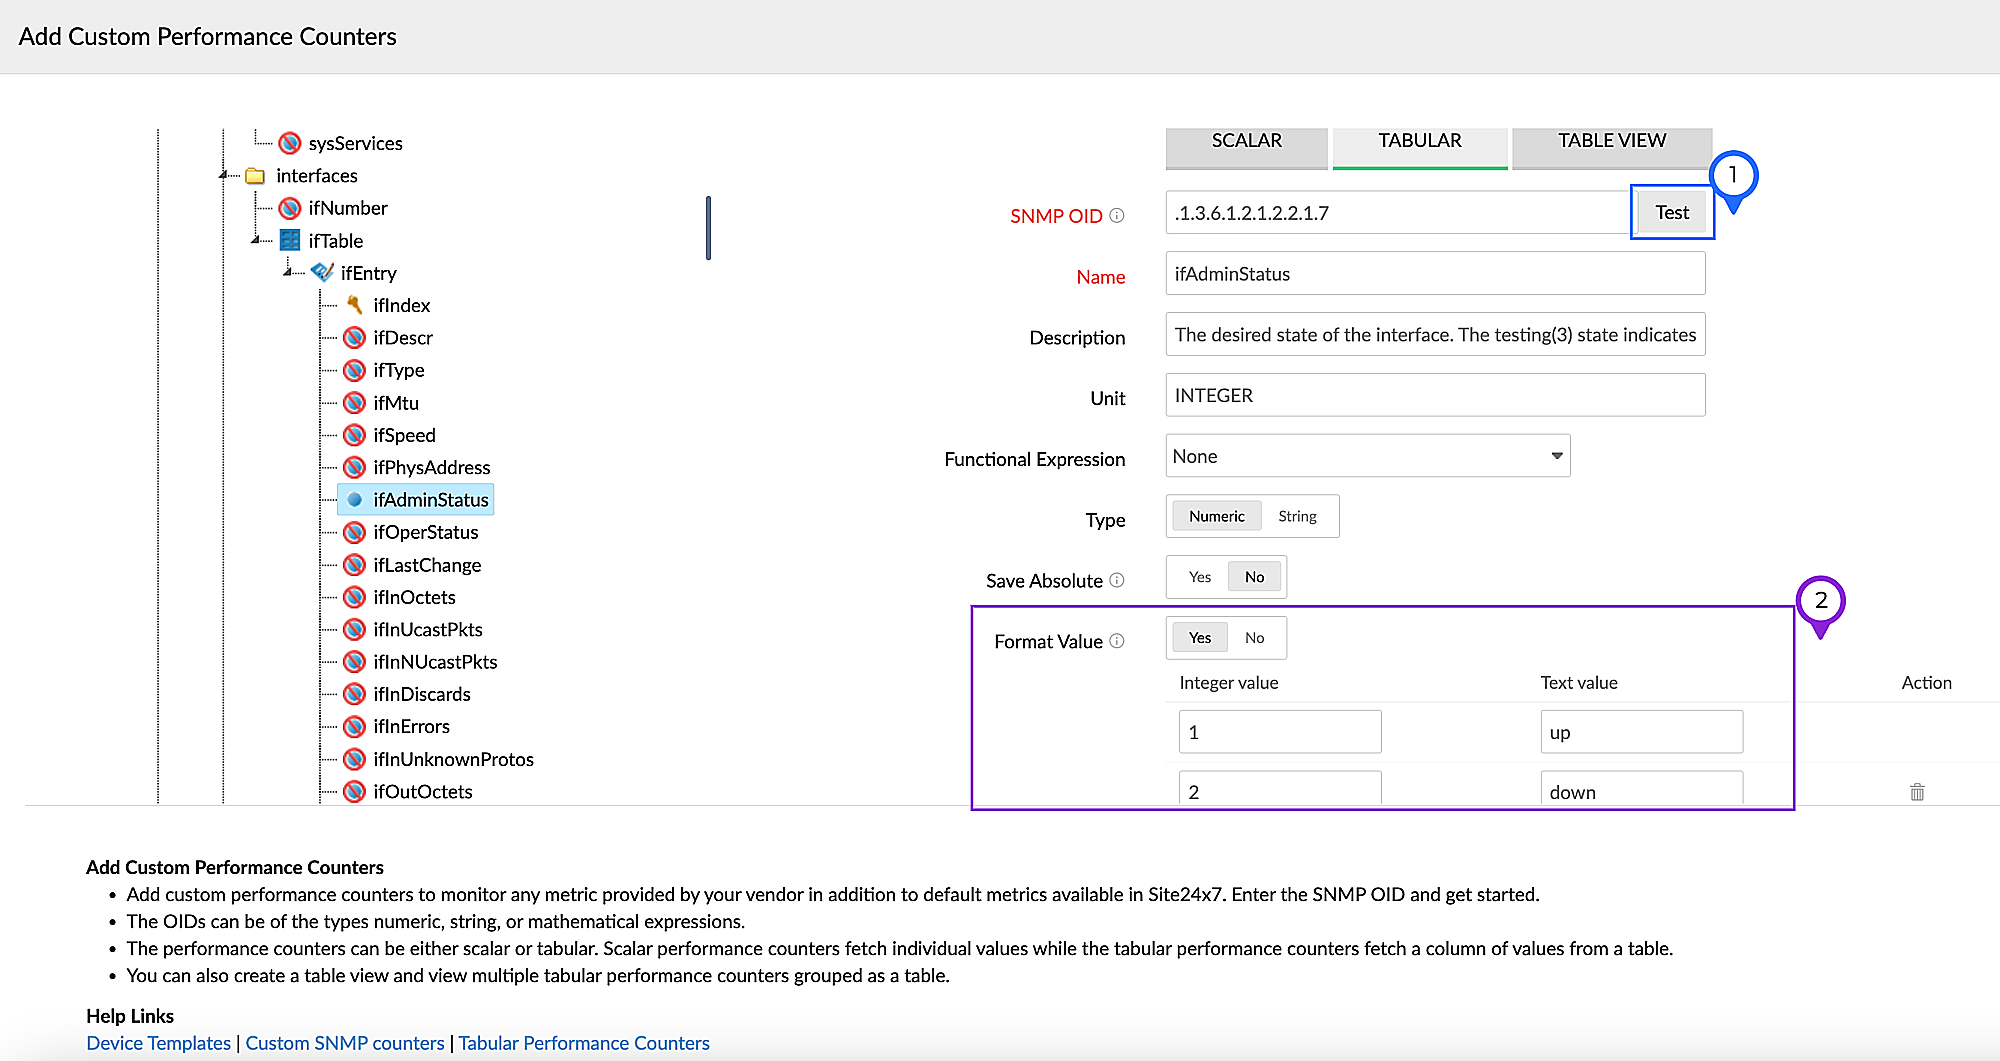
Figure 7. Adding tabular performance counters. -
Save Absolute
This option is available for scalar and tabular performance counters and is useful for OIDs that are like counters for a specific metric. A counter-type OID is an OID that keeps incrementing until its limit is reached. It then resets, and it continues to increase.
An example of this is ifInOctets (.1.3.6.1.2.1.2.2.1.10), which represents the total number of octets received on the interface. When queried, this OID will return the overall number of octets received in the particular interface. The value keeps increasing over time, as it is a counter. in each poll is displayed. Otherwise, the difference of the PDUs between each poll is indicated.
If you set Save Absolute to No for this OID, then the difference between the last two polls will be calculated and displayed as the value. However, if Save Absolute is set to Yes, then the absolute value will be displayed.
NoteIf the OID's Unit (or syntax in MIB file) is Counter, toggling to No fetches the value as the difference between the last two polls. Toggling to Yes gets the absolute value received in each poll.
If the OID's Unit (or syntax in MIB file) is Integer, toggling to Yes fetches the value as the difference between the last two polls. Toggling to No gets the absolute value received in each poll.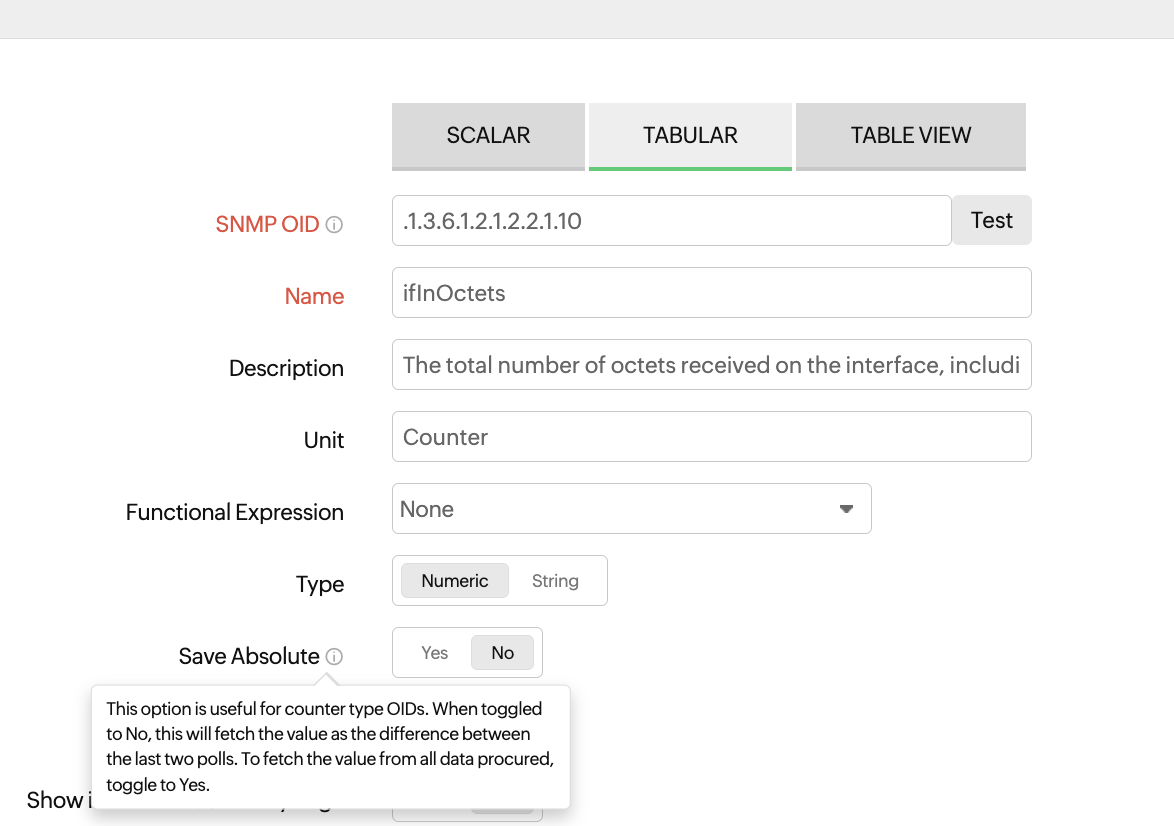
Figure 8. Save absolute for counter type performance counter.Consider two performance counters for the ifInOctets OID, with the Save Absolute value set to Yes for one and No for the other.
These are the actual SNMP query responses for the OID over 15 minutes.
03:00:00 - .1.3.6.1.2.1.2.2.1.10.1 -> 10000
03:05:00 - .1.3.6.1.2.1.2.2.1.10.1 -> 15000
03:10:00 - .1.3.6.1.2.1.2.2.1.10.1 -> 18000Value for the performance counter with Save Absolute set as Yes
03:00:00 -> 10000
03:05:00 -> 15000
03:10:00 -> 18000Value for the performance counter with Save Absolute set as No
03:00:00 -> No data (as there is no previous poll to calculate the difference)
03:05:00 -> 5000
03:10:00 -> 3000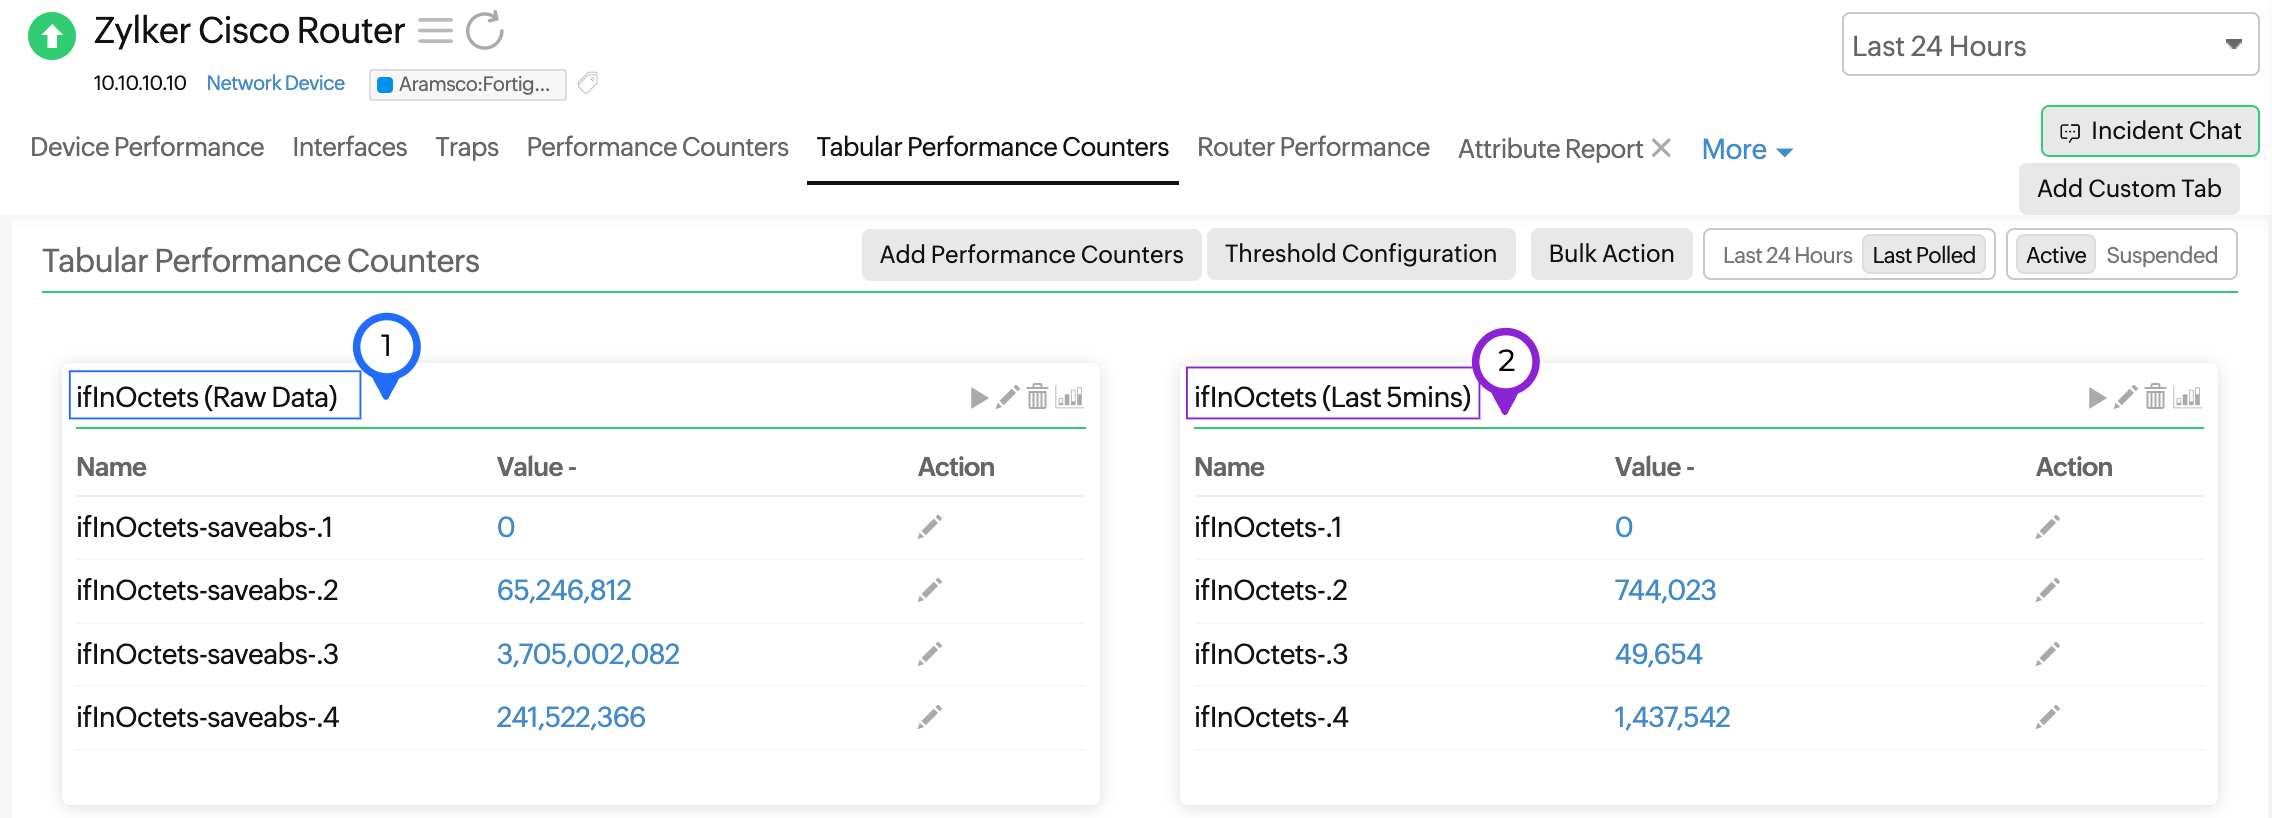
Figure 9. Value difference based on Save Absolute. - For Format Value, toggle to Yes to be able to provide a meaningful description for an integer value. For instance, if the admin status is returned as a numerical value, then the display value can be provided as Up or Down instead of showing the number in the alert message (Figure 7, marked as 2).
- For Show in Monitor Summary Page, toggle to Yes to be able to view the performance counters that will be displayed on the monitor summary page.
- For Threshold, use the drop-down to enable alerts on any breach of predefined conditions that you set.
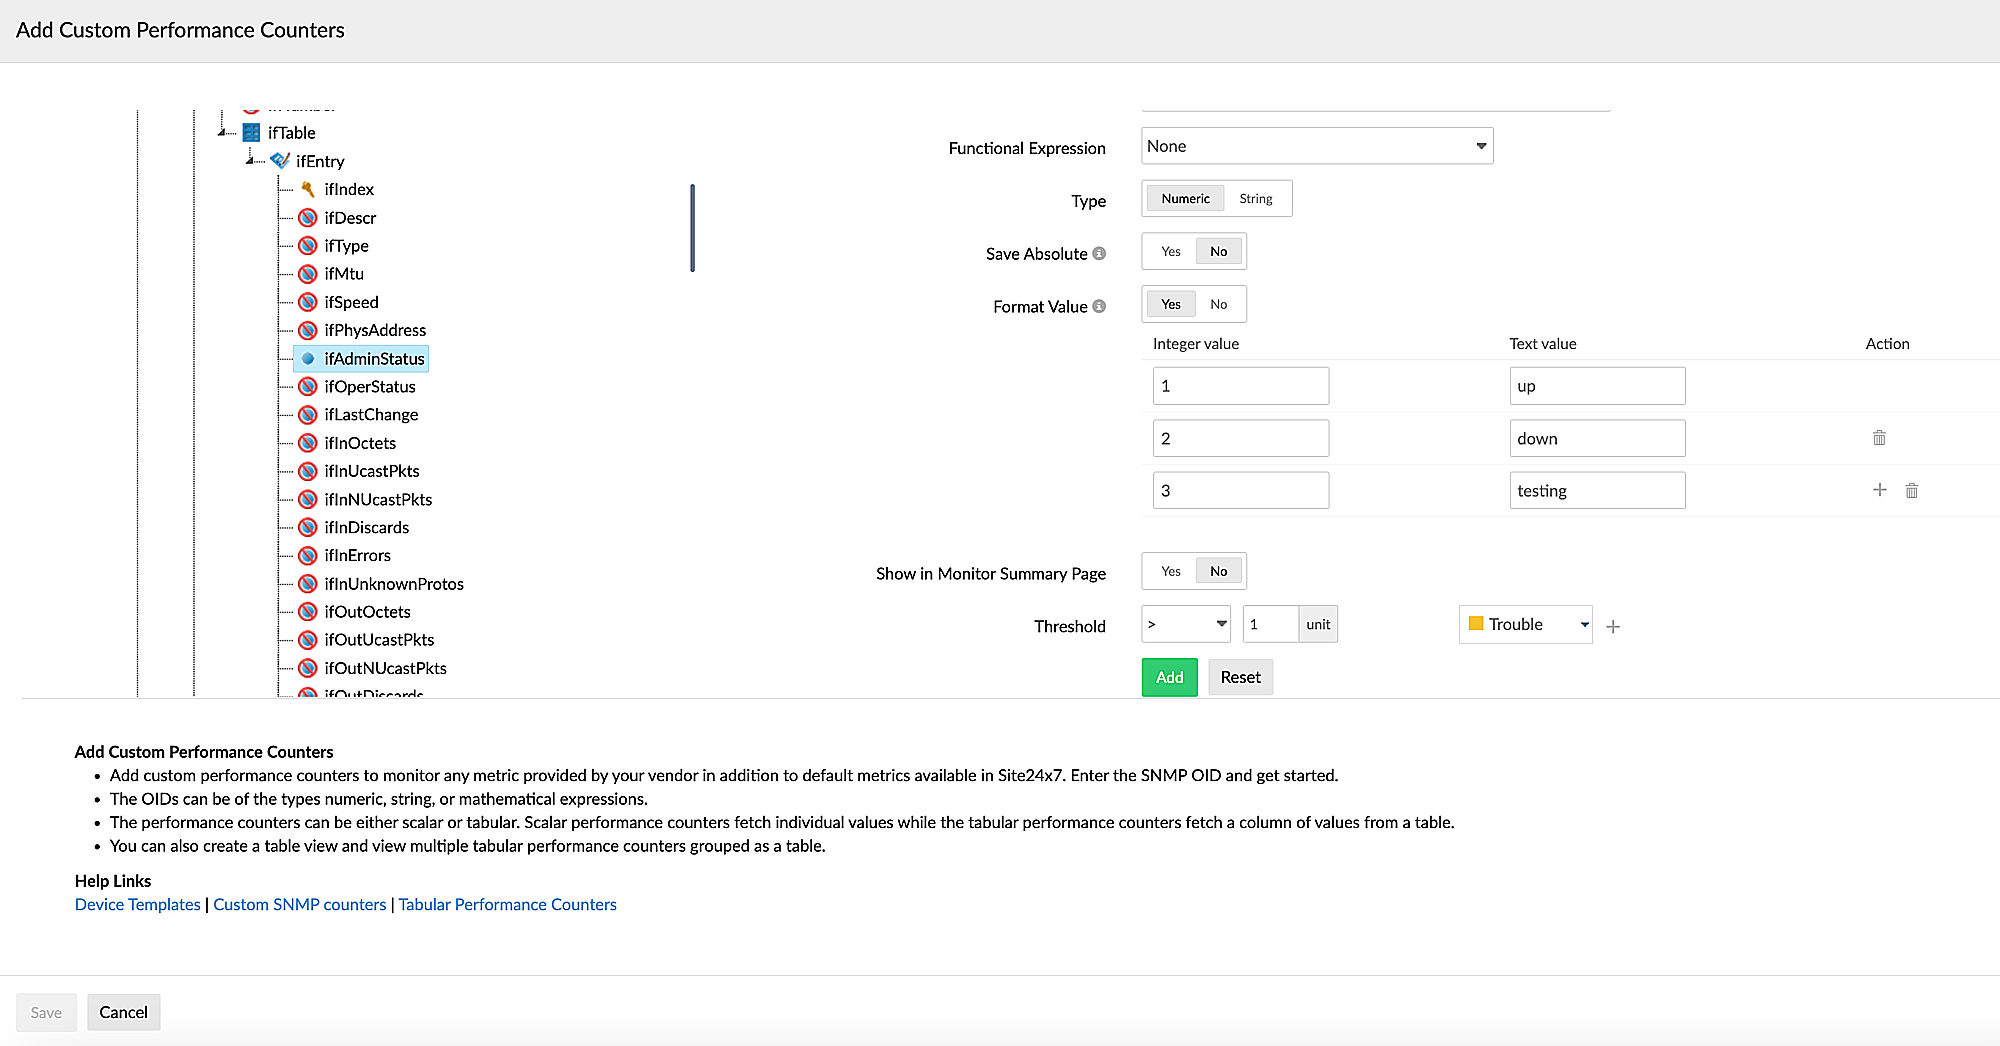
Figure 10. Setting thresholds in Add Custom Performance Counters pop-up.
TABLE VIEW
Click the TABLE VIEW button to display selected performance counters as a table. Provide a name and select the tabular performance counters to be displayed as individual columns in a table. You can also select a table directly from the MIB and view it here.
- For Show in Monitor Summary Page, toggle to Yes to choose if the performance counter has to be displayed on the monitor summary page.
- For Show Index Column, toggle to Yes to show the index column on the Tabular Performance Counters screen.
- In the Tabular Performance Counters section, select Add to Table View to view the performance counter on the table view or select the record if it is not required on the view.
NoteA table can contain a maximum of nine columns. The rest of the selected counters will be added as individual tables.- Column of the Table View to be displayed in the Alert: Choose a column name to include in the alerts generated so that you'll obtain a clear picture of which tabular performance counter in the table has generated alert.
E.g., consider a Table View with two tabular performance counters (columns): Sensor Failures and Sensor Description. If you choose the column Sensor Description, then your alert will be: Sensor Failures-.3 for (Power Supply 2 Sensor) exceeds 5 units.
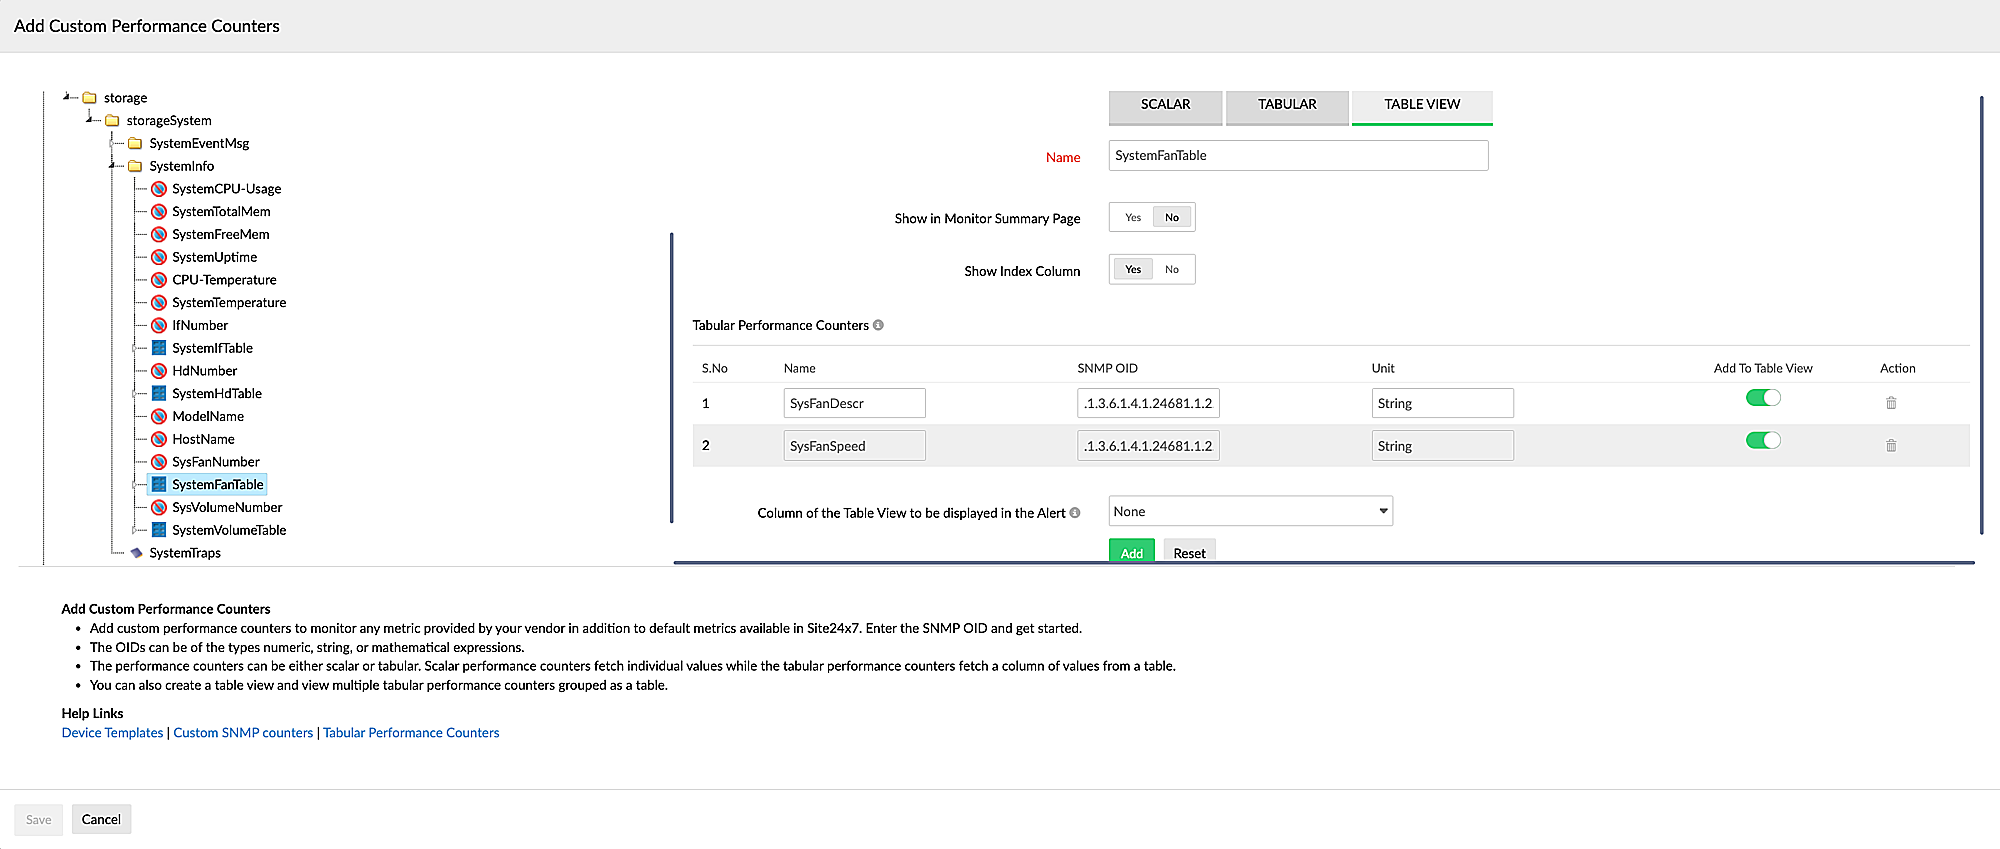
Figure 11. Adding Custom Performance Counters in Table View.
- Column of the Table View to be displayed in the Alert: Choose a column name to include in the alerts generated so that you'll obtain a clear picture of which tabular performance counter in the table has generated alert.
- Click Add. Then click Save.
- In the MIB BROWSER section, select GENERIC MIBS or CUSTOM MIBS.
Import Performance Counters
Click the Import Performance Counters button to import the performance counters available in other device templates.
- Select the performance counter you want to import from Generic, Custom, or Global templates on the Import Performance Counters screen. Then click Import. The performance counter will be added to the device template.
- To verify that the performance counter can fetch data for your device, click the pencil icon
 beside it.
 - Click Test beside the SNMP OID field on the Edit Custom Performance Counter screen.
- On the Test Performance Counter screen, select an option for Test using.
- If you select Monitor Name(Figure 12):
- Select an option for Monitor Name from the drop-down menu.
- Select the credential in the Credential Name field.
- Verify the SNMP OID and the Type of the performance counter.
- Click Test.

Figure 12. Testing a performance counter with the monitor name.
- If you select IP address(Figure 13):
- Enter the value in the IP address field.
- Select the correct On-Premise Poller.
- Select the credential in the Credential Name field.
- Verify the SNMP OID and the Type of the performance counter.
- Click Test.

Figure 13. Testing a performance counter with the IP address.
- If you select Monitor Name(Figure 12):
- Click the Add Custom Performance Counters button to add custom performance counters.
- Table views allow you to view consolidated tables of the tabular performance counters you added while adding custom performance counters. If you haven't created one yet, you can create an all-new table view by clicking the Create Table Views button (Figure 1).
- Beside the Custom Monitor Metrics field, click Configure Custom Monitor Metrics to configure monitor-level metrics for your device type by providing a custom performance counter. On the Custom Monitor Metrics screen, select the custom metrics for the performance counters of CPU Utilization, Memory Utilization, Manufacturer, Serial Number, Model Name, and System Uptime (hours) from the drop-down menus (Figure 14). You can also click the Test button for each to see if the correct value is fetched before adding it.

Figure 10. Configuring custom monitor metrics.NoteCPU Utilization and Memory Utilization can only be numeric values, while the rest can be either numeric or a string. - For Show in Monitor Summary Page, toggle to Yes to view the performance counters that will be displayed on the monitor summary page. If needed, you can select and add more performance counters to appear on the page.
- Edit or delete performance counters from the Performance Counters section. The Threshold and Format Value columns display if the parameters are available for the performance counters. The Tabular and String columns show the performance counter is of that type.
- Click Save to save the custom template. Click Save and Associate to associate the template with a set of network devices.
NoteYou can also create custom device templates by editing default templates.
Adding custom performance counters
You can add custom performance counters while adding a device template or by editing a device template .
You can also do this by navigating to the device's dashboard. To do this:
- Navigate to Network > Network Devices.
- Click the name of the device.
- Go to the Performance Counters tab.
- Click Add Performance Counters.
- In the Add Performance Counters pop-up, click Add Custom Performance Counters in the bottom-right corner.
- This will direct you to the Edit Device Template screen. You can add your custom performance counters here by providing details for the following fields as shown in Figure 15.
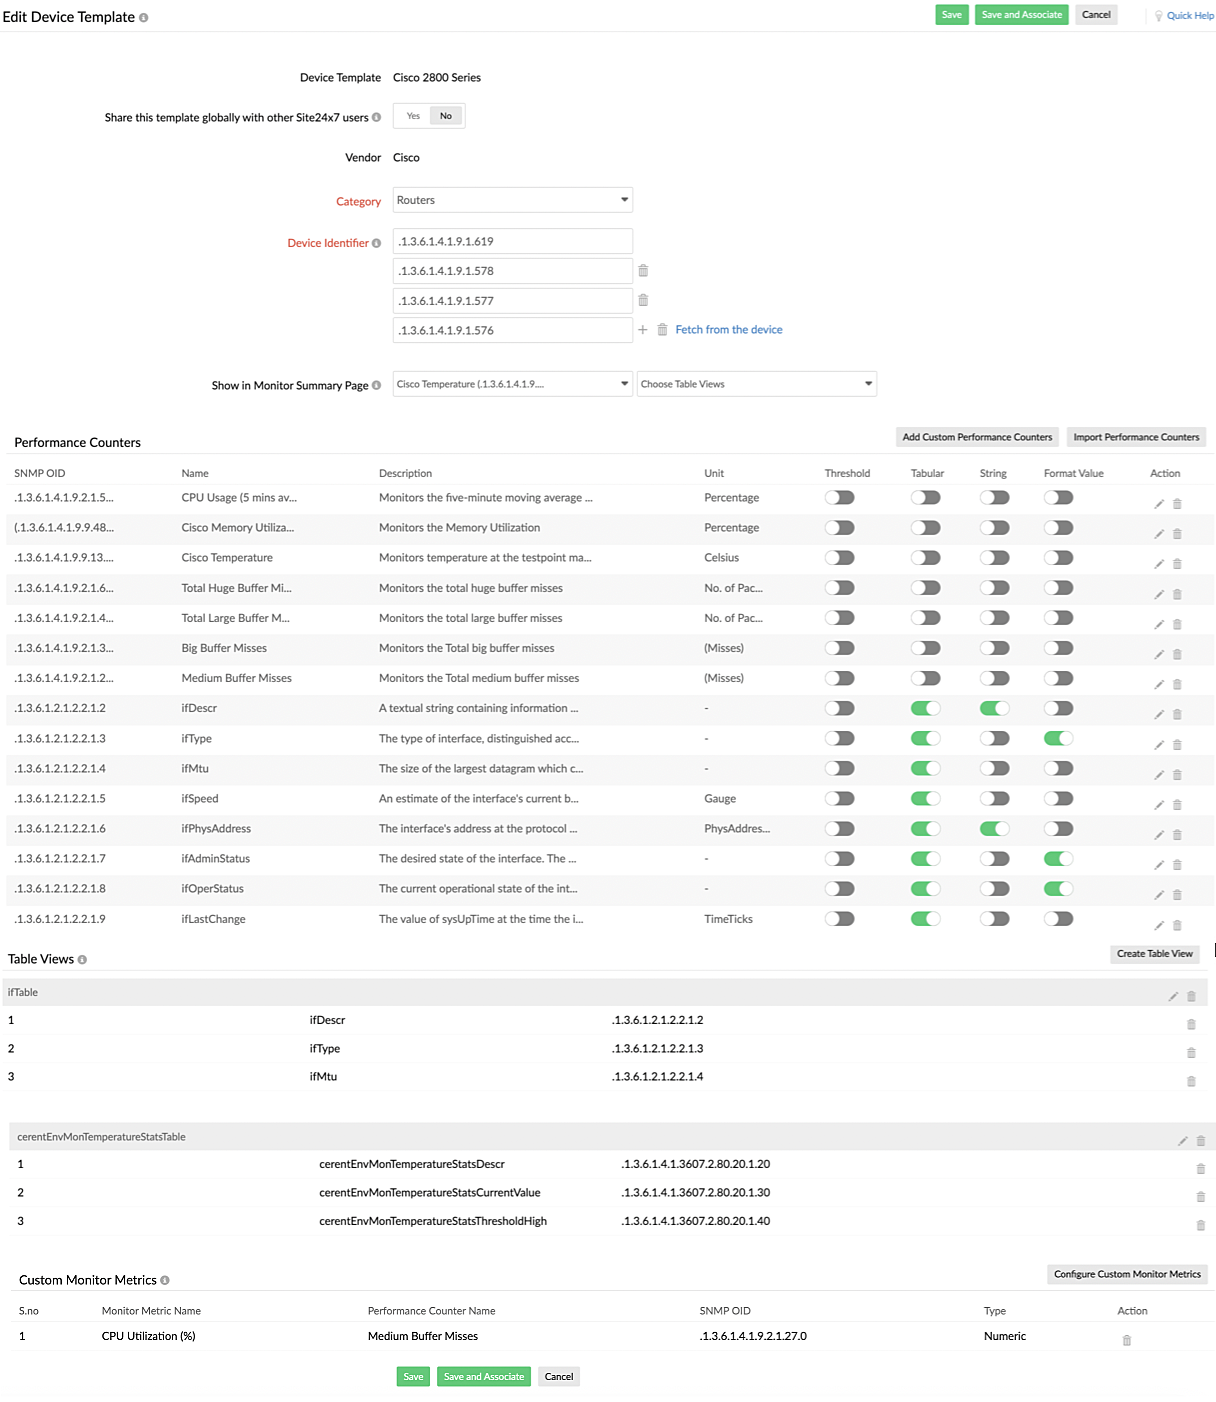
Figure 15. Editing a device template. - Use the Category drop-down menu to select the category to which the device belongs.
- You can also add a new custom category by clicking +. In this case, you will have to add a Parent Category first, and then the Category will be a subtype of the parent.
NoteThe device will be classified based on the Category or the Parent Category. For instance, if you select Desktop, Server, or Domain Controller in the Category or the Parent Category, the device will be categorized as an agentless server. If you select another option, the device will be categorized as a network device. - In the Device Identifier field, enter the sysOID.
- You can also click Fetch from device beside the field to fetch the details from the device. To do so, provide the device information as shown in Figure 2 and Figure 3.
- Beside the Custom Monitor Metrics field, click Configure Custom Monitor Metrics to configure monitor-level metrics for your device type by providing a custom performance counter. On the Custom Monitor Metrics screen, select the custom metrics for the performance counters of CPU Utilization, Memory Utilization, Manufacturer, Serial Number, Model Name, and System Uptime (hours) from the drop-down menus (Figure 14). You can also click the Test button for each to see if the correct value is fetched before adding it.
NoteCPU Utilization and Memory Utilization can only be numeric values, while the rest can be either numeric or a string. - Beside the Show in Monitor Summary Page field, select the performance counters you would like to appear on the monitor summary page. If needed, you can also add more performance counters to appear on the page.
- Click the Add Custom Performance Counters button to add custom performance counters that can be SCALAR, TABULAR, or in TABLE VIEW, which allows you to view them as a table.
- You can also click the Import Performance Counters button to import performance counters available in other device templates.
- Edit or delete performance counters from the Performance Counters section. The Threshold and Format Value columns display if the parameters are available for the performance counters. The Tabular and String columns show the performance counter is of that type.
- You can also add a new custom category by clicking +. In this case, you will have to add a Parent Category first, and then the Category will be a subtype of the parent.
- Click Save to save your changes. Click Save and Associate if you wish to associate this device template containing new performance counters with a set of network devices.
Testing custom performance counters
You can test the custom performance counters you've added to fetch their latest values. To do this:
- Go to Network > Network Devices.
- Click the name of the device.
- Go to the Performance Counters tab (Figure 16).

Figure 16. Testing performance counters. - Click Test on the custom performance counter you've added.
- The test result will be displayed in the pop-up (Figure 17).

Figure 17. Finding the value of a performance counter.
Configuring thresholds for network attributes
You can configure thresholds to receive alerts on violation of threshold conditions. You can do this at the device level, interface level, and performance counter level.
-
On this page
- When is custom SNMP monitoring useful?
- What are custom performance counters?
- More on custom performance counters
- What are custom device templates?
- What are the requisites for custom SNMP monitoring?
- Adding custom device templates
- Using custom MIBs
- Adding custom performance counters
- Testing custom performance counters
- Configuring thresholds for network attributes