Monitor networks
Site24x7's network monitoring tool offers complete visibility into any type of network within your organization, including on-premises, cloud, or software-defined networks. Check out the capabilities offered in our network monitoring tool. 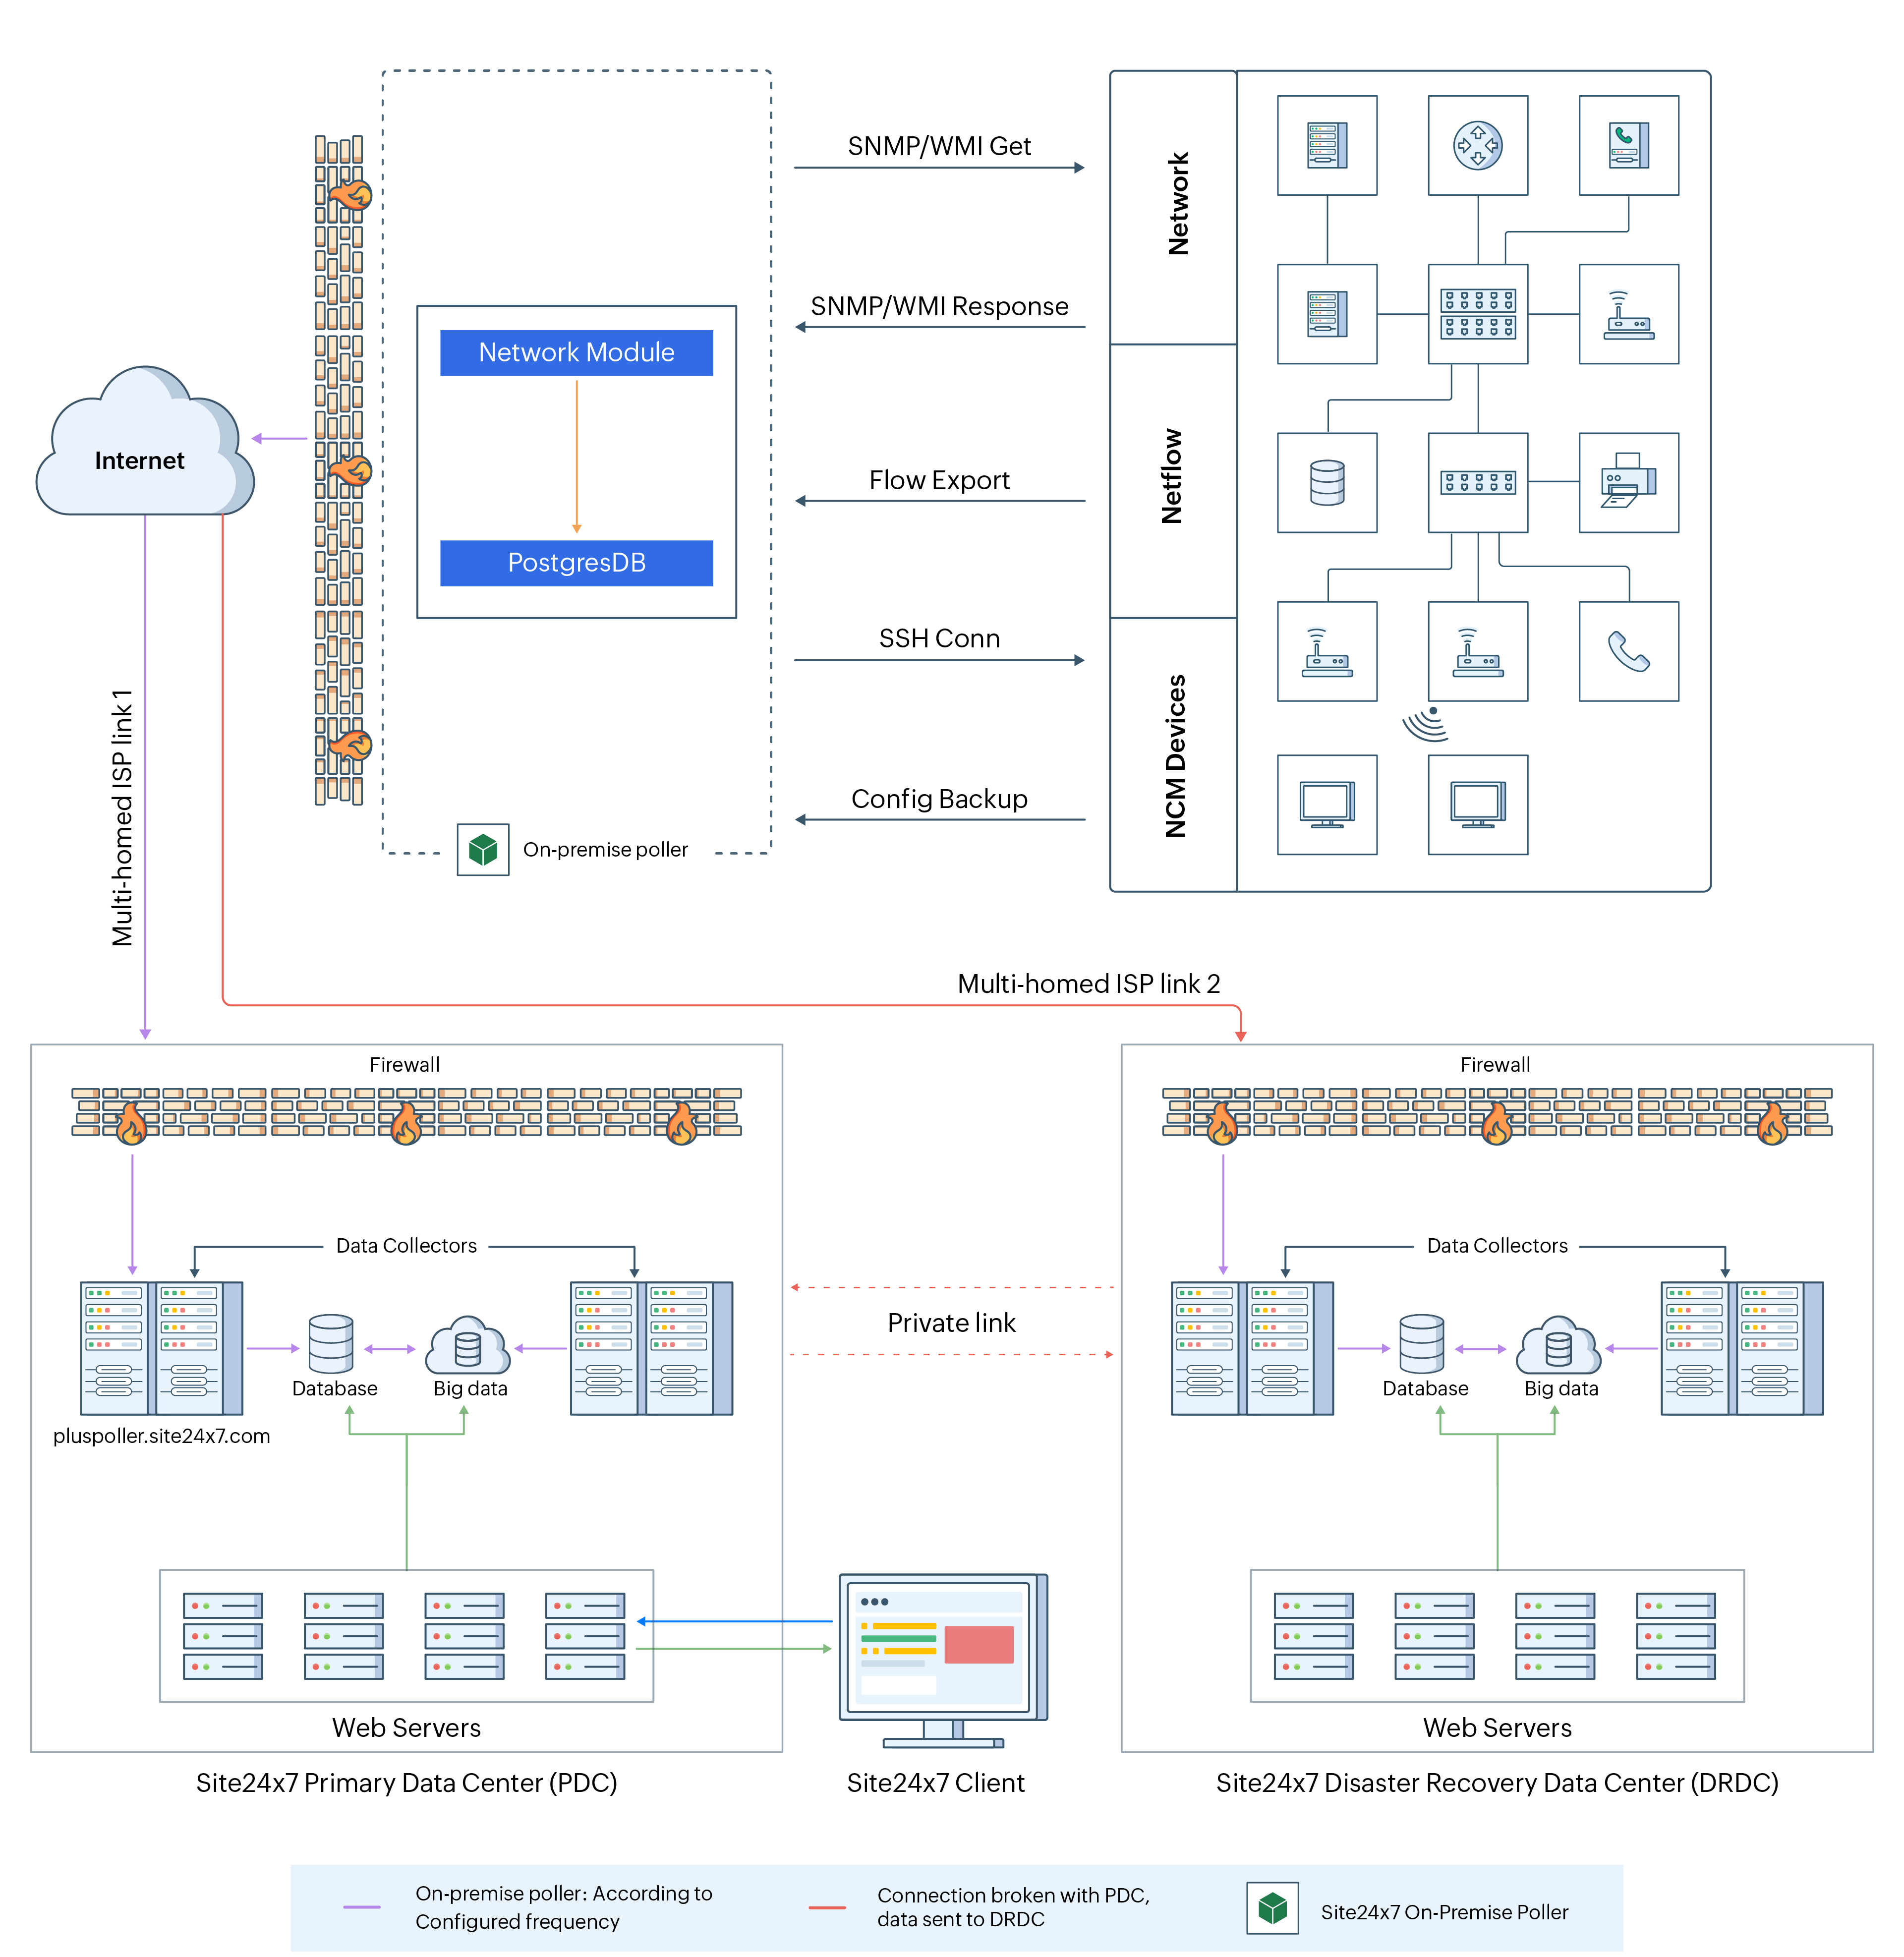
Figure 1. Network monitoring architecture diagram.
Cisco IPSLA monitoring
Cisco switch stack and WLC Monitoring
SDN monitoring
Other utilities
Watch this video to see how you can monitor your entire network with custom dashboards:
Network performance monitoring
Monitor availability and performance for your SNMP-based devices. Automatically discover your devices and continuously monitor critical metrics such as CPU, memory utilization, buffer hit stats, and more. Add the available default performance counters or create custom ones by selecting OIDs from management information base (MIB) files. Receive alerts on trap generation or threshold breaches. Site24x7 can monitor more than 15,000 device types from over 450 vendors.
Network traffic monitoring
Obtain complete visibility into your network traffic and bandwidth performance in real time. Identify traffic peaks, top applications, and conversations using different flow technologies so that you can analyze for what and by whom your bandwidth is being used. Site24x7 supports different flow technologies like NetFlow, JFlow, sFlow, IPFIX, NetStream, and AppFlow, along with support for various vendors in the market.
Network Configuration Manager
Automate network configuration changes, take backups, and restore configurations across devices from multiple vendors. Define the set of commands to connect, backup, restore, or perform other configuration-related operations on a device using NCM device templates.
Cisco IPSLA-based Monitoring
VoIP Monitoring
Assess the quality of VoIP call services throughout the call path using Cisco Internet Protocol Service Level Agreement (IPSLA). Analyzing the network and the call transmission across the call path will help to troubleshoot and rectify issues.
WAN Monitoring
Obtain real-time visibility into the performance of your WAN links. Monitor the availability of WAN links and observe the round-trip time between a Cisco router and a destination device.
Cisco switch stack and WLC Monitoring
Switch Stack Monitoring
View in-depth monitoring details to the level of each switch, checking its health, performance, and status. Visualize the connection status of each switch on the data ring.
WLC Monitoring
Track and analyze connected access points, radios, and SSID connections, and identify rogue access points on the WLC.
SDN monitoring
Cisco Meraki Monitoring
Track the availability of Meraki network devices and dive deep into each Meraki device performance.
Cisco ACI monitoring
Monitor the availability of your Cisco ACI network and gain insights into the health score of the fabric and tenants, and view the endpoints grouped in the endpoint groups.
VMware VeloCloud SD-WAN
Keep track of the performance of your VMware SD‑WAN and gain insights into the health and performance of customers, edges, links, and paths.
Cisco Catalyst SD-WAN
Gain visibility into your Cisco Catalyst SD-WAN infrastructure and track the health, connectivity, and traffic flow across controllers, edge routers, tunnels, and WAN links.
Aruba Central
Monitor your Aruba Central network infrastructure and track the health, availability, and performance of access points, switches, gateways, and client connectivity.
IP address management (IPAM)
Scan a subnet to monitor the availability, utilization, and DNS status of its IP addresses.
-
On this page
- Network performance monitoring
- Network traffic monitoring
- Network Configuration Manager
- Cisco IPSLA-based Monitoring
- Cisco switch stack and WLC Monitoring
- SDN monitoring
- Cisco Meraki Monitoring
- Cisco ACI monitoring
- IP address management IPAM
- VMware VeloCloud SD-WAN
- Cisco Catalyst SD-WAN
- Aruba Central