Performance Metrics of Network Monitor
You can view the device performance snapshot on the Monitor Status page.
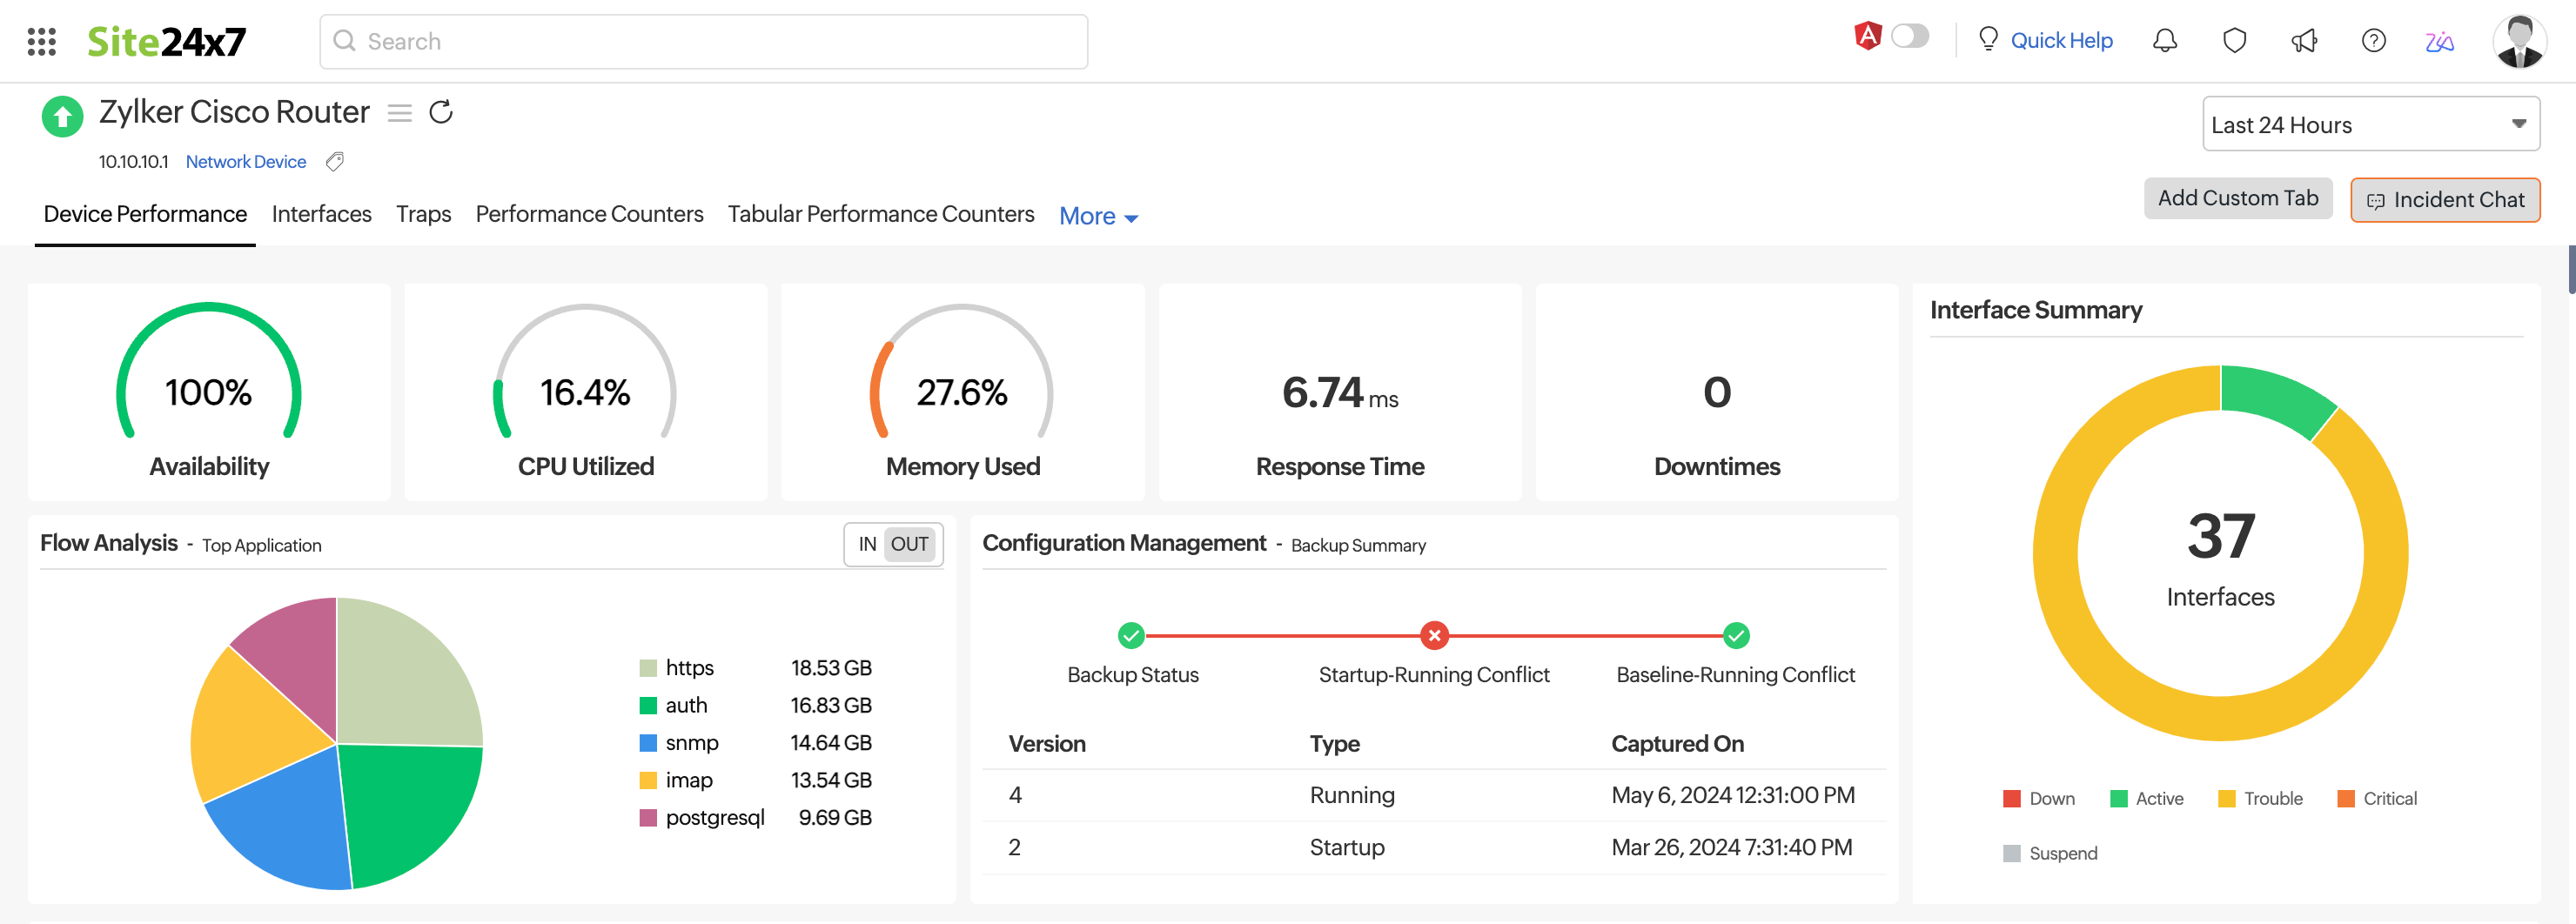
Device Performance
Access details on a device's availability, response time, and downtime by clicking its name on the Network Devices page and viewing the first tab (Device Performance) that opens. Here, you can view widgets for the Availability, Downtimes, Events Timeline, Updates, Response Time, Packet loss, CPU Utilization, Memory Utilization, Device Details, and Hardware Details.
If you have configured performance counters for CPU Utilization and Memory Utilization, you'll view them here. You can also configure the product to show Custom Monitor Metrics by editing Device Templates.
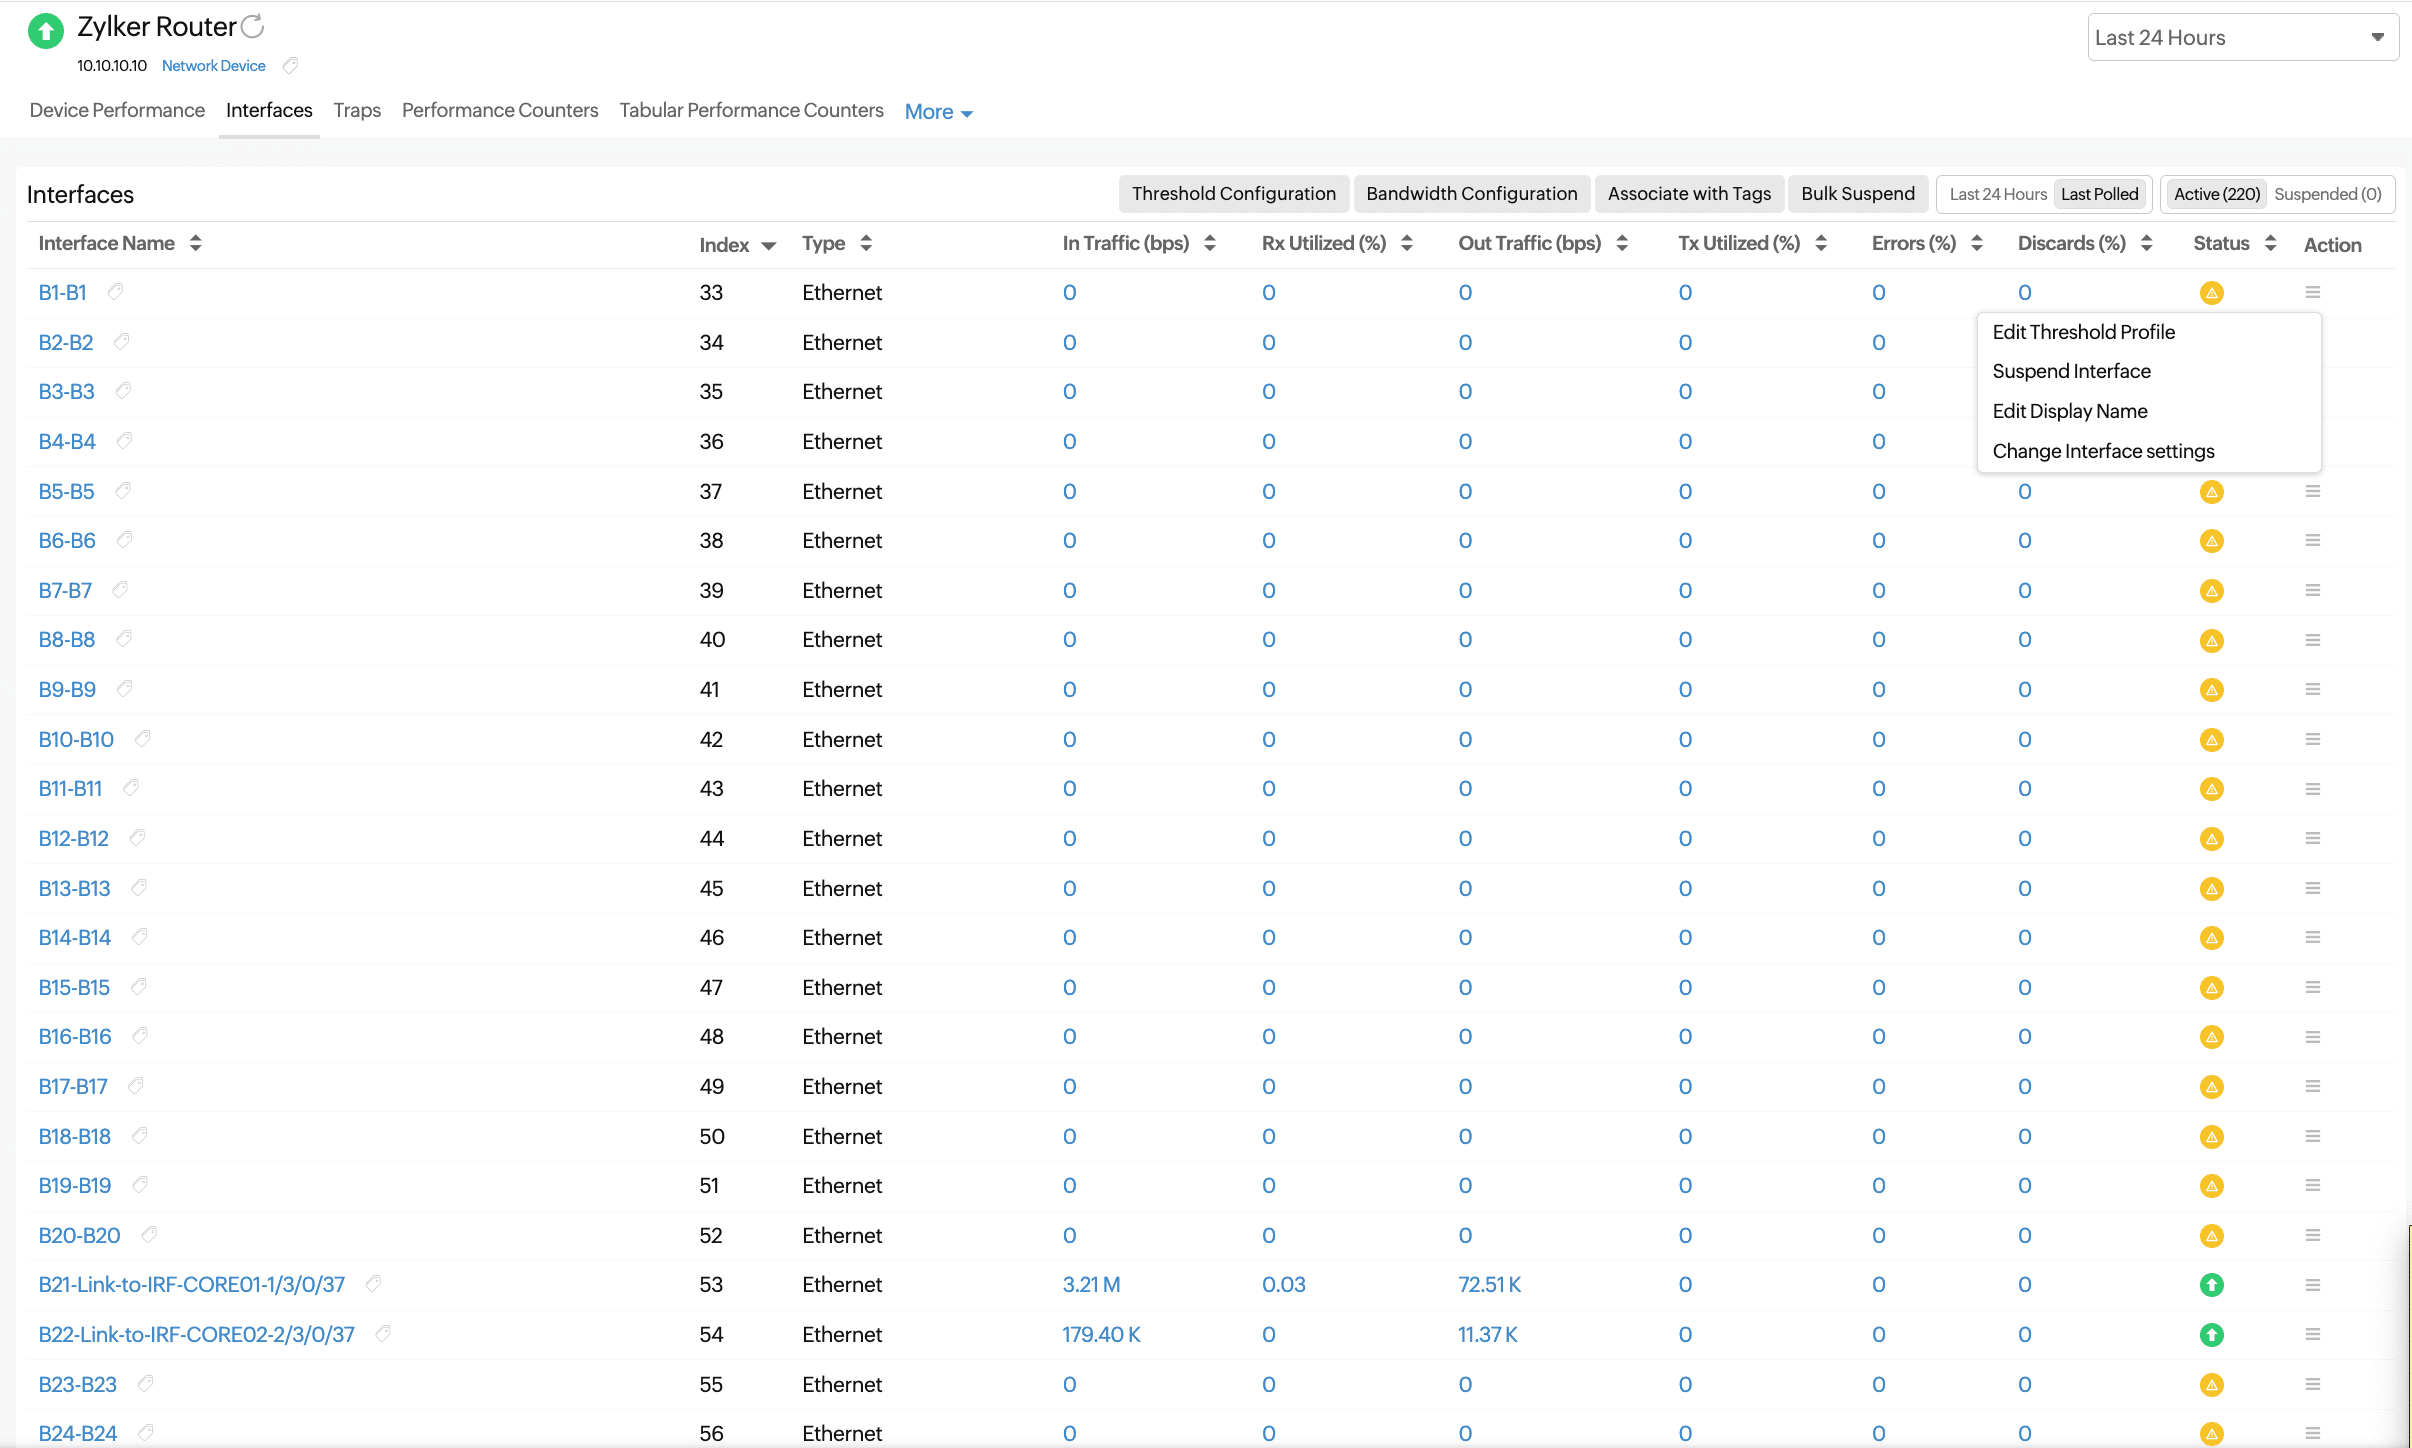
Interfaces
Displays the list of interfaces on the selected device with their statuses and other details. Click the interface name to view its availability as well as graphs on its traffic and bandwidth utilization.
Toggle between the licensed interfaces that are being monitored (i.e., active interfaces) and the unlicensed interfaces that are not being monitored (i.e., suspended interfaces).
| Parameter | Description |
|---|---|
| Interface Name | The name of the interface obtained from RFC 1213 |
| Index | The serial port |
| Type | The type of the interface, like ethernet or a VLAN |
| In Traffic (bps) | The amount of traffic received by the interface in bits per second |
| Rx Utilized (%) | The amount of received traffic utilized by the interface as a percentage |
| Out Traffic (bps) | The amount of traffic transmitted by the interface in bits per second |
| Tx Utilized (%) | The amount of transmitted traffic utilized by the interface as a percentage |
| Errors (%) | The percentage of error packets received by the interface |
| Discards (%) | The percentage of packets discarded by the interface (out of the total number of packets) |
| Status | The state of the interface: up, down, or trouble |
| Action | Click the hamburger icon |
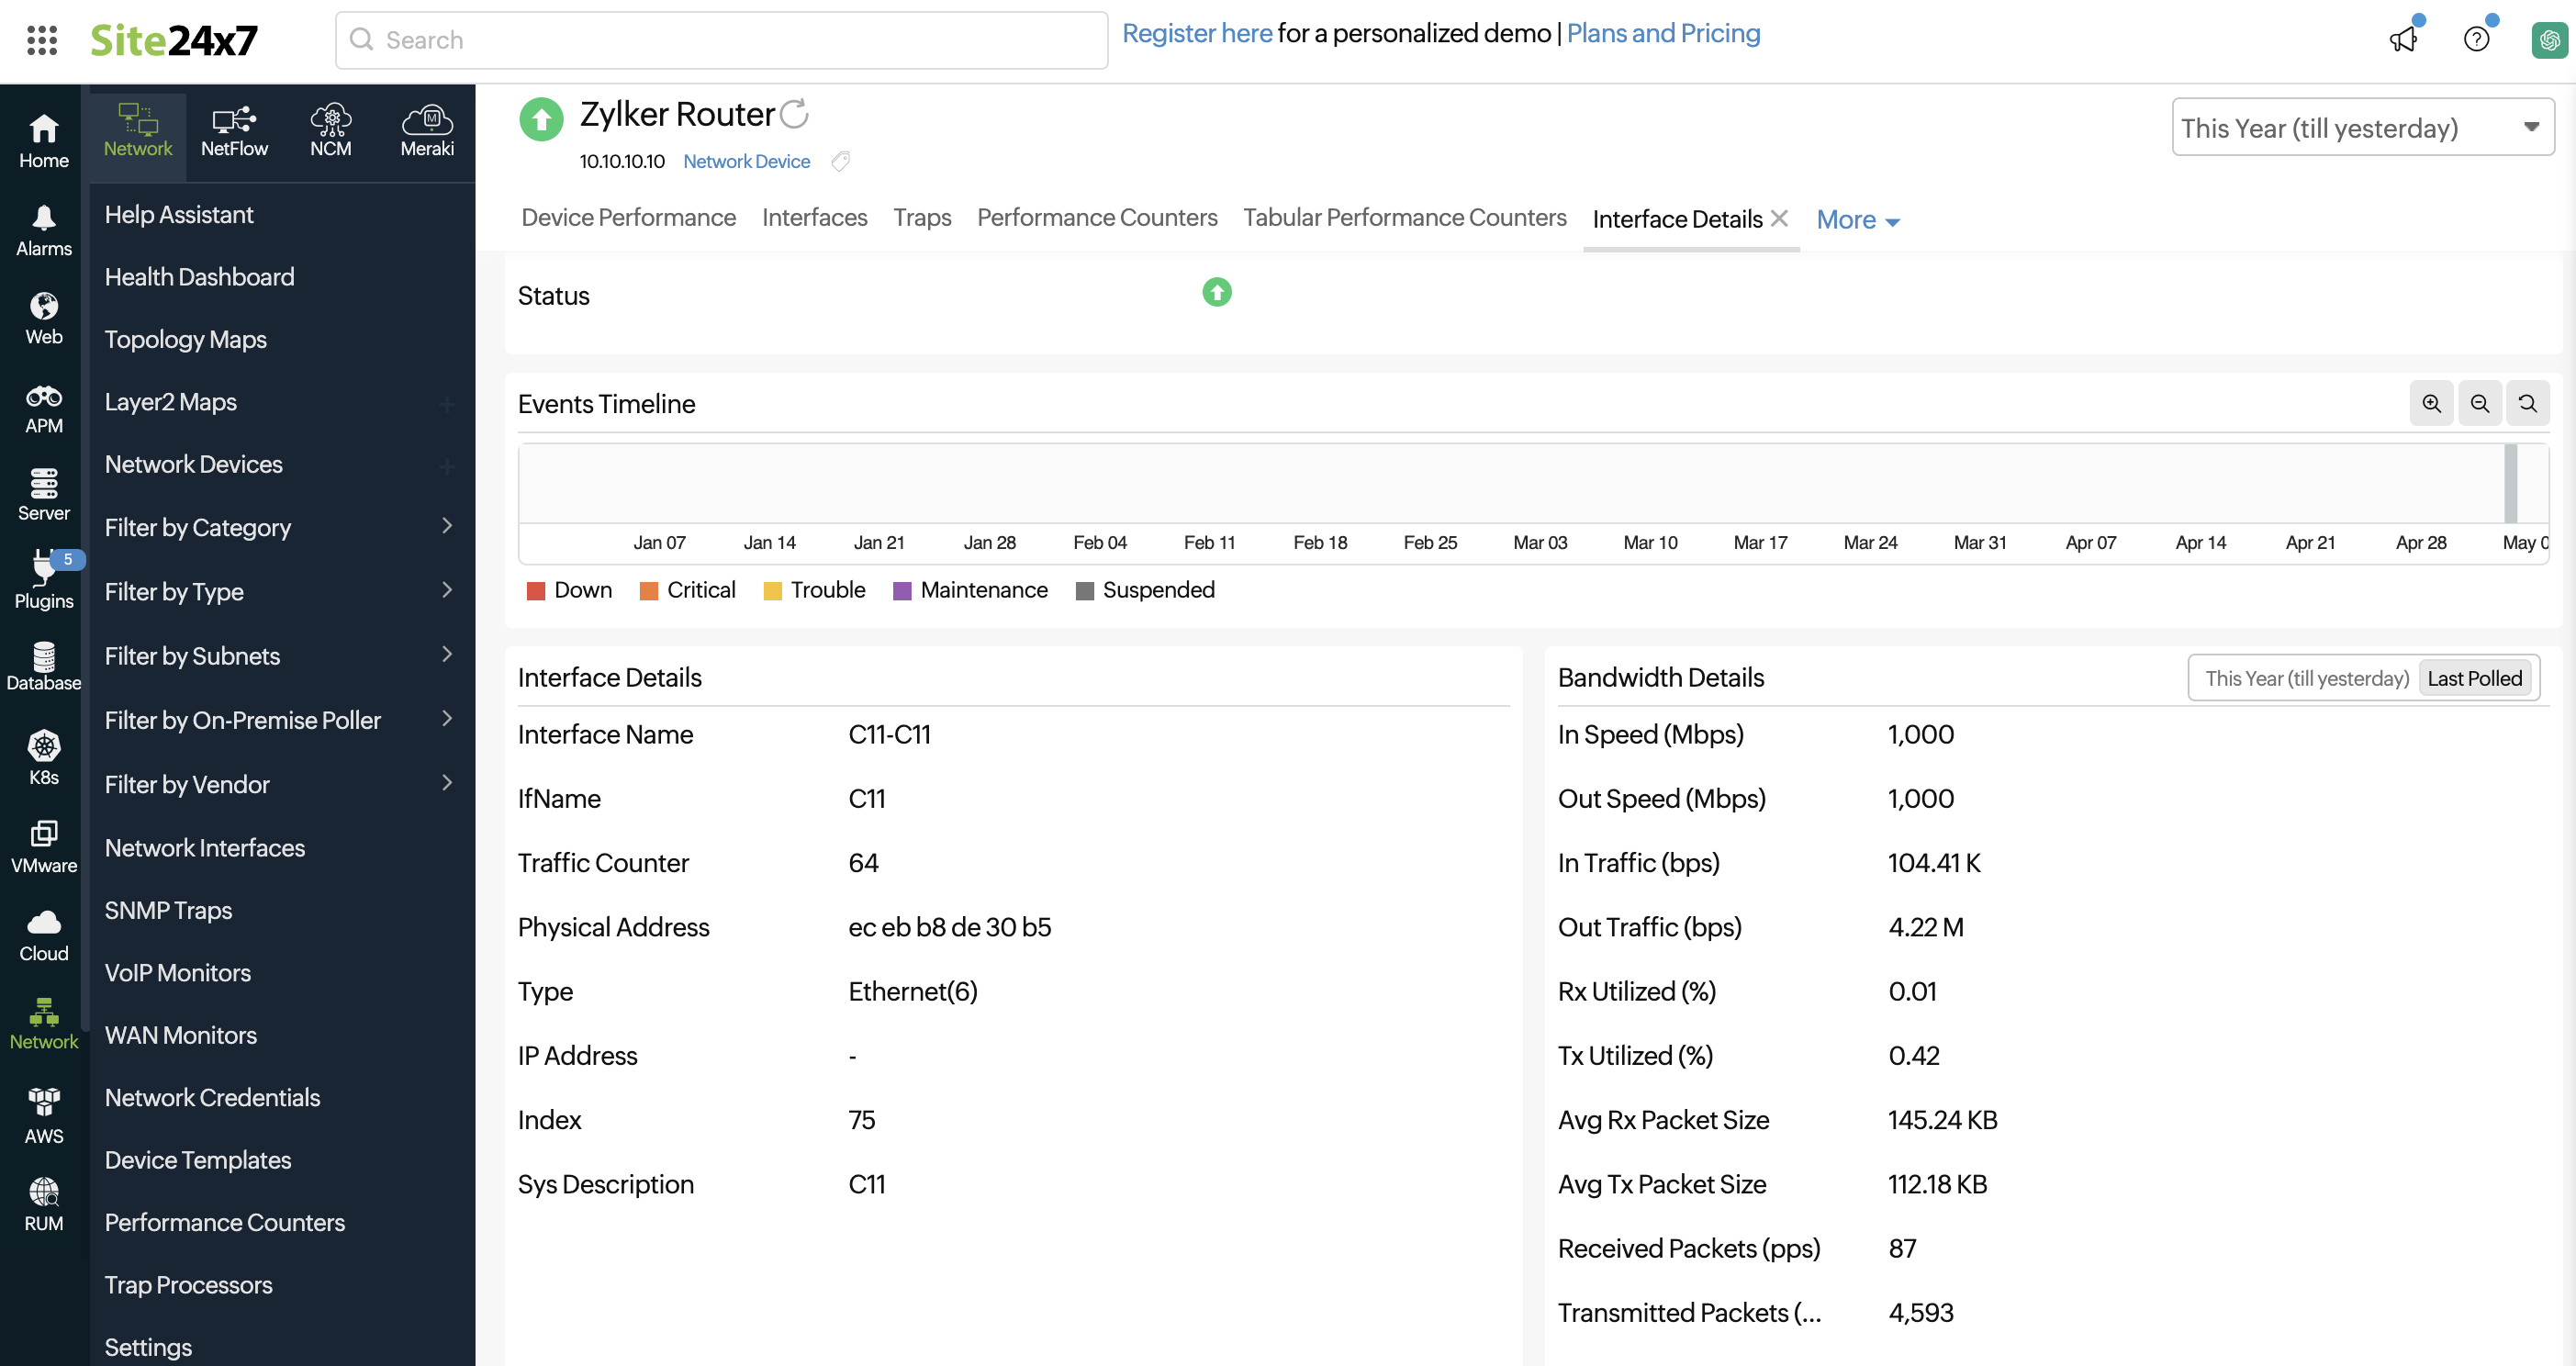
Clicking an interface provides the following details:
| Parameter | Description |
|---|---|
| Admin State | The admin state of the interface: up or down |
| Operational State | The operational state of the interface: up, trouble, or down |
| Receive Utilization | The amount of received traffic utilized by the interface |
| Transmit Utilization | The amount of transmitted traffic utilized by the interface |
| Utilization | The average of the received and transmitted traffic utilized |
| In Traffic | The amount of traffic received by the interface |
| Out Traffic | The amount of traffic transmitted by the interface |
| Traffic | The total traffic |
| Packets Received | The number of error packets received by the interface |
| Packets Sent | The number of error packets sent by the interface |
| Packets | The total number of packets handled by the interface |
| Rx Volume | The total volume received in bytes |
| Tx Volume | The total volume transmitted in bytes |
| Volume | The total volume in bytes |
| Errors (%) | The percentage of error packets received by the interface |
| Discards (%) | The percentage of packets discarded by the interface (out of the total number of packets) |
| Error and Discard Percentage | The percentages of errors and discards, including the Average, Maximum, and Minimum |
| Error and Discard Count | The counts of errors and discards, including the Average, Maximum, and Minimum |
Bandwidth details are also captured along with other metrics:
| Parameter | Description |
|---|---|
| In Speed (Mbps) | The amount of bandwidth that can be received by the interface; this is a constant value from the SNMP response of that interface |
| Out Speed (Mbps) | The amount of bandwidth transmitted by the interface; this is a constant value from the SNMP response of that interface |
| In Traffic (bps) | The amount of traffic received by the interface |
| Out Traffic (bps) | The amount of traffic transmitted by the interface |
| Rx Utilized (%) | The amount of received traffic utilized by the interface |
| Tx Utilized (%) | The amount of transmitted traffic utilized by the interface |
| Avg Rx Packet Size | The average packet size received for a period of time |
| Avg Tx Packet Size | The average packet size transmitted for a period of time |
| Received Packets (pps) | The number of error packets received by the interface |
| Transmitted Packets (pps) | The number of error packets sent by the interface |
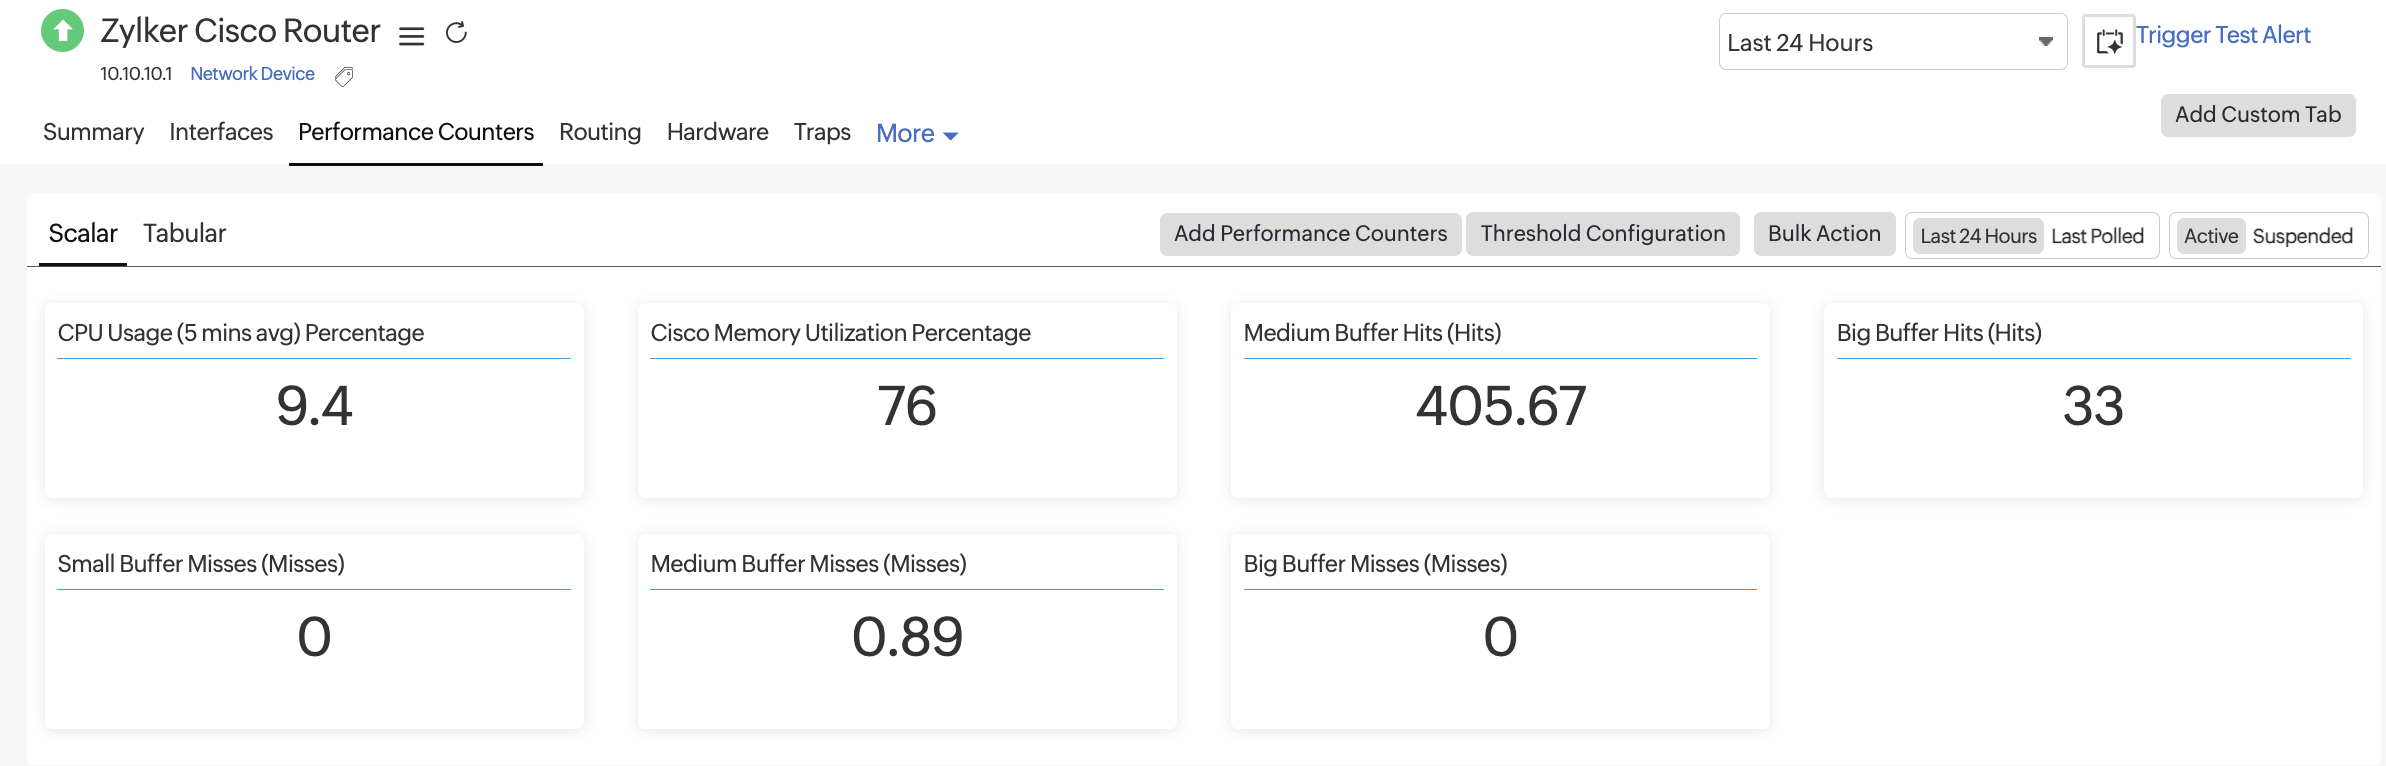
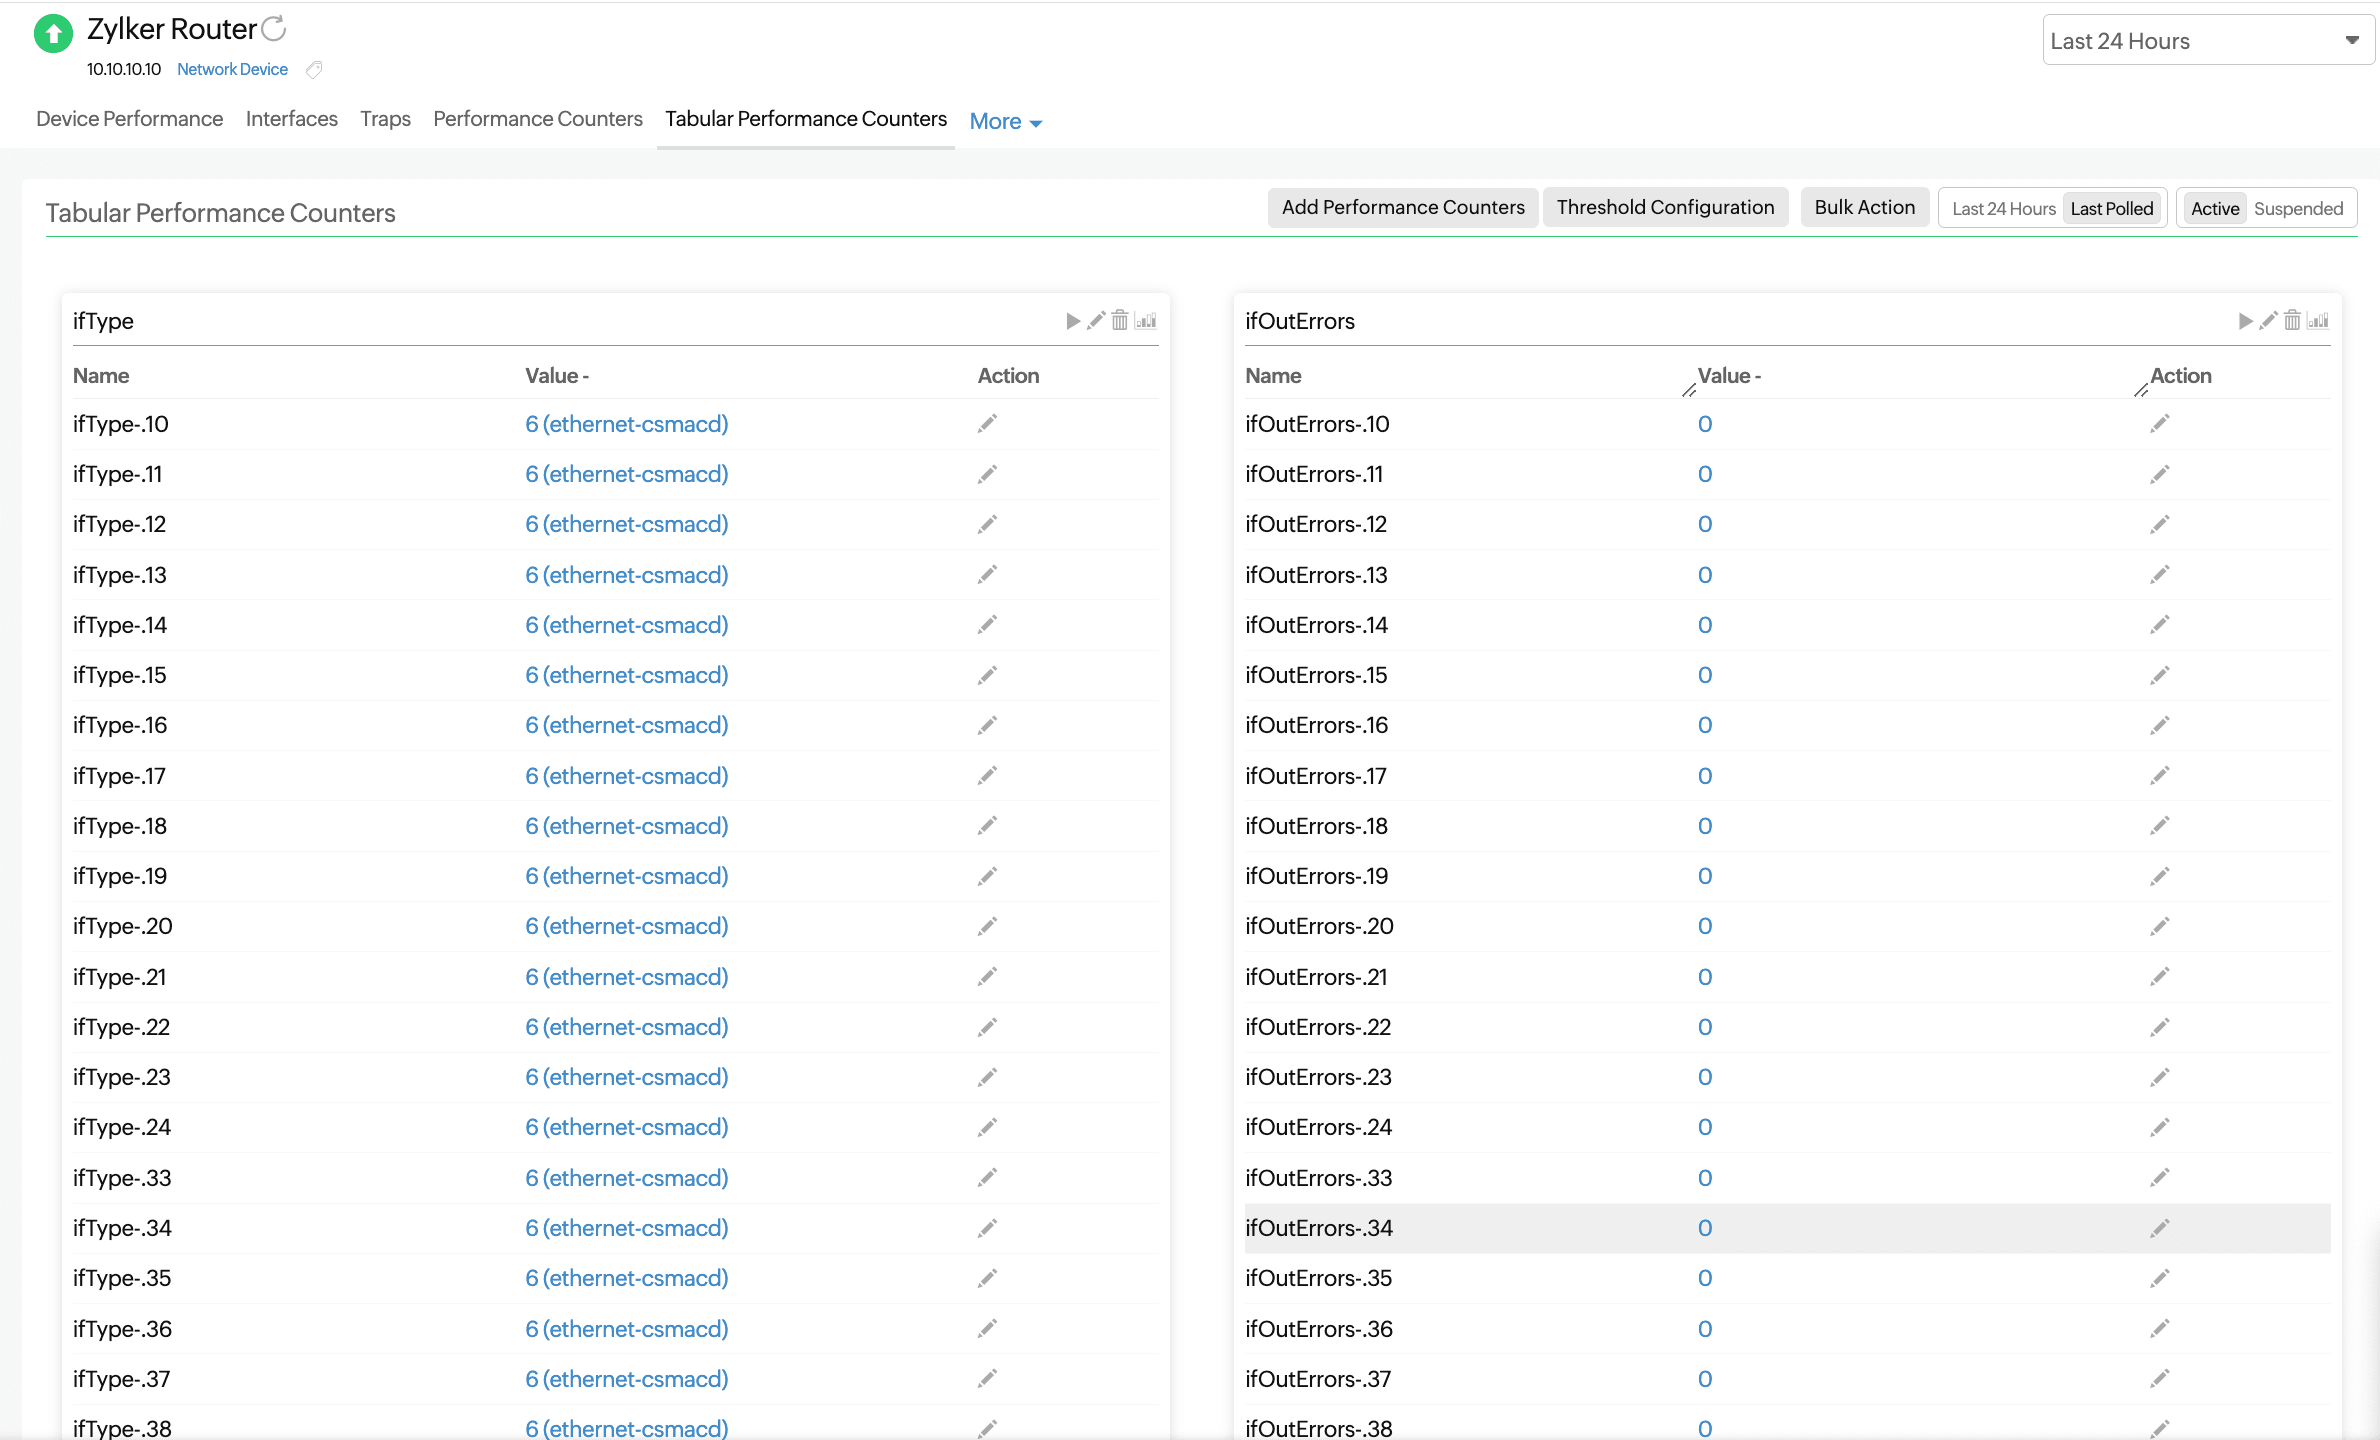
Performance Counters
This tab lists the custom performance counters associated with the device. Toggle between Scalar and Tabular at the top of the table to view the respective performance counters.
View metrics that have a single value, like temperature stats, memory utilization, and CPU utilization.
Monitor the tabular SNMP object identifiers of your network devices. With these, you can monitor multiple instances of the same attribute (such as for the memory, disk, or interfaces) of a single network device.
Routing
Track the availability and response times of routers configured in your network. Get deep visibility into key router performance indicators like buffer hit statistics and buffer miss statistics.
| Section | Description | Purpose |
|---|---|---|
| BGP Peer Metrics | The metrics related to BGP peers, such as the state, uptime, and flaps | Helps you track the stability and performance of BGP sessions with external or internal peers |
| OSPF Neighbor Metrics | The OSPF neighbor details, like the adjacency state, neighbor ID, and cost | Monitors OSPF neighbor relationships and detects routing issues in the OSPF domain |
| EIGRP Peer Metrics | The list of EIGRP peers and their associated route metrics | Helps you validate EIGRP peering and identify changes in routing path selection |
| Buffer Hit Statistics | The average of the number of buffer hits for a period of time, along with the size of the buffer; there are four types of buffers: huge, large, big, and medium | Indicates how efficiently buffer memory is being used, which affects traffic handling |
| Buffer Miss Statistics | The average of the number of buffer misses for a period of time, along with the size of the buffer; there are four types of misses: big, small, medium, and large | Helps you identify if traffic is being dropped or delayed due to buffer exhaustion or bottlenecks |
Hardware
Monitor the physical health of your Cisco devices using the Hardware tab. This section displays sensor-level data such as the temperature, fan speed, and power status. You can view the Sensor States, Sensor Values, and Status and configure thresholds for each of the rows or categories as needed. The available sensors are categorized as Temperature, Fan, or Power sensors.
Here's an explanation of the available columns that will be displayed for each metric:
| Metric | Description |
|---|---|
| Name | The hardware component being monitored |
| Sensor State | The operational state of the sensor (e.g., Normal, Warning, or Failed) |
| Sensor Value | The real-time temperature reading in degrees Celsius (°C) |
| Status | The overall health of the sensor based on threshold rules |
| Action | This allows you to edit threshold configurations for that specific sensor |
Temperature sensors
| Name | Description |
|---|---|
| CPU | The temperature of the device's CPU |
| Exhaust Left | The temperature of the air exiting from the left side of the device |
| Exhaust Right | The temperature of the air exiting from the right side of the device |
| Intake Left | The temperature of the air entering from the left side of the chassis |
| Intake Right | The temperature of the air entering from the right side of the chassis |
| Power Supply | The temperature of the device’s power supply unit (to detect overheating) |
Fan sensors
| Name | Description |
|---|---|
| Fan 1 | The first internal fan's operational status |
| Fan 2 | The second internal fan's operational status |
| Fan 3 | The third internal fan's operational status |
| Fan 4 | The fourth internal fan's operational status |
| Fan Tray | The operational status of the entire fan assembly or tray that houses multiple fans |
Power sensors
| Name | Description |
|---|---|
| C2921/C2951 AC Power Supply | The state of the main AC power supply unit for Cisco 2921 and 2951 devices |
| Redundant Power Supply | The state of the backup power module used for failover in case the main power supply fails |

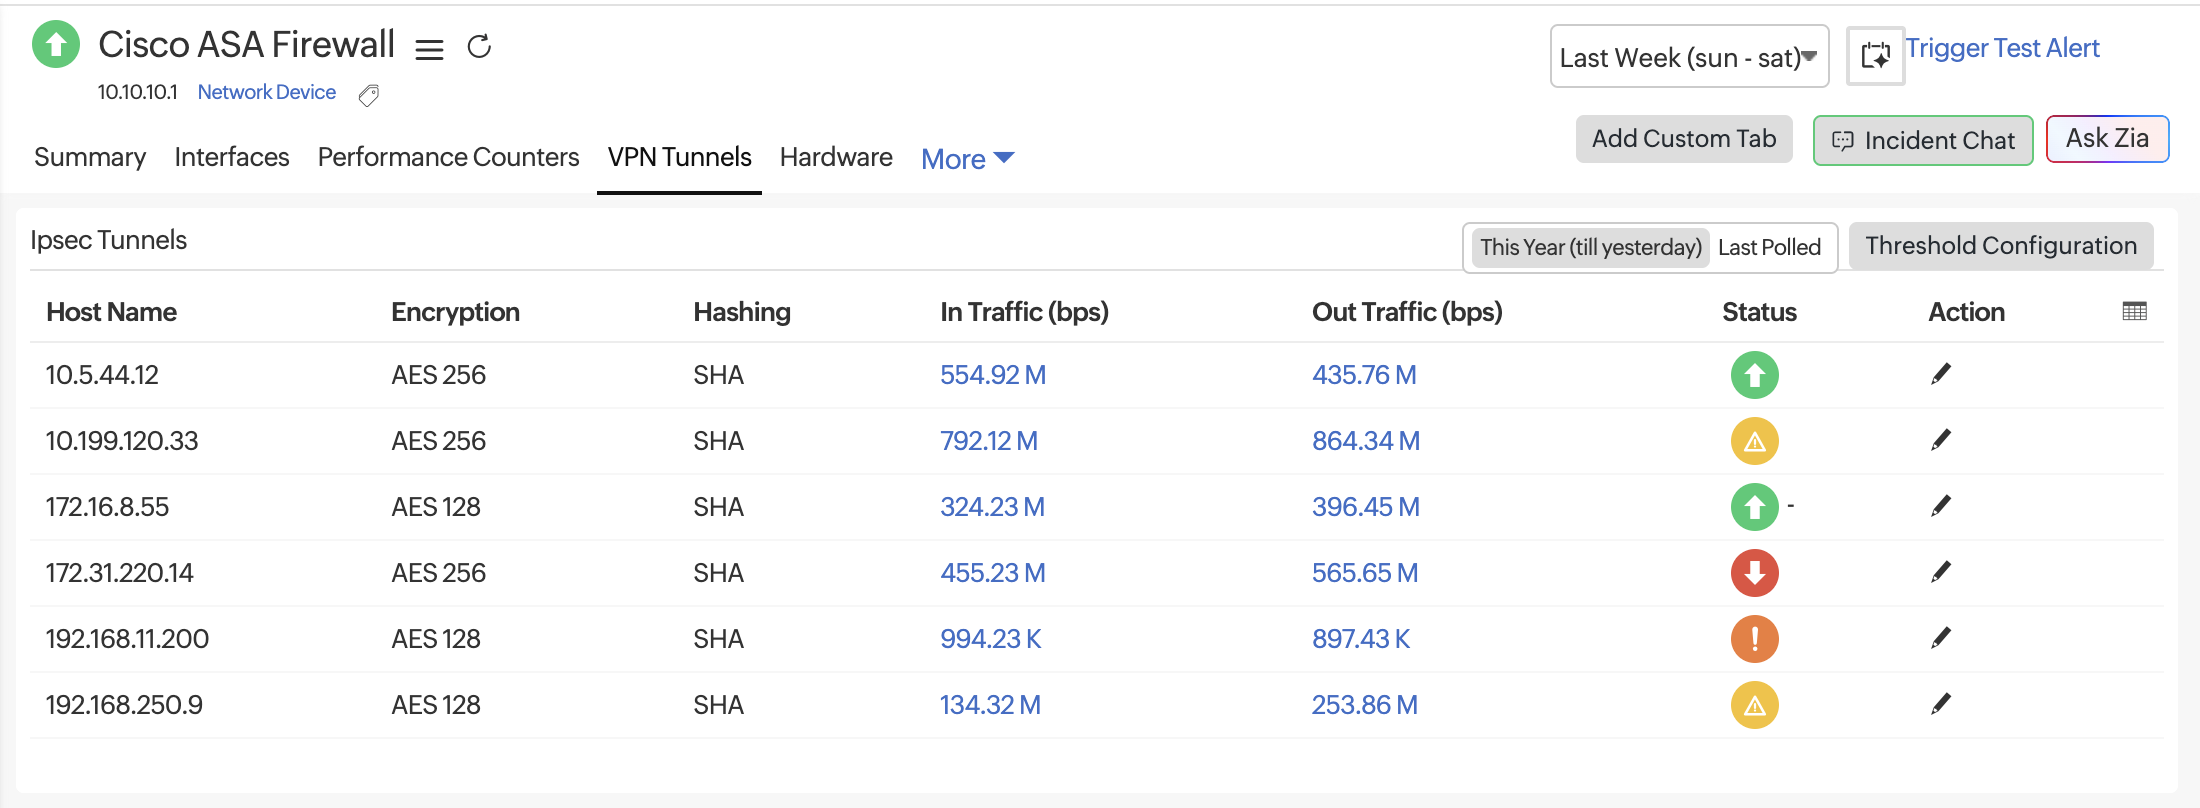
VPN Tunnels
The VPN Tunnels tab lists all discovered IPsec tunnels for the monitored firewall. These metrics help you track tunnel health, encryption status, and real-time traffic flow between sites. Use these insights to troubleshoot tunnel instability or bandwidth saturation.
To access this feature, ensure your On-Premise Poller is running version 6.7.5 or later. This is supported for FortiGate, Cisco, and WatchGuard firewalls and Layer 3 devices.
Metrics
| Metric | Description |
|---|---|
| Host Name | The peer IP address or tunnel endpoint associated with the IPsec connection. |
| Encryption | The encryption algorithm applied for securing VPN data (e.g., AES-128, AES-256, or 3DES). Shows NONE when encryption is not configured. |
| Hashing | The hashing or integrity verification method used (e.g., SHA, SHA-256, or MD5). |
| In Traffic (bps) | The inbound data rate over the VPN tunnel, measured in bits per second. Useful for identifying ingress bandwidth usage and load. |
| Out Traffic (bps) | The outbound data rate over the VPN tunnel, measured in bits per second. Helps identify egress bandwidth consumption and potential traffic asymmetry. |
| Status | Indicates the operational state of the tunnel. A green icon represents an active, healthy tunnel. |
| Action | Options to edit thresholds by clicking the pencil icon. |