Custom Attributes
A Custom Attributes monitor lets you track specific key metrics from Site24x7's Data Lake and configure alerts for them. A Custom Attributes monitor consumes one basic monitor license and is ideal when you want focused alerting on selected metrics.
Below are the steps to add a Custom Attributes monitor:
- Log in to the Site24x7 console.
- Go to Metrics > Data Lake.
- Add a monitor in the Data Lake by integrating your data using the Custom Source option.
- Open the Data Lake monitor for which you want to configure Custom Attributes.
- Click Configure Alert.
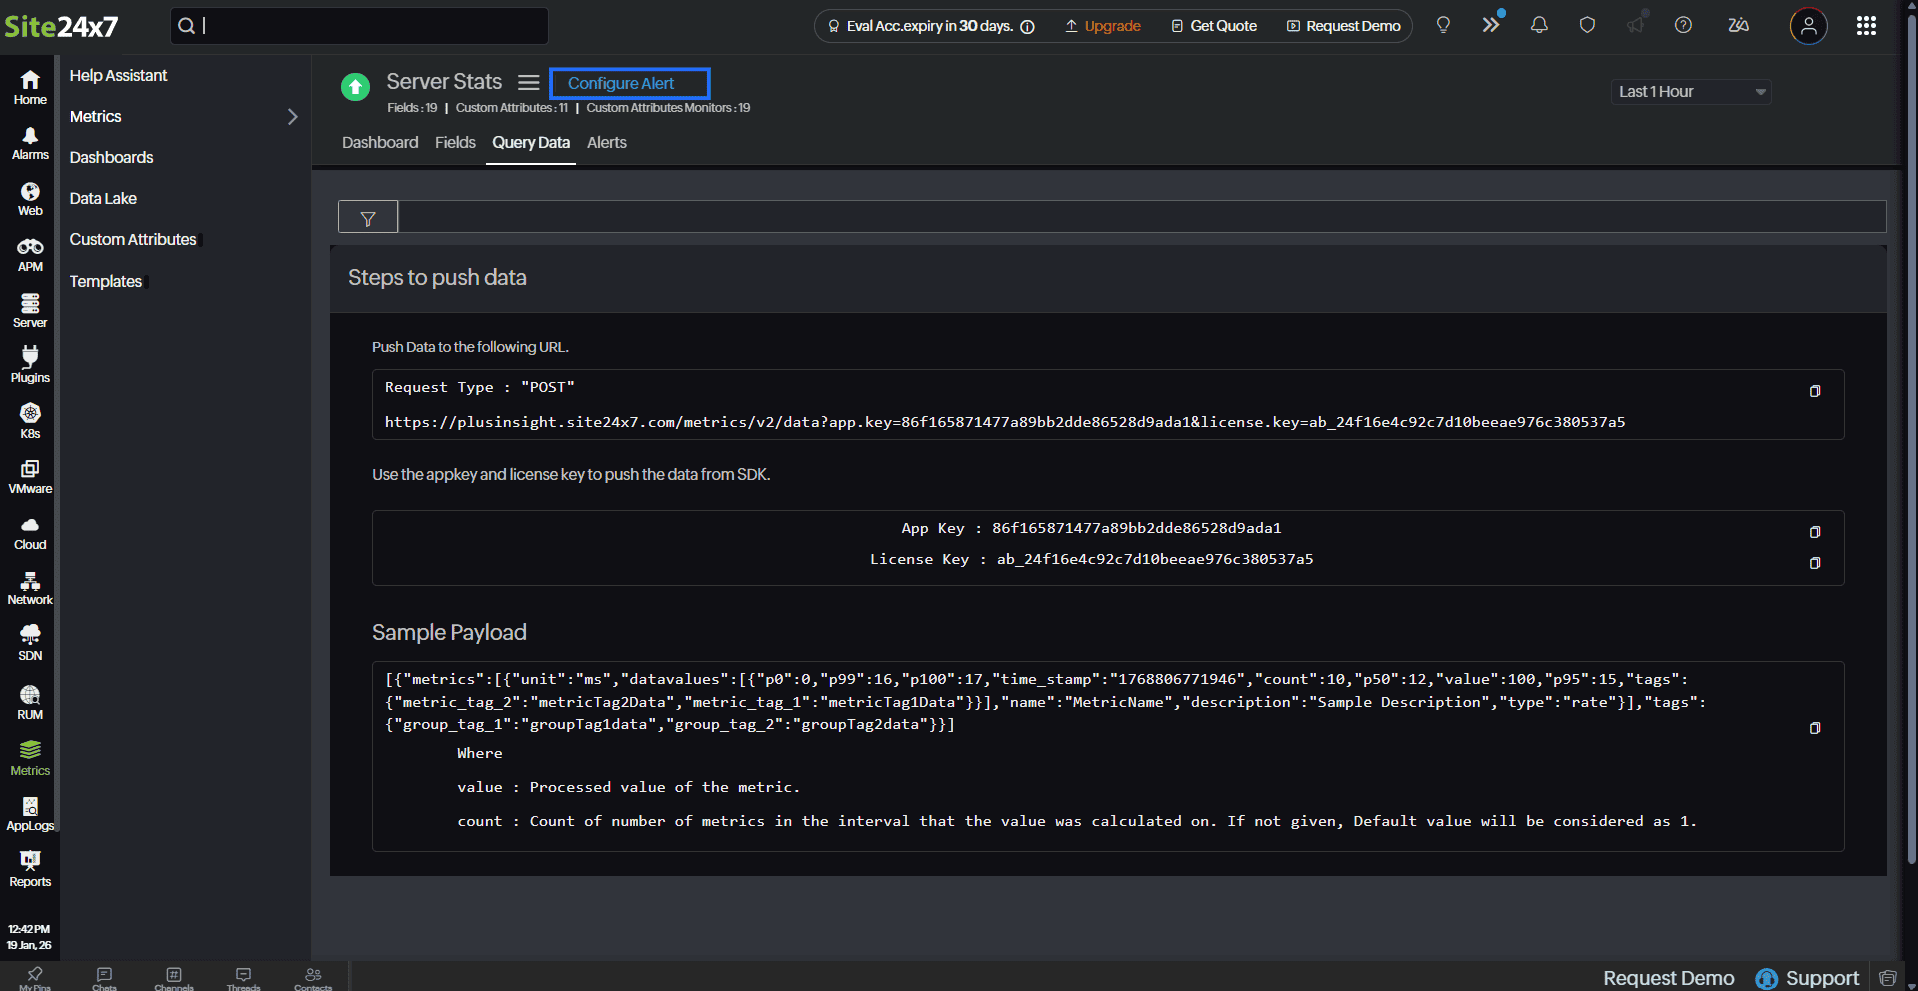
A three-step configuration roadmap will be displayed:
Step 1: Define Metrics
- On the Step 1 screen, click + Add Attribute.
- Enter the required details as explained below:
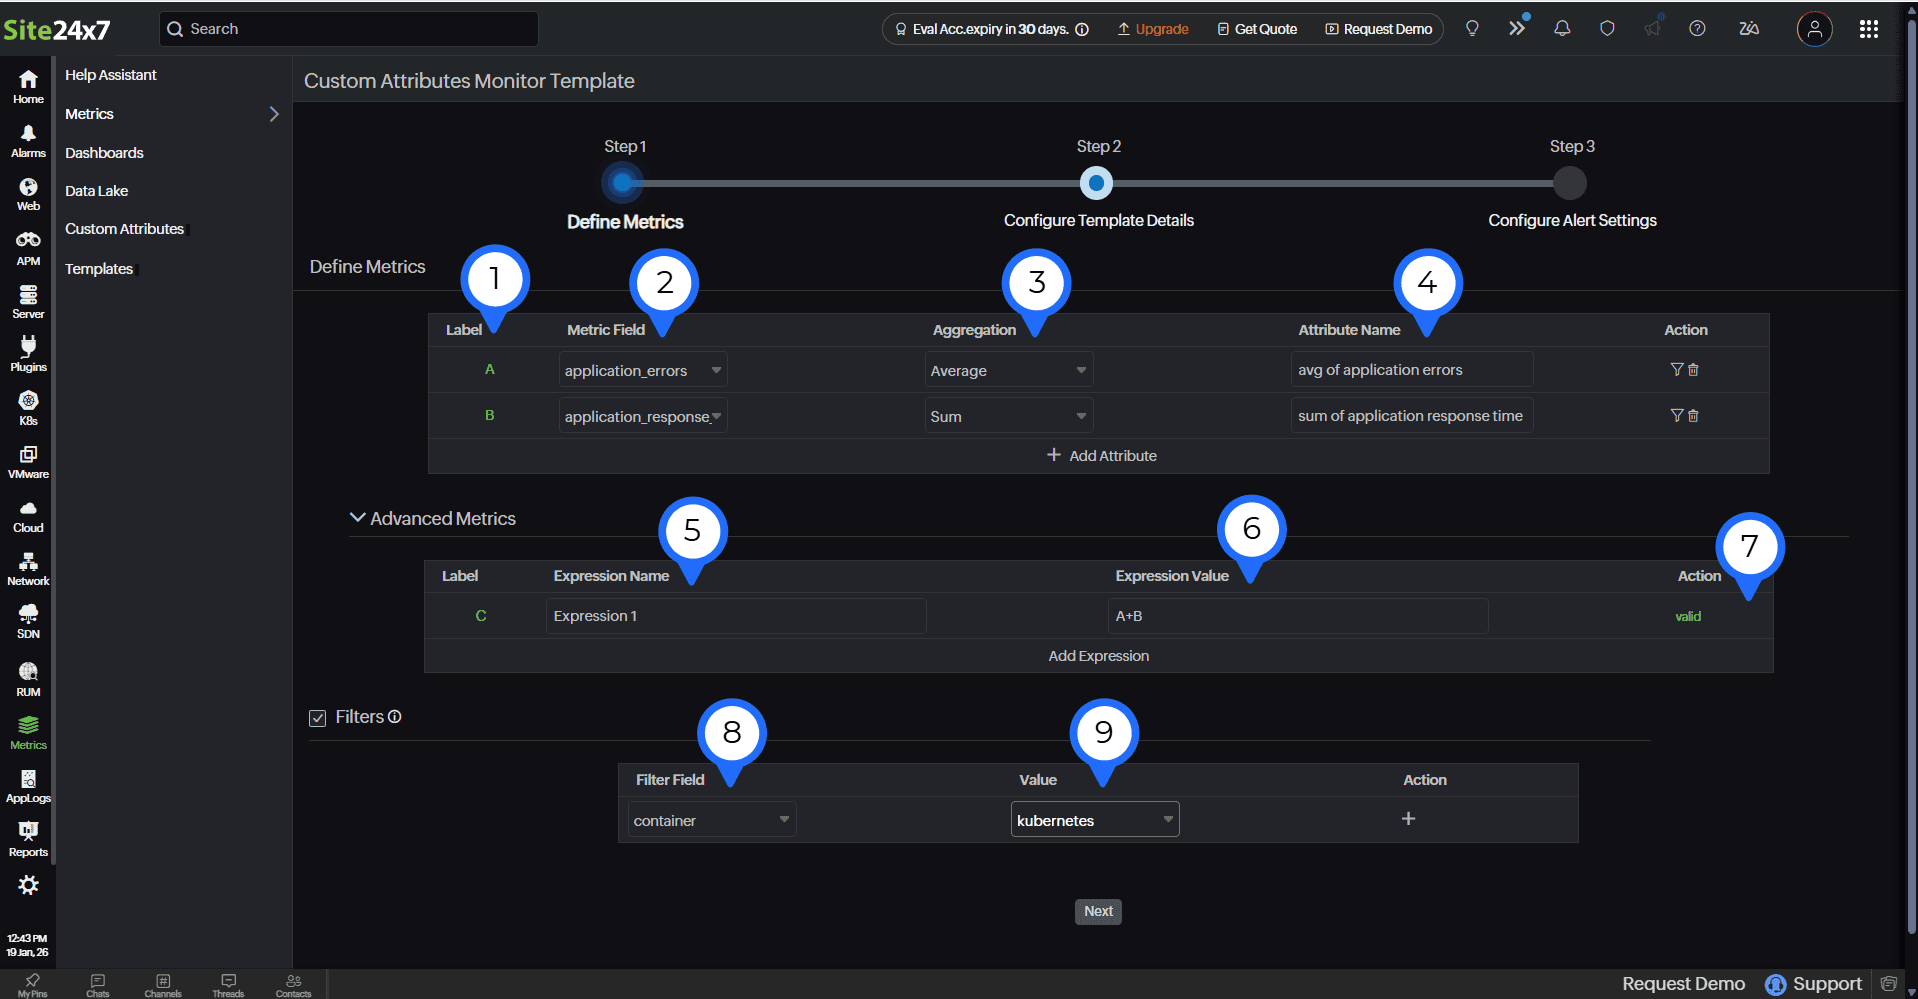
| Field number (as marked in the image) | Field name | Description |
|---|---|---|
| 1 |
Label | This is an auto-generated identifier (A, B, C, and so on) assigned to each attribute. |
|
2 |
Metric Field | Select the attribute from the incoming data that will be used to generate the metric. Note
You can add up to 10 metric attributes per template. |
|
3 |
Aggregation | Select the calculation method to define how the metric values should be calculated over time. |
| 4 |
Attribute Name | This is the name assigned to the configured metric attribute. |
| 5 |
Expression Name | This is the name of the advanced metric expression created by combining configured attributes. |
|
6 |
Expression Value |
This is the arithmetic expression used to calculate the metric by combining attributes.
Note
You can add up to 5 expressions. |
| 7 | Action |
Click Validate to verify the expression.
|
3. You can click Add Expression to add additional expressions to define the metrics.
4. Click the Filters check box to add filters. Below are the fields that you can use to filter the metrics:
| Field number (as marked in the image) | Field | Description |
|---|---|---|
| 8 | Filter Field |
This allows you to apply filters to the configured attributes, if required. Select a tag from the drop-down and enter the value to filter the metric. Tags sent in the JSON payload will appear in the drop-down. Note
The filter options available in this drop-down are global filters. You can add up to 5 global filters. |
| 9 |
Value | Enter the value to apply filtering to the metrics. |
The configured metrics are polled every five minutes, and alerts are triggered based on the defined conditions.
5. Click Next to proceed.
Step 2: Configure Template Details
-
Fill out the form as follows:
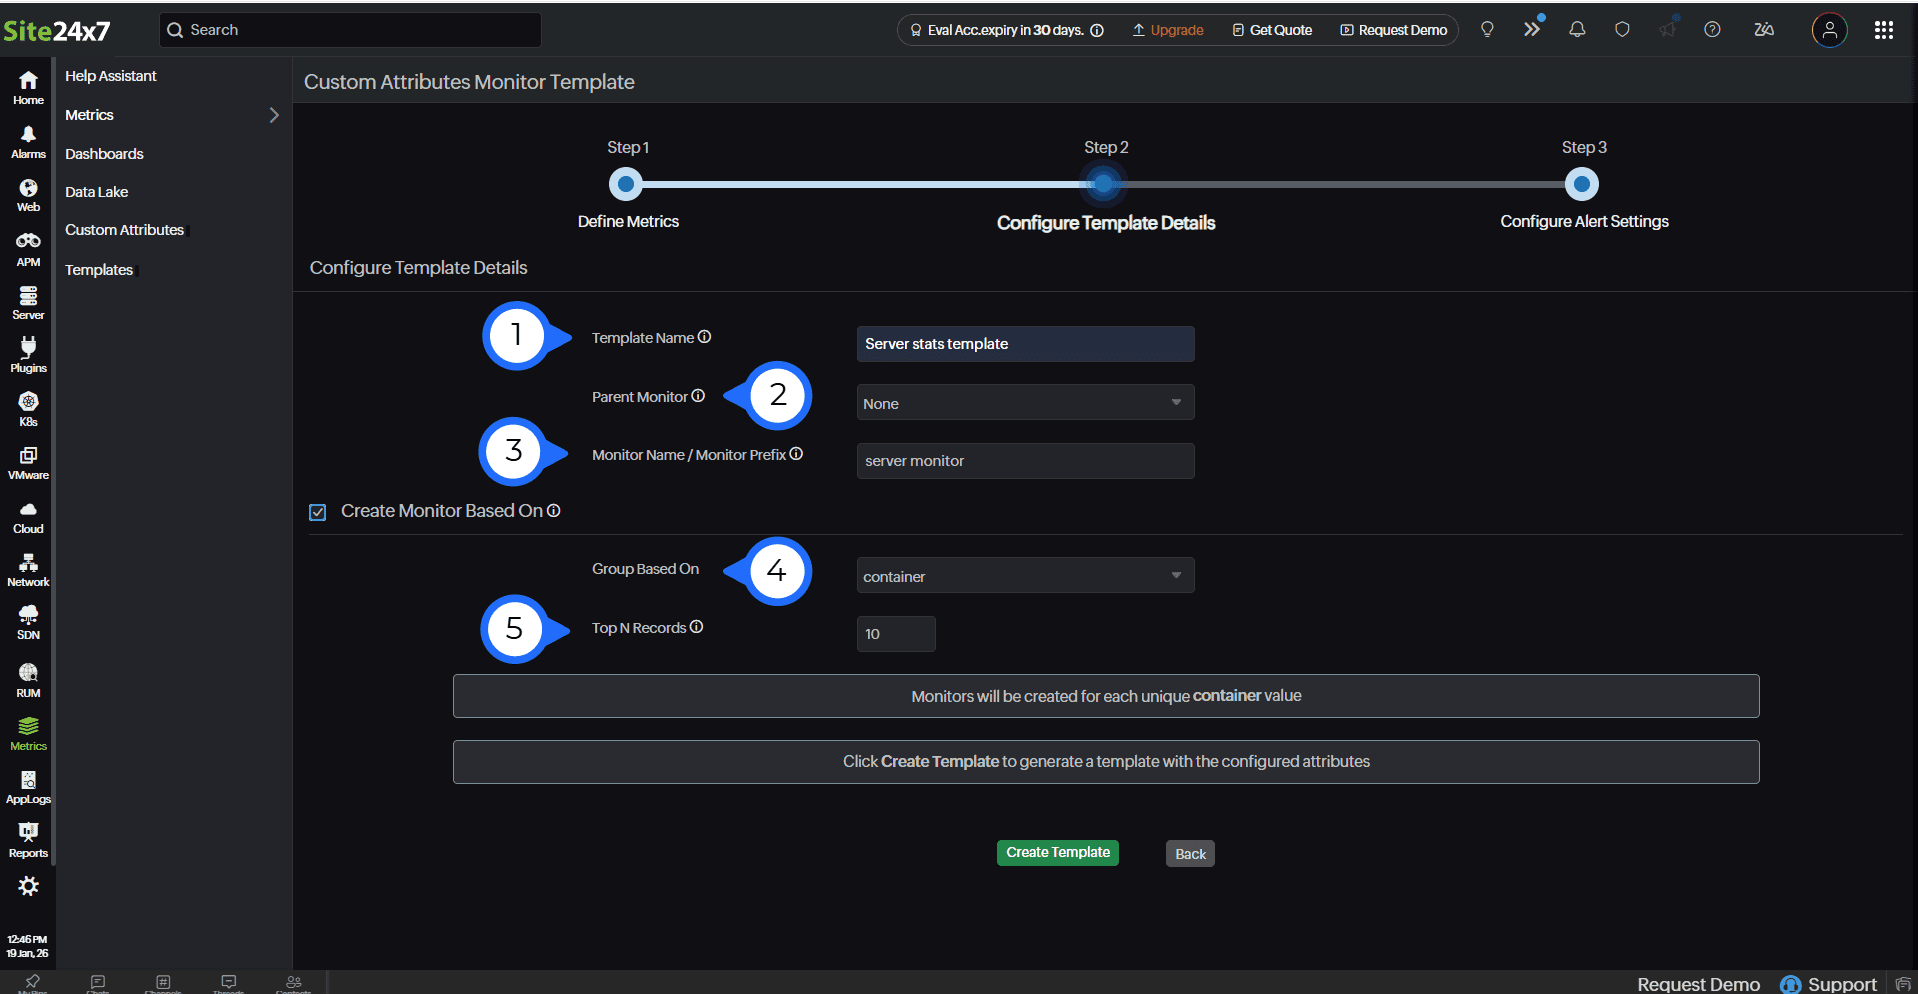
| Field number (as marked in the image) | Field | Description |
|---|---|---|
| 1 |
Template Name | Enter a name for the template. |
| 2 |
Parent Monitor | Choose the primary monitor to which this Custom Attributes monitor should be linked. If any configured attribute crosses its limit, the alert will be shown on the parent monitor instead. This prevents duplicate alerts and helps you see all related issues in one place. |
| 3 |
Monitor Name | Enter a name for the monitor. Monitors for this template will be created using this name. For group-based monitors, the provided monitor name will be used as a prefix, with the unique value of the selected tag added as a suffix. |
| 4 |
Group Based On | Use this option to create a separate monitor for each unique value of the selected tag. Each monitor name is generated using the provided monitor name as the prefix, followed by the unique tag value as the suffix. |
| 5 |
Top N Records | Specify the number of monitors to be created under this template. |
2. Click Create Template.
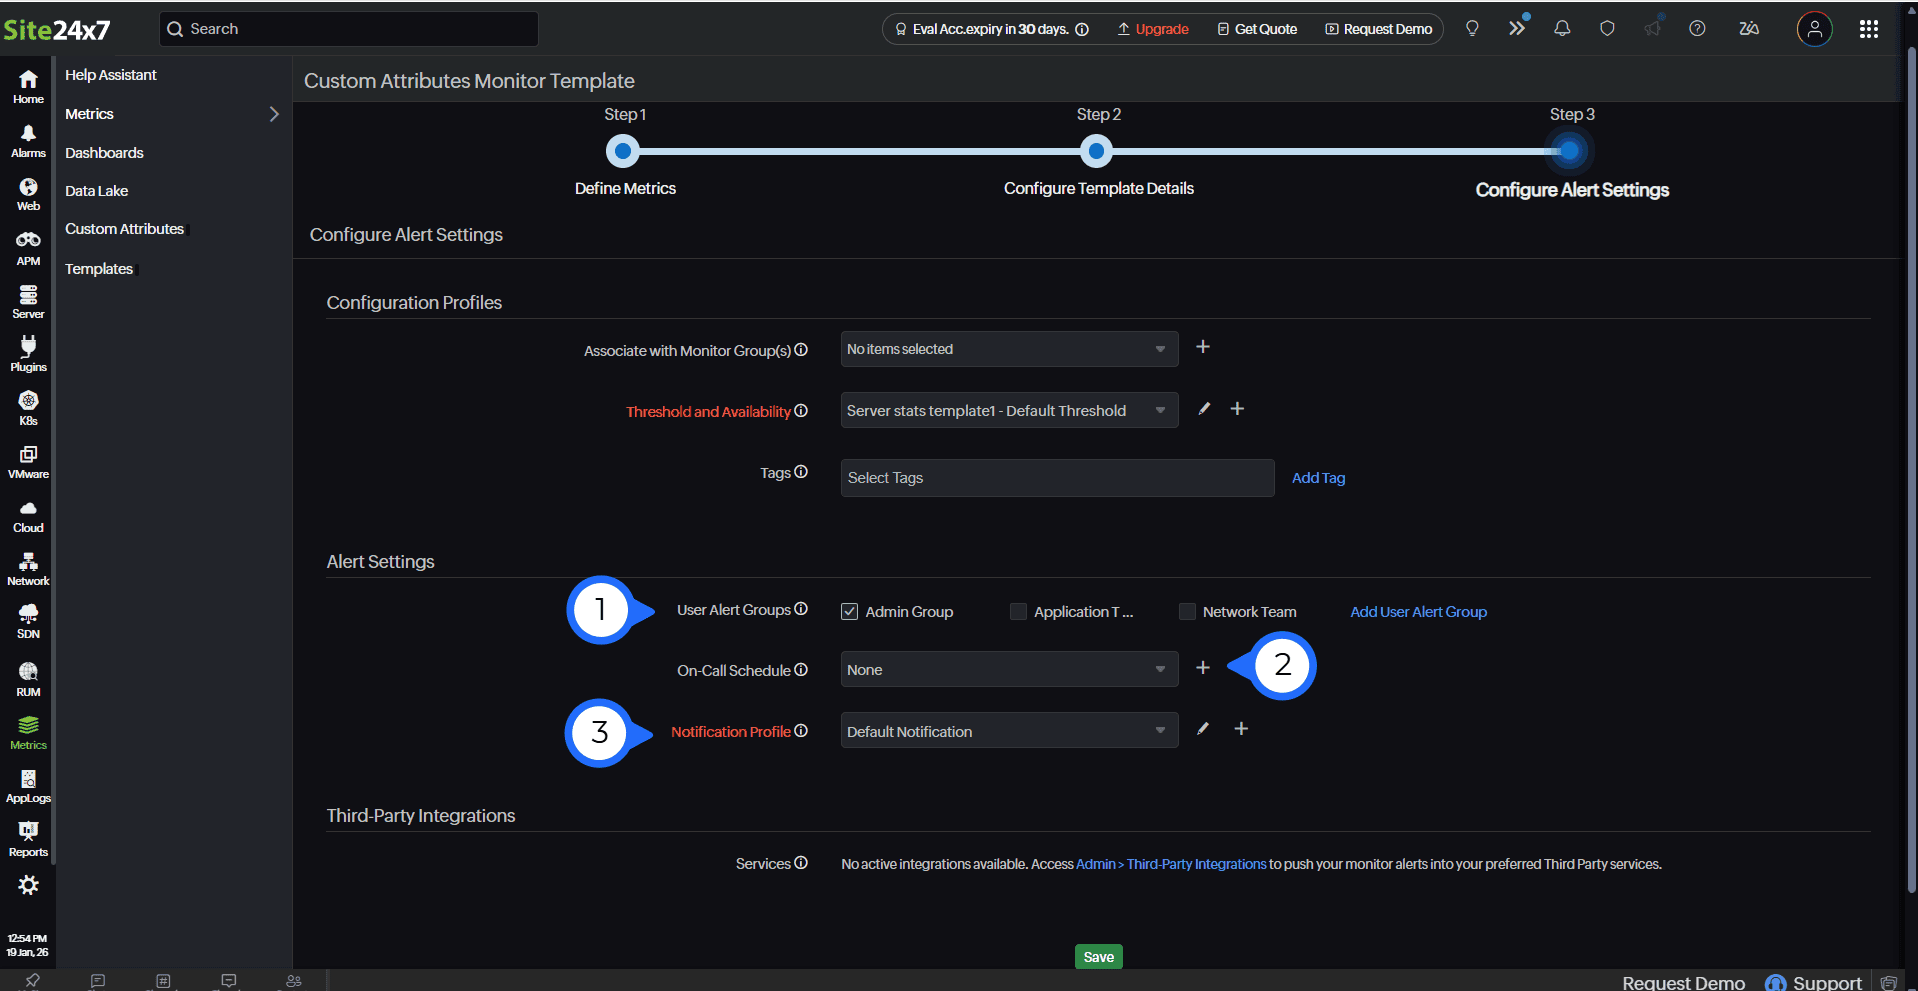
Step 3: Configure Alert Settings
Configuration Profiles
- You can associate this Custom Attributes monitor with an existing alert configuration or create a new one.
- Complete the remaining alert configuration details as required, including the Threshold and Availability configuration and Tags.
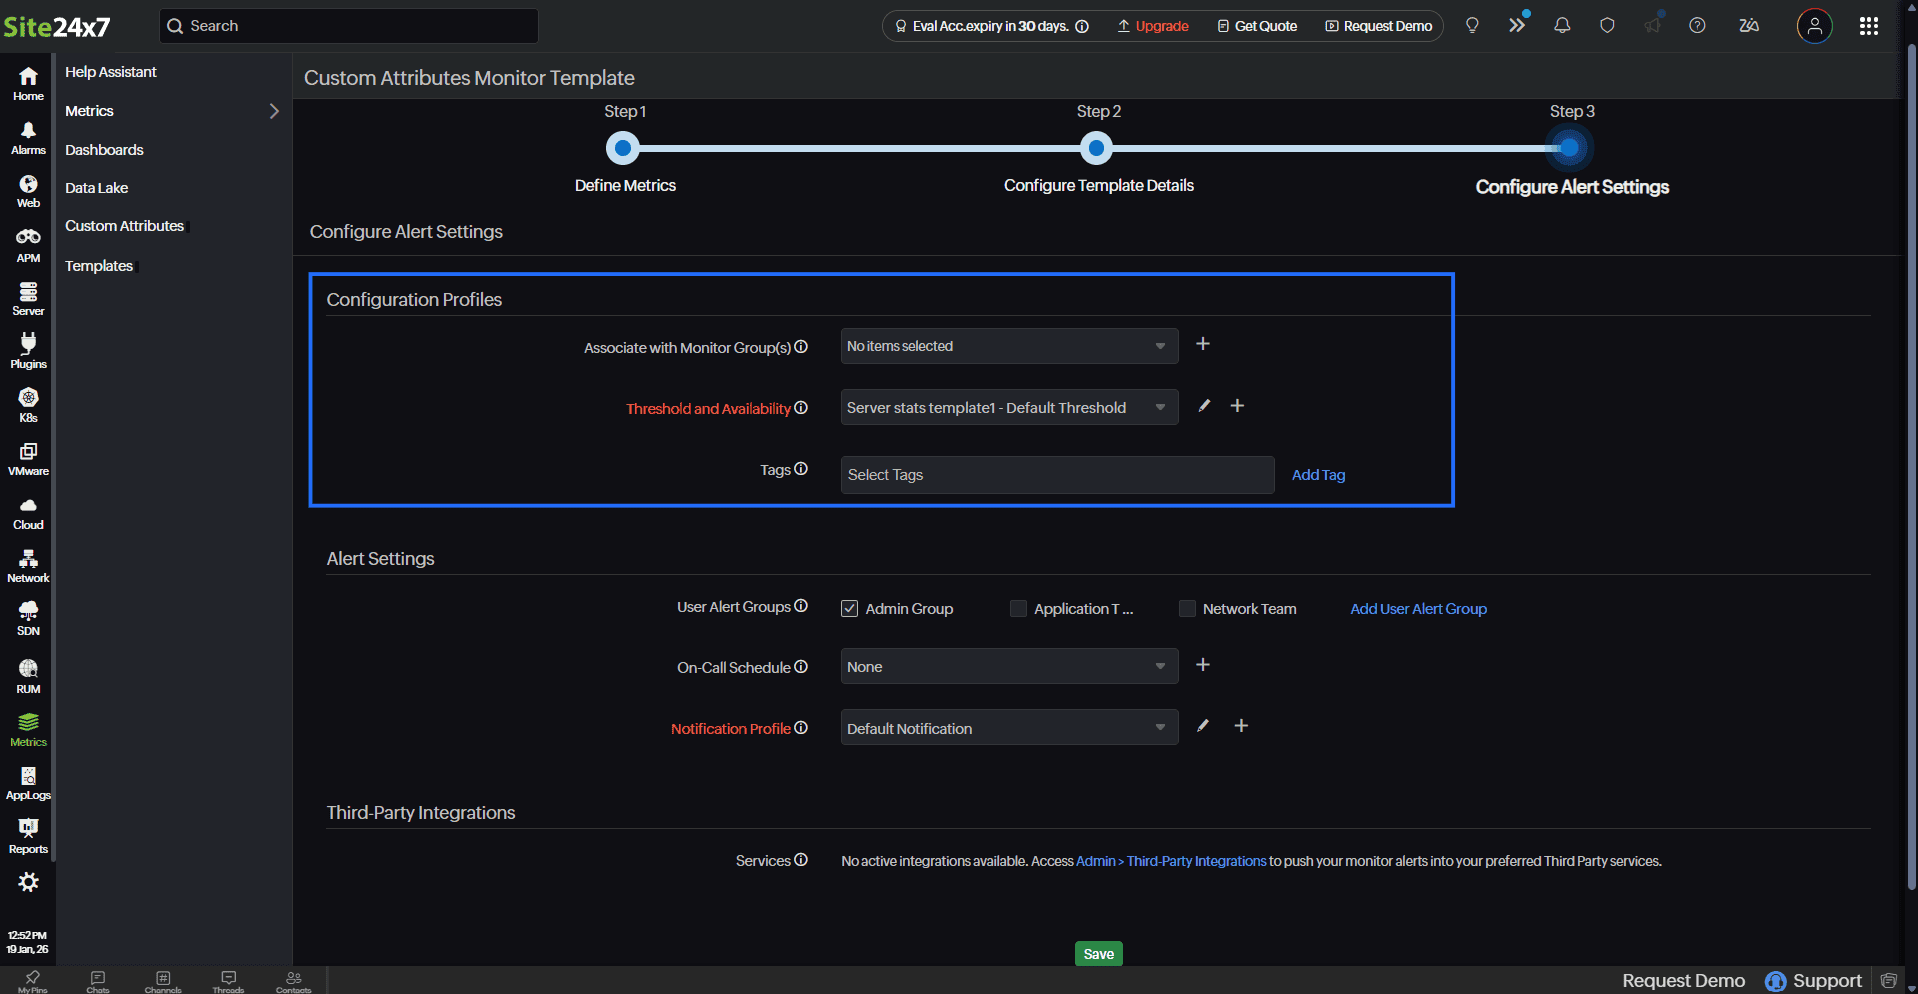
Alert Settings
- User Alert Groups: Select groups to ensure that the users in them will receive notifications when an alert is triggered. Learn more.
Note
You can also configure the notification medium for each user separately. Learn more.
- On-Call Schedule: Use this option to ensure that notifications are sent to assignees during specific shift hours, allowing them to respond to alerts or incidents quickly. Choose the schedule of your preference from this drop-down.
- Notification Profile: Configure a profile to specify who to notify and how to notify them.
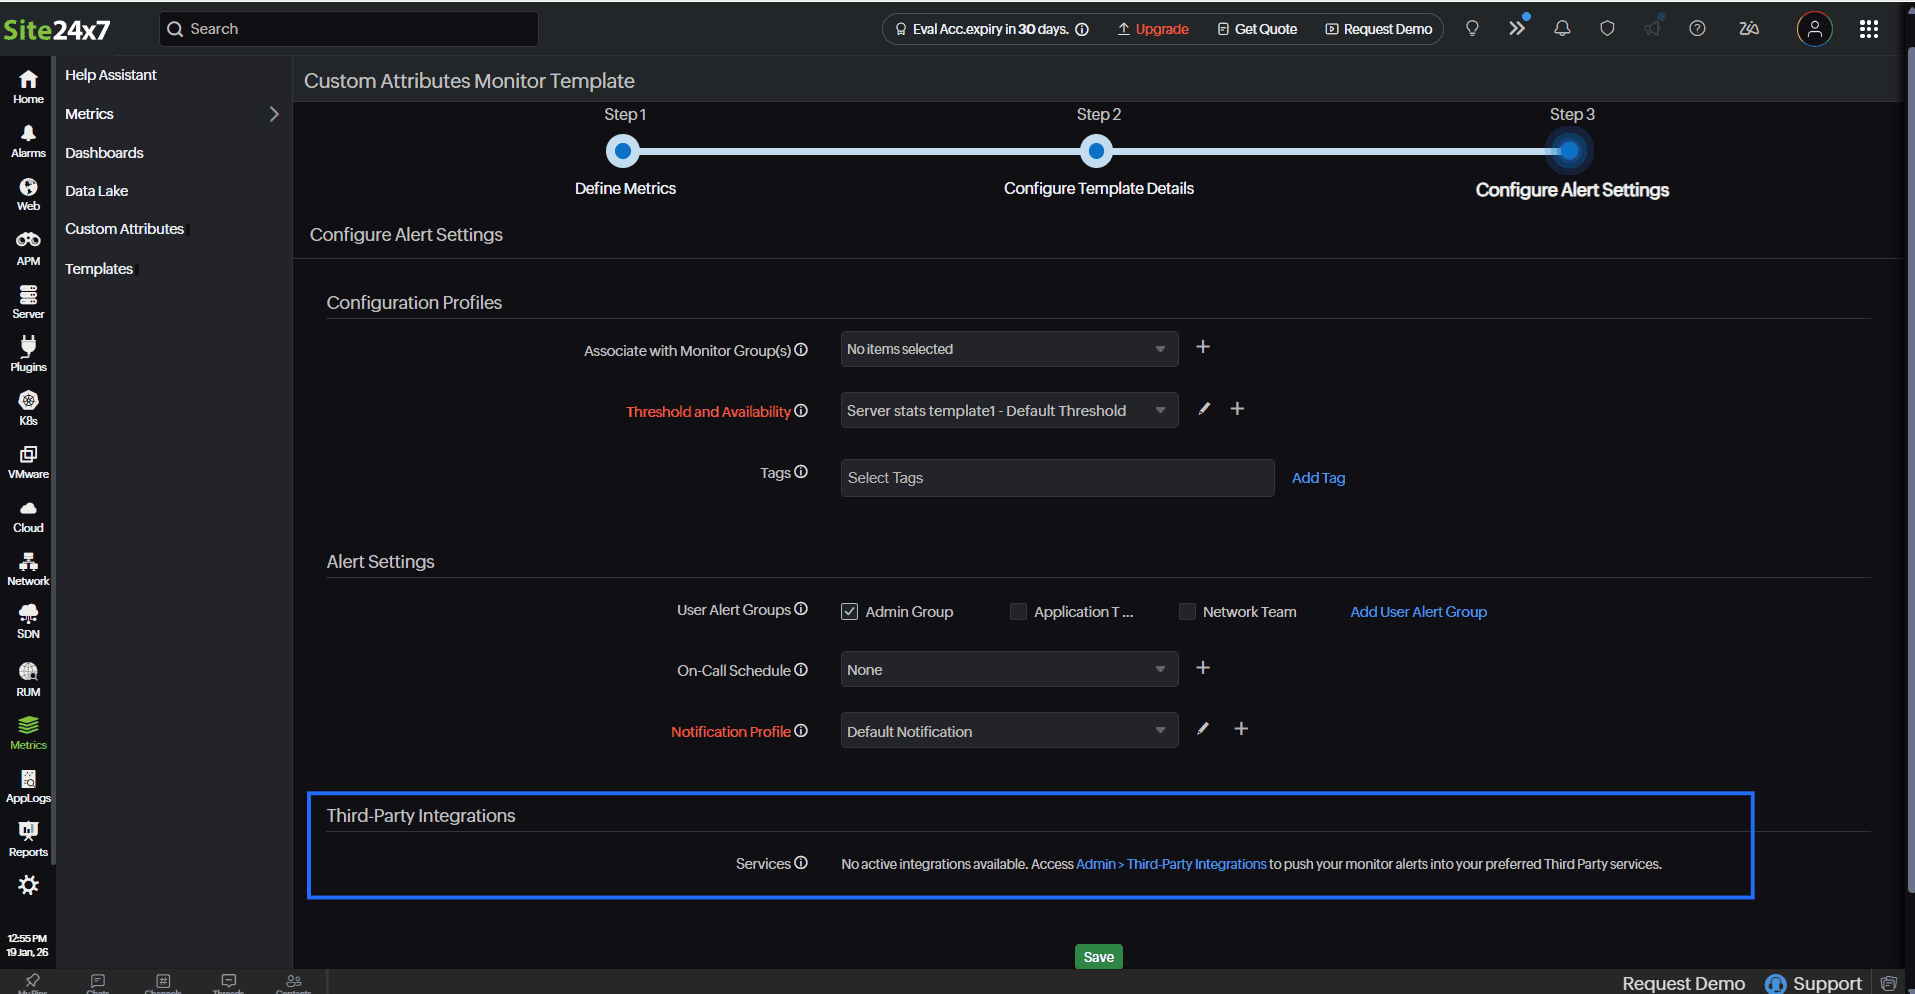
Third-Party Integrations
- You can integrate Site24x7 alarms with third-party services. By integrating your account with these third-party platforms, you can receive alert notifications through your preferred channels, collaborate with your team, automate tasks, and do much more. Learn more.
- After filling out the form, click Save.
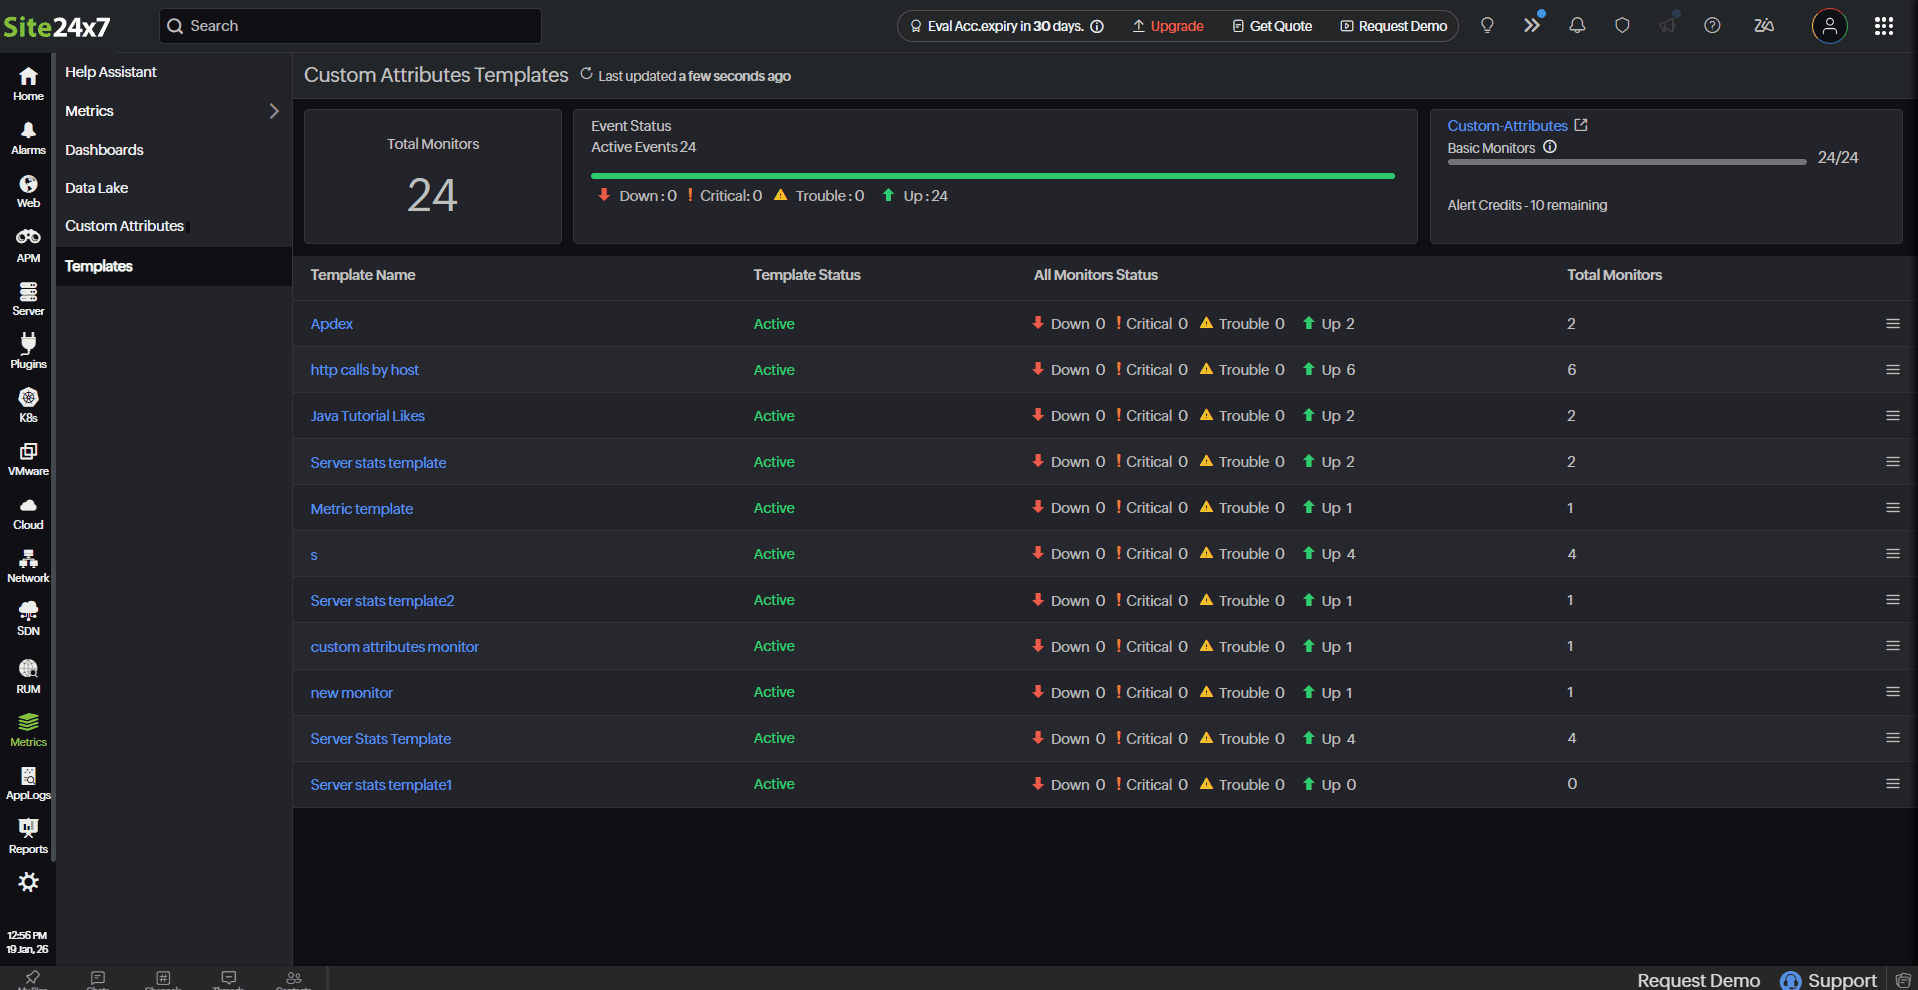
Accessing the template
You will be redirected to the Templates tab, where the Custom Attributes monitor template will be listed.
When you click Create Template, you can view the Custom Attributes monitors.
If you open a template immediately after creating it, the monitor may not be visible at first. This is expected as the system takes a few seconds to create the monitor in the background.
You can also go to Custom Attributes to view the monitor created with the specified name.
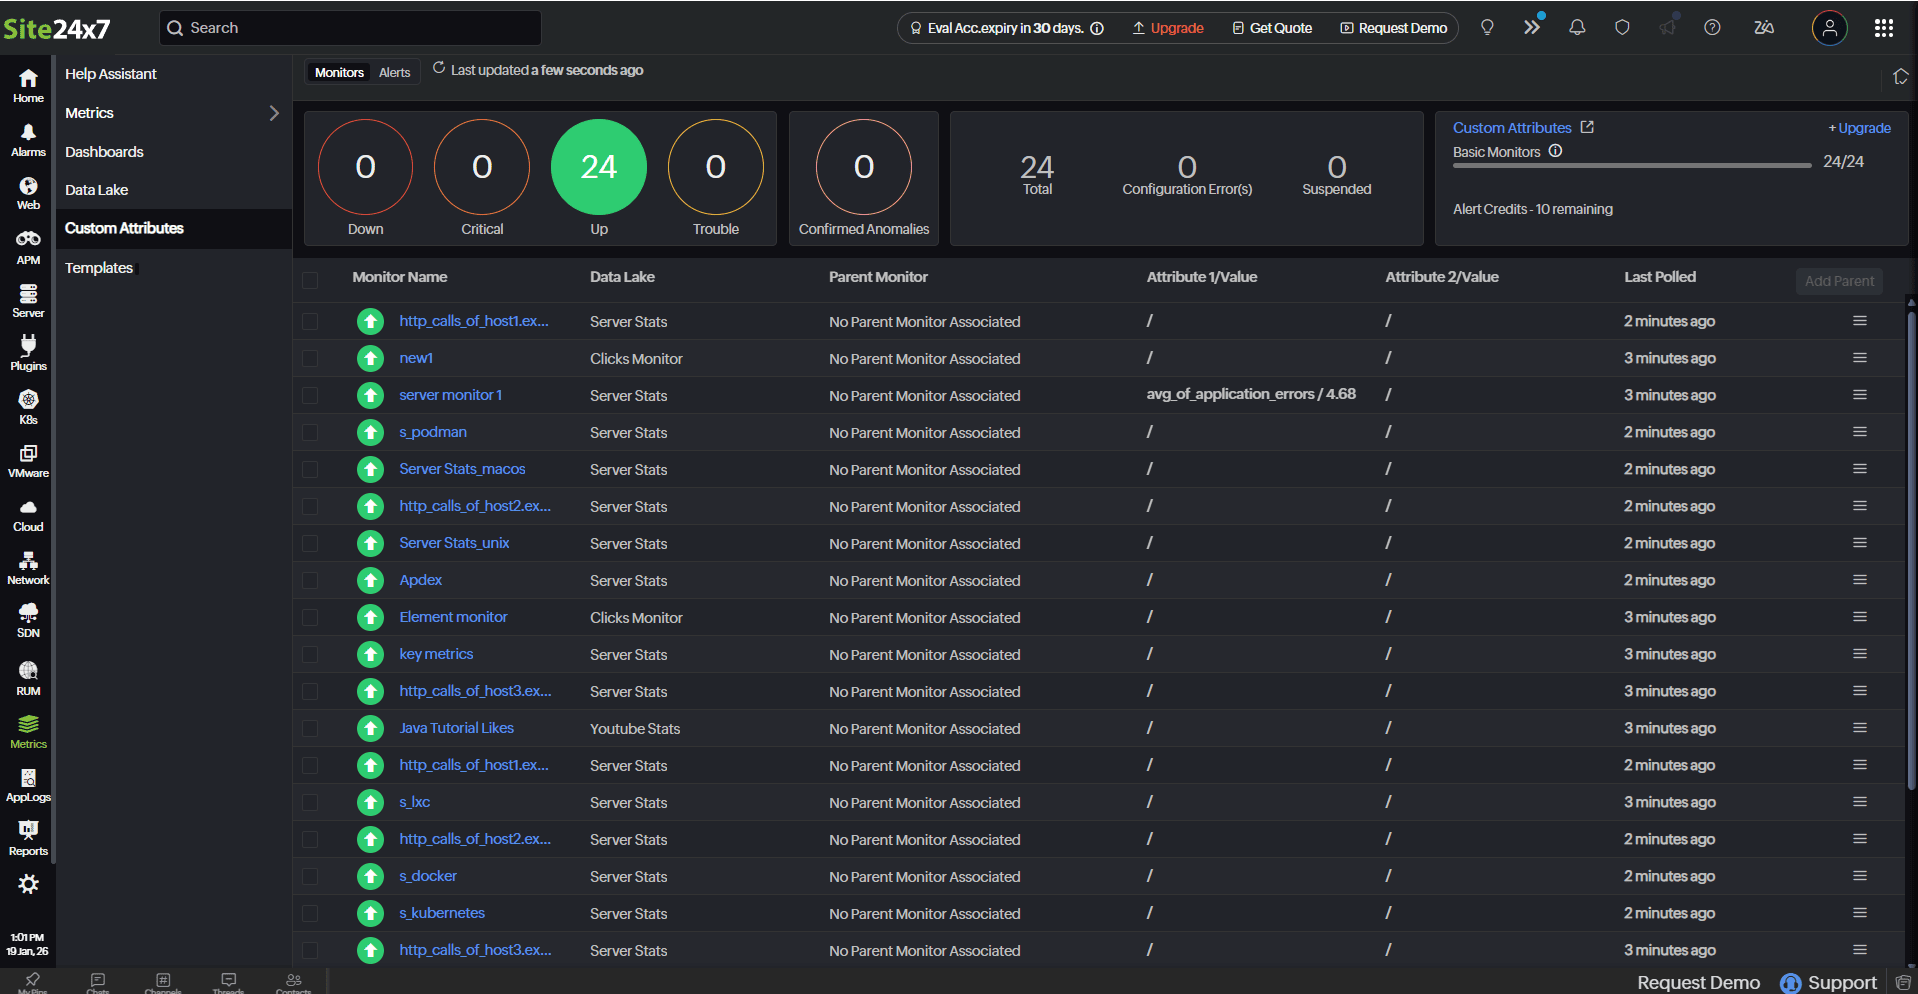
Monitors view
You can get a holistic view of your Custom Attributes monitors. The dashboard categorizes your monitors based on their status (Up, Trouble, Critical, or Down). This gives you an overall summary of the Data Lake monitor (data source), its parent monitor, the top two attributes and their values, and the last time it was polled.
Edit a monitor
You can update the configurations on the Edit Custom Attributes Monitor page.
- Click the hamburger icon
 beside the monitor name.
 - Select Edit.
- On the Edit Custom Attributes Monitor page, update the required fields.
- Click Save.
Delete a monitor
You can delete any Custom Attributes monitor that is no longer needed.
- Click the hamburger icon
 beside the monitor name.
 - Select Delete.
Alerts view
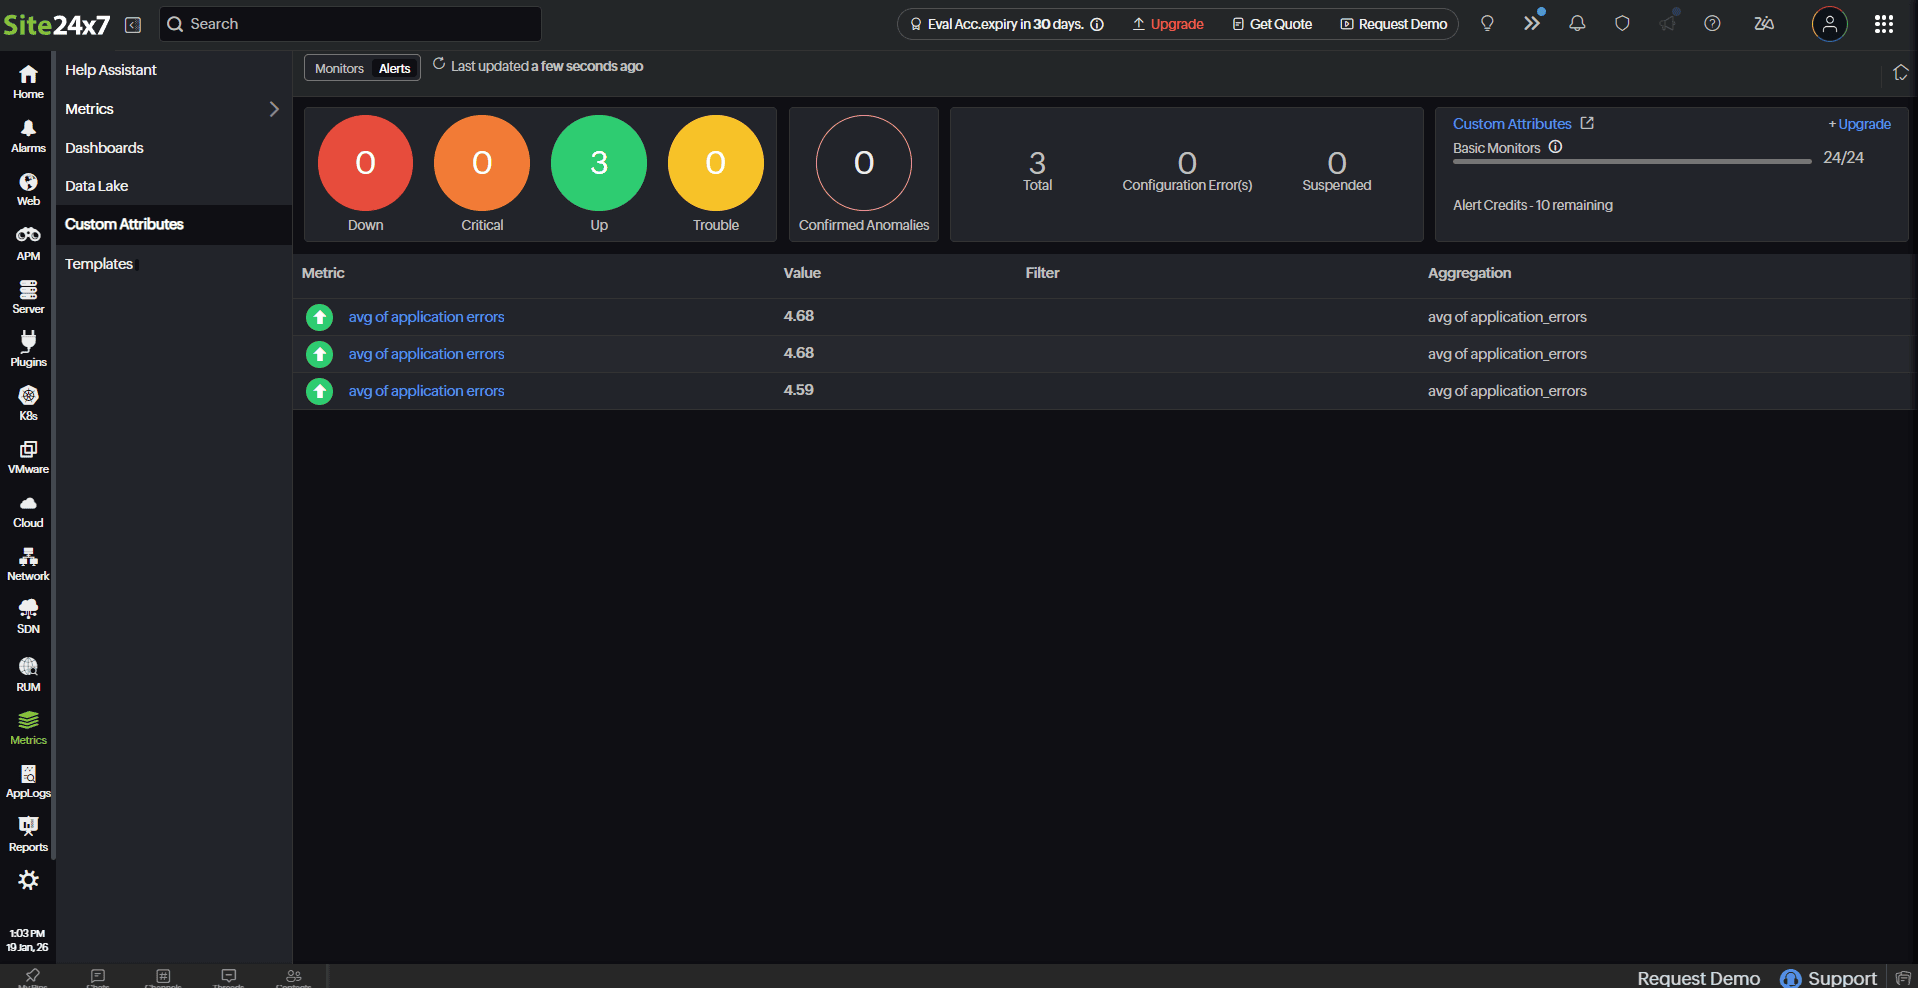
This view gives a comprehensive list of Custom Attributes configured in all monitors. You can view details like the aggregated value, monitor name, configured filter, and aggregation type.
Performance metrics
You can click the required monitor to view the performance metrics of the Custom Attributes added to it. In the right corner, you can also decide on the timeframe from which you need the metrics.
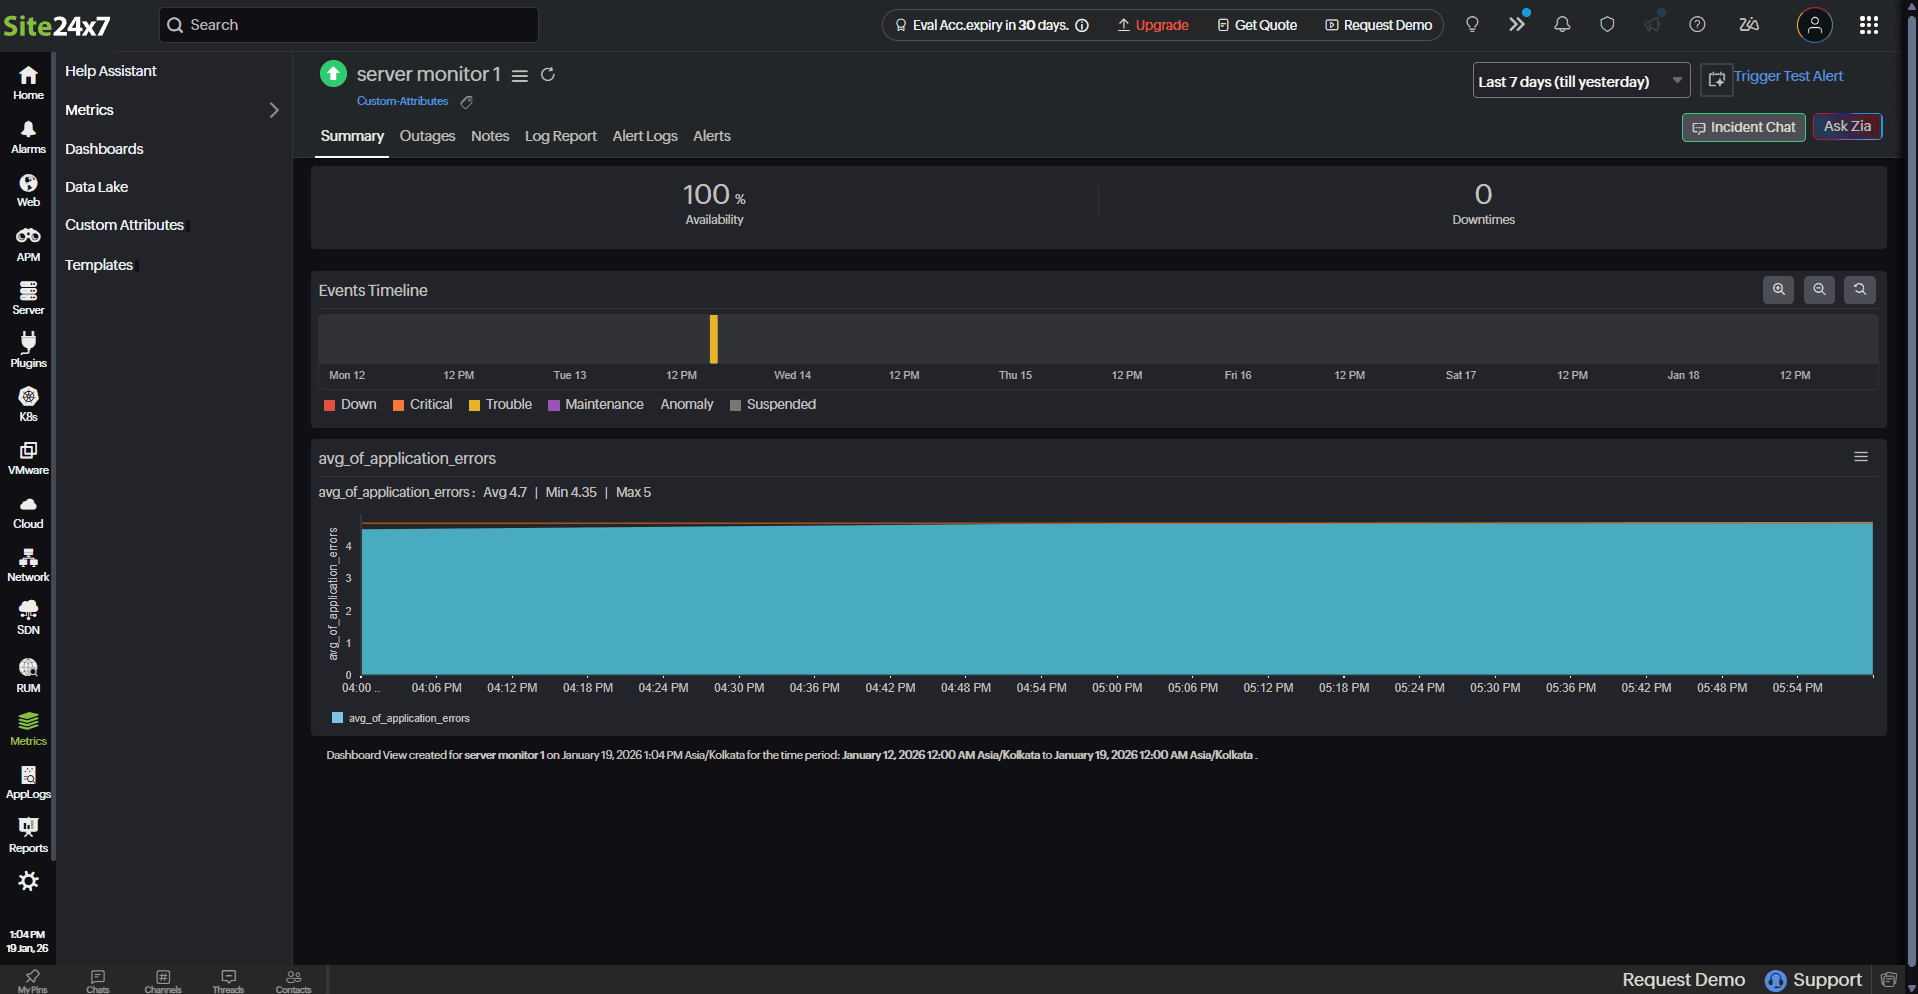
Summary tab
This tab includes a summary page with report charts where you can view numeric widgets and single-line charts for all the configured metrics.
Outages tab
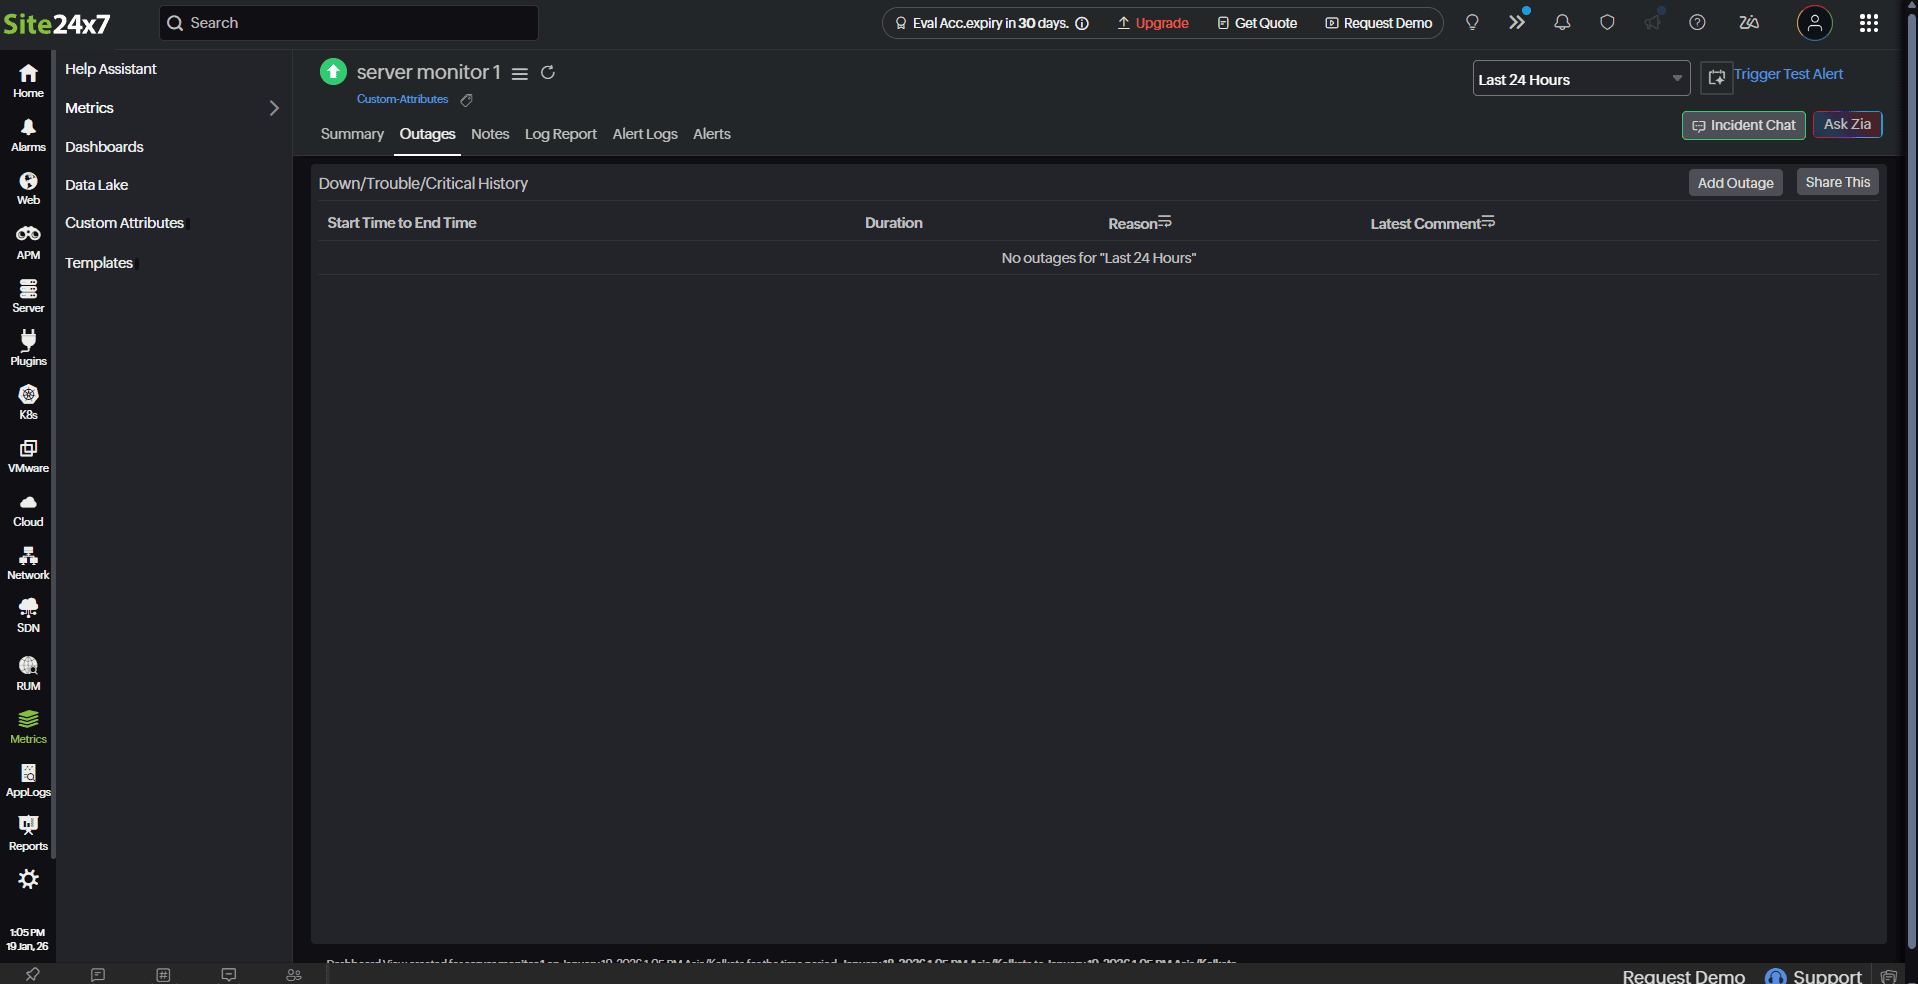
This tab gives an overall summary of the Down/Trouble/Critical History of the selected monitor with information on the Duration, Reason, and Latest Comment.
You can click the hamburger icon ![]() to Add/Edit Comments or even Delete any outages if they are irrelevant.
to Add/Edit Comments or even Delete any outages if they are irrelevant.
Related articles
