Salesforce Logs
Salesforce offers a REST API to access your Salesforce event data. To manage and monitor the Salesforce event logs effectively, configure the Salesforce logs in Site24x7 by following the steps in this document. Learn more about log management with Site24x7.
Prerequisites
You must have a Salesforce account and its Event Monitoring add-on to access all event types in its EventLogFile object, LoginEvent object, and Event Monitoring Analytics App. Refer to these documents to enable Event Monitoring and to create a dedicated user for the integration.
Then, you must create a connected app in Salesforce to generate a consumer key and a consumer secret. Later, you have to mention these tokens in a configuration file to configure the Salesforce logs.
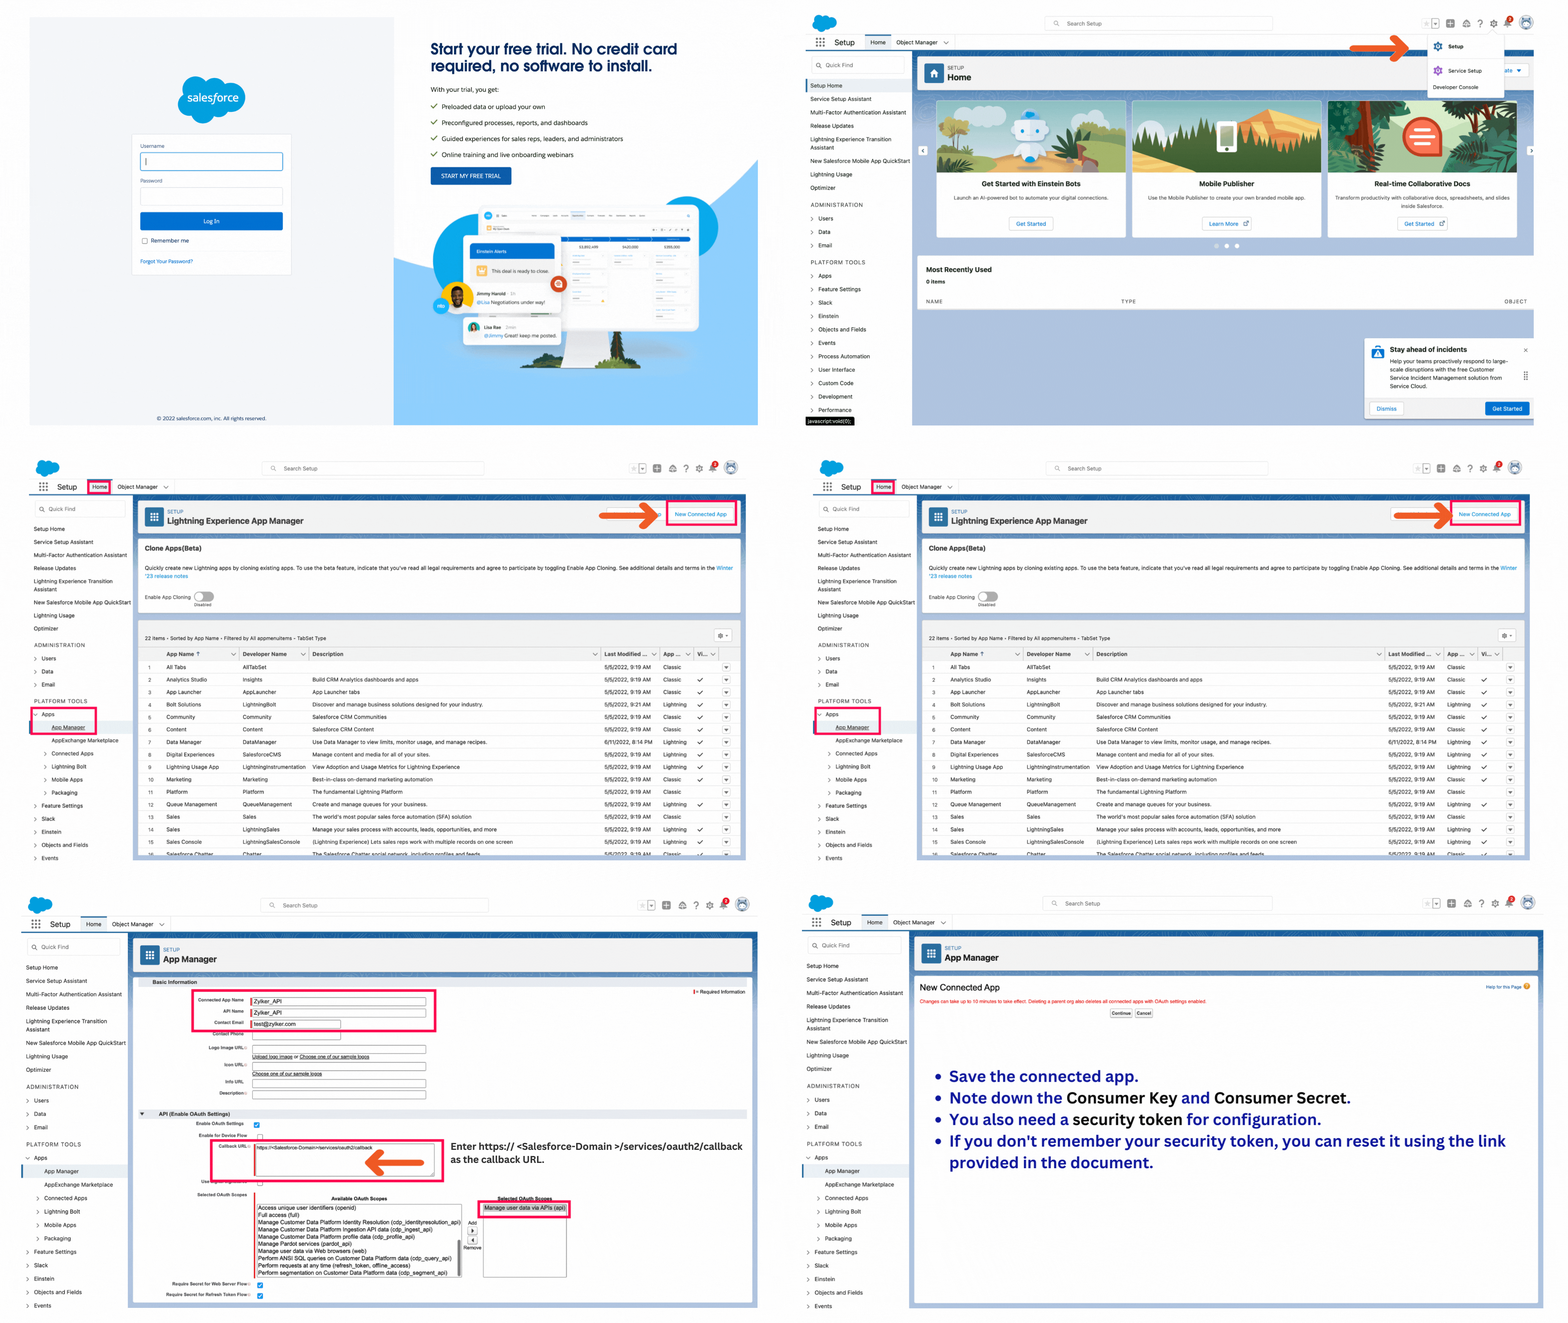
Follow the steps below to create the connected app:
- Log in to your Salesforce account.
- In your Lightning Experience version, go to Setup > Home > Apps > App Manager > New Connected App.
- Enter the Connected App Name, API Name, and Contact Email.
- Click the Enable OAuth Settings check box.
- Enter the Callback URL: https://<Salesforce-Domain>/services/oauth2/callback.
- Select the OAuth Scope Manage user data via APIs (api).
- Save the connected app and note down the consumer key and consumer secret.
You also need a security token to configure the Salesforce logs. If you do not remember your security token, you can reset the user security token here.

Salesforce plugin installation
- Download and install the Site24x7 Server Monitoring agent (Windows | Linux).
- Create a directory named Salesforce under the Site24x7 Server Monitoring agent's plugin directory.
For Linux: /opt/site24x7/monagent/plugins/
For Windows: C:\Program Files (x86)\Site24x7\WinAgent\monitoring\plugins\ - Download the Salesforce.py and Salesforce.cfg files and place them in the Salesforce directory.
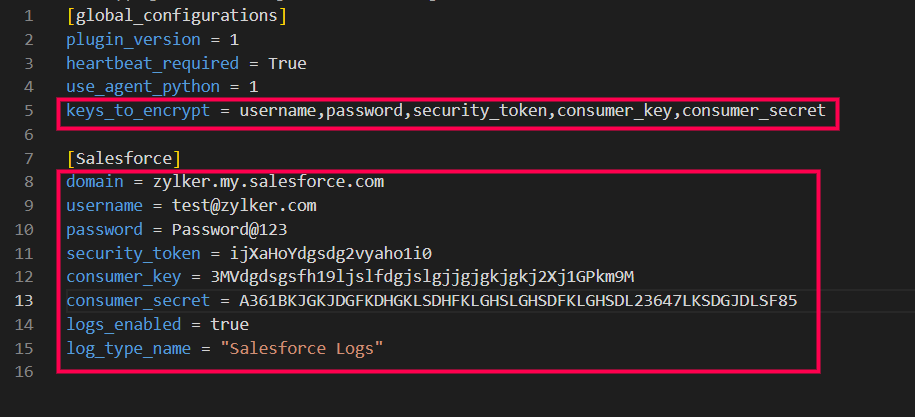
- In the Salesforce.cfg file, replace the values for the variables, such as your Salesforce domain, username, password, security_token, consumer_key, and consumer_secret, by following the instructions in the previous section.
- Also in the Salesforce.cfg file, set logs_enabled to true and log_type_name to Salesforce Logs. These values automatically create a log profile and a log type for Salesforce logs in Site24x7.

Once the plugin file is downloaded, the agent will note the change during the next data collection, and you can view the logs in the Site24x7 web client. The agent will encrypt all of the keys of your Salesforce credentials listed under keys_to_encrypt to prevent identity theft.
Perform a query language search with Salesforce Logs as the log type and start viewing your log data on an exclusive dashboard. Save your searches and configure alerts based on them. Salesforce supports more than 50 event types, which you can view here.
Salesforce log monitoring dashboard
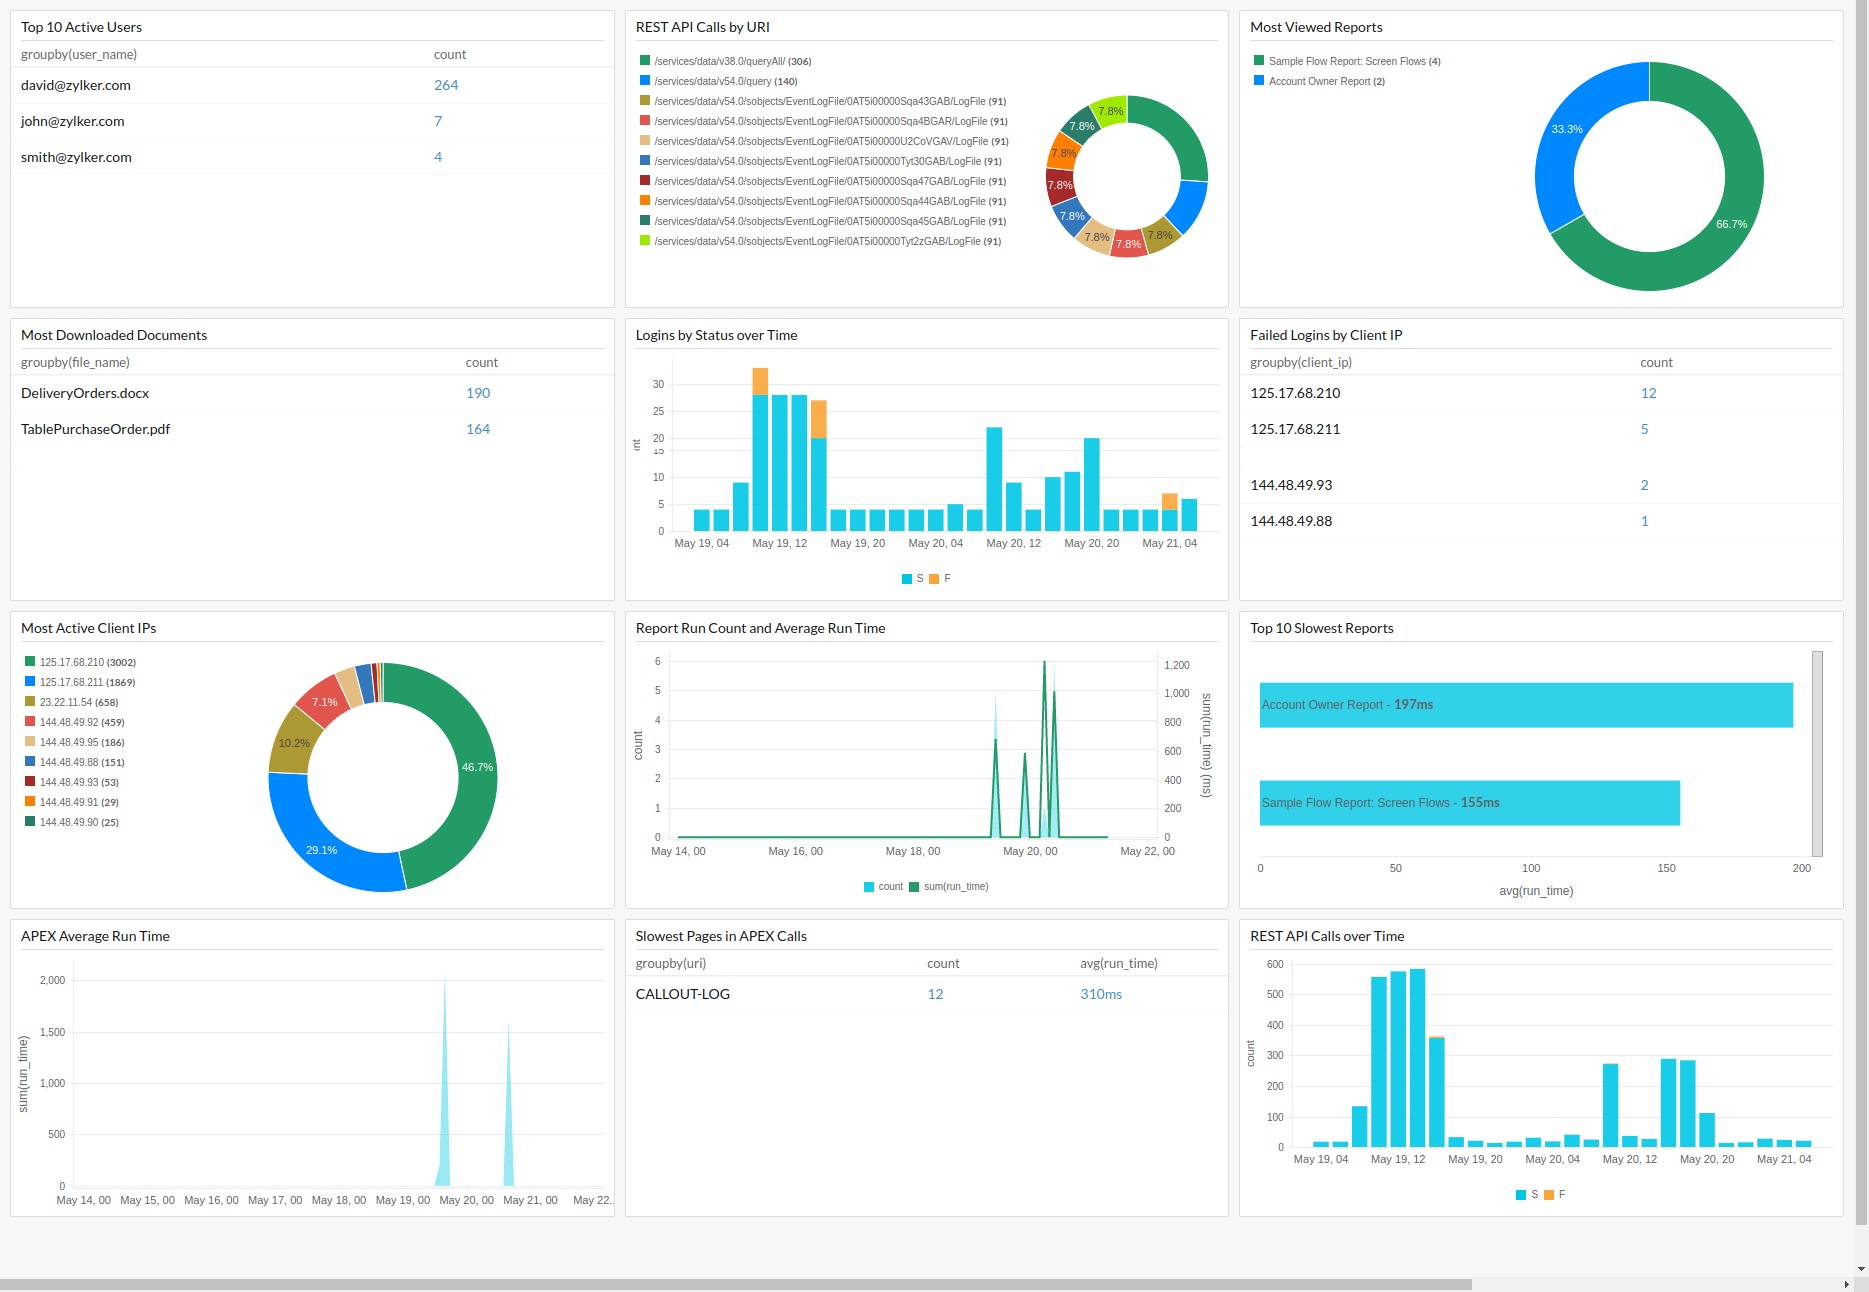
Here is a list of the widgets that are available by default on the Salesforce log monitoring dashboard:
- Top 10 Active Users
- REST API Calls by URI
- Most Viewed Reports
- Most Downloaded Documents
- Logins by Status over Time
- Failed Logins by Client IP
- Most Active Client IPs
- Report Run Count and Average Run Time
- Top 10 Slowest Reports
- APEX Average Run Time
- Slowest Pages in APEX Calls
- REST API Calls over Time

