Collecting RDS MySQL Slow Query Logs
The slow query log contains any queries that took longer to execute than a threshold limit. Collecting these logs will help you to figure out the queries that need fine-tuning. You can now collect RDS MySQL slow query logs from the CloudWatch log group and send them to Site24x7 for monitoring via the Lambda function. Learn more about log management with Site24x7.
Prerequisites
You must associate the parameter group with your MySQL instance and change the required parameters by following the instructions.
Steps to create
Follow the below steps to monitor the RDS MySQL slow query logs:
- Export the RDS MySQL slow query logs to CloudWatch Log Group
- Create a log profile to collect the logs
- Configure the Lambda function to send a log file to Site24x7
Export the RDS MySQL slow query logs to CloudWatch Log Group
As a first step, you must export the slow query logs to the CloudWatch log group. To do that:
- Open the Amazon RDS console by clicking the following link: https://console.aws.amazon.com/rds/.
- In the navigation pane, choose Databases, and then choose the MySQL DB instance that you want to enable slow query log.
- Click Modify.
- In the Log exports section, choose the logs you want to start publishing to CloudWatch Logs.

- Click Continue, and then click Modify DB Instance on the summary page.
Completing the above steps will start exporting the RDS MySQL slow query logs to the CloudWatch log group.
Create a log profile
Next, you must create a log profile to collect the RDS MySQL Logs. Navigate to Admin > AppLogs > Log Profile > Add Log Profile, and follow the instructions below:
- Profile Name: Enter a name for your Log Profile.
- Log Type: Choose RDS MySQL Logs.
- Log Source: Choose Amazon Lambda.
- Click Save.
Configure the Lambda function
Next, you need to configure the Lambda function to send a log file collected in the CloudWatch group to Site24x7. To do that:
- Choose Lambda from the Services drop-down list, then click Create Function. Select Author from scratch, define a name for the function, and choose Python 3.9 as the Runtime.
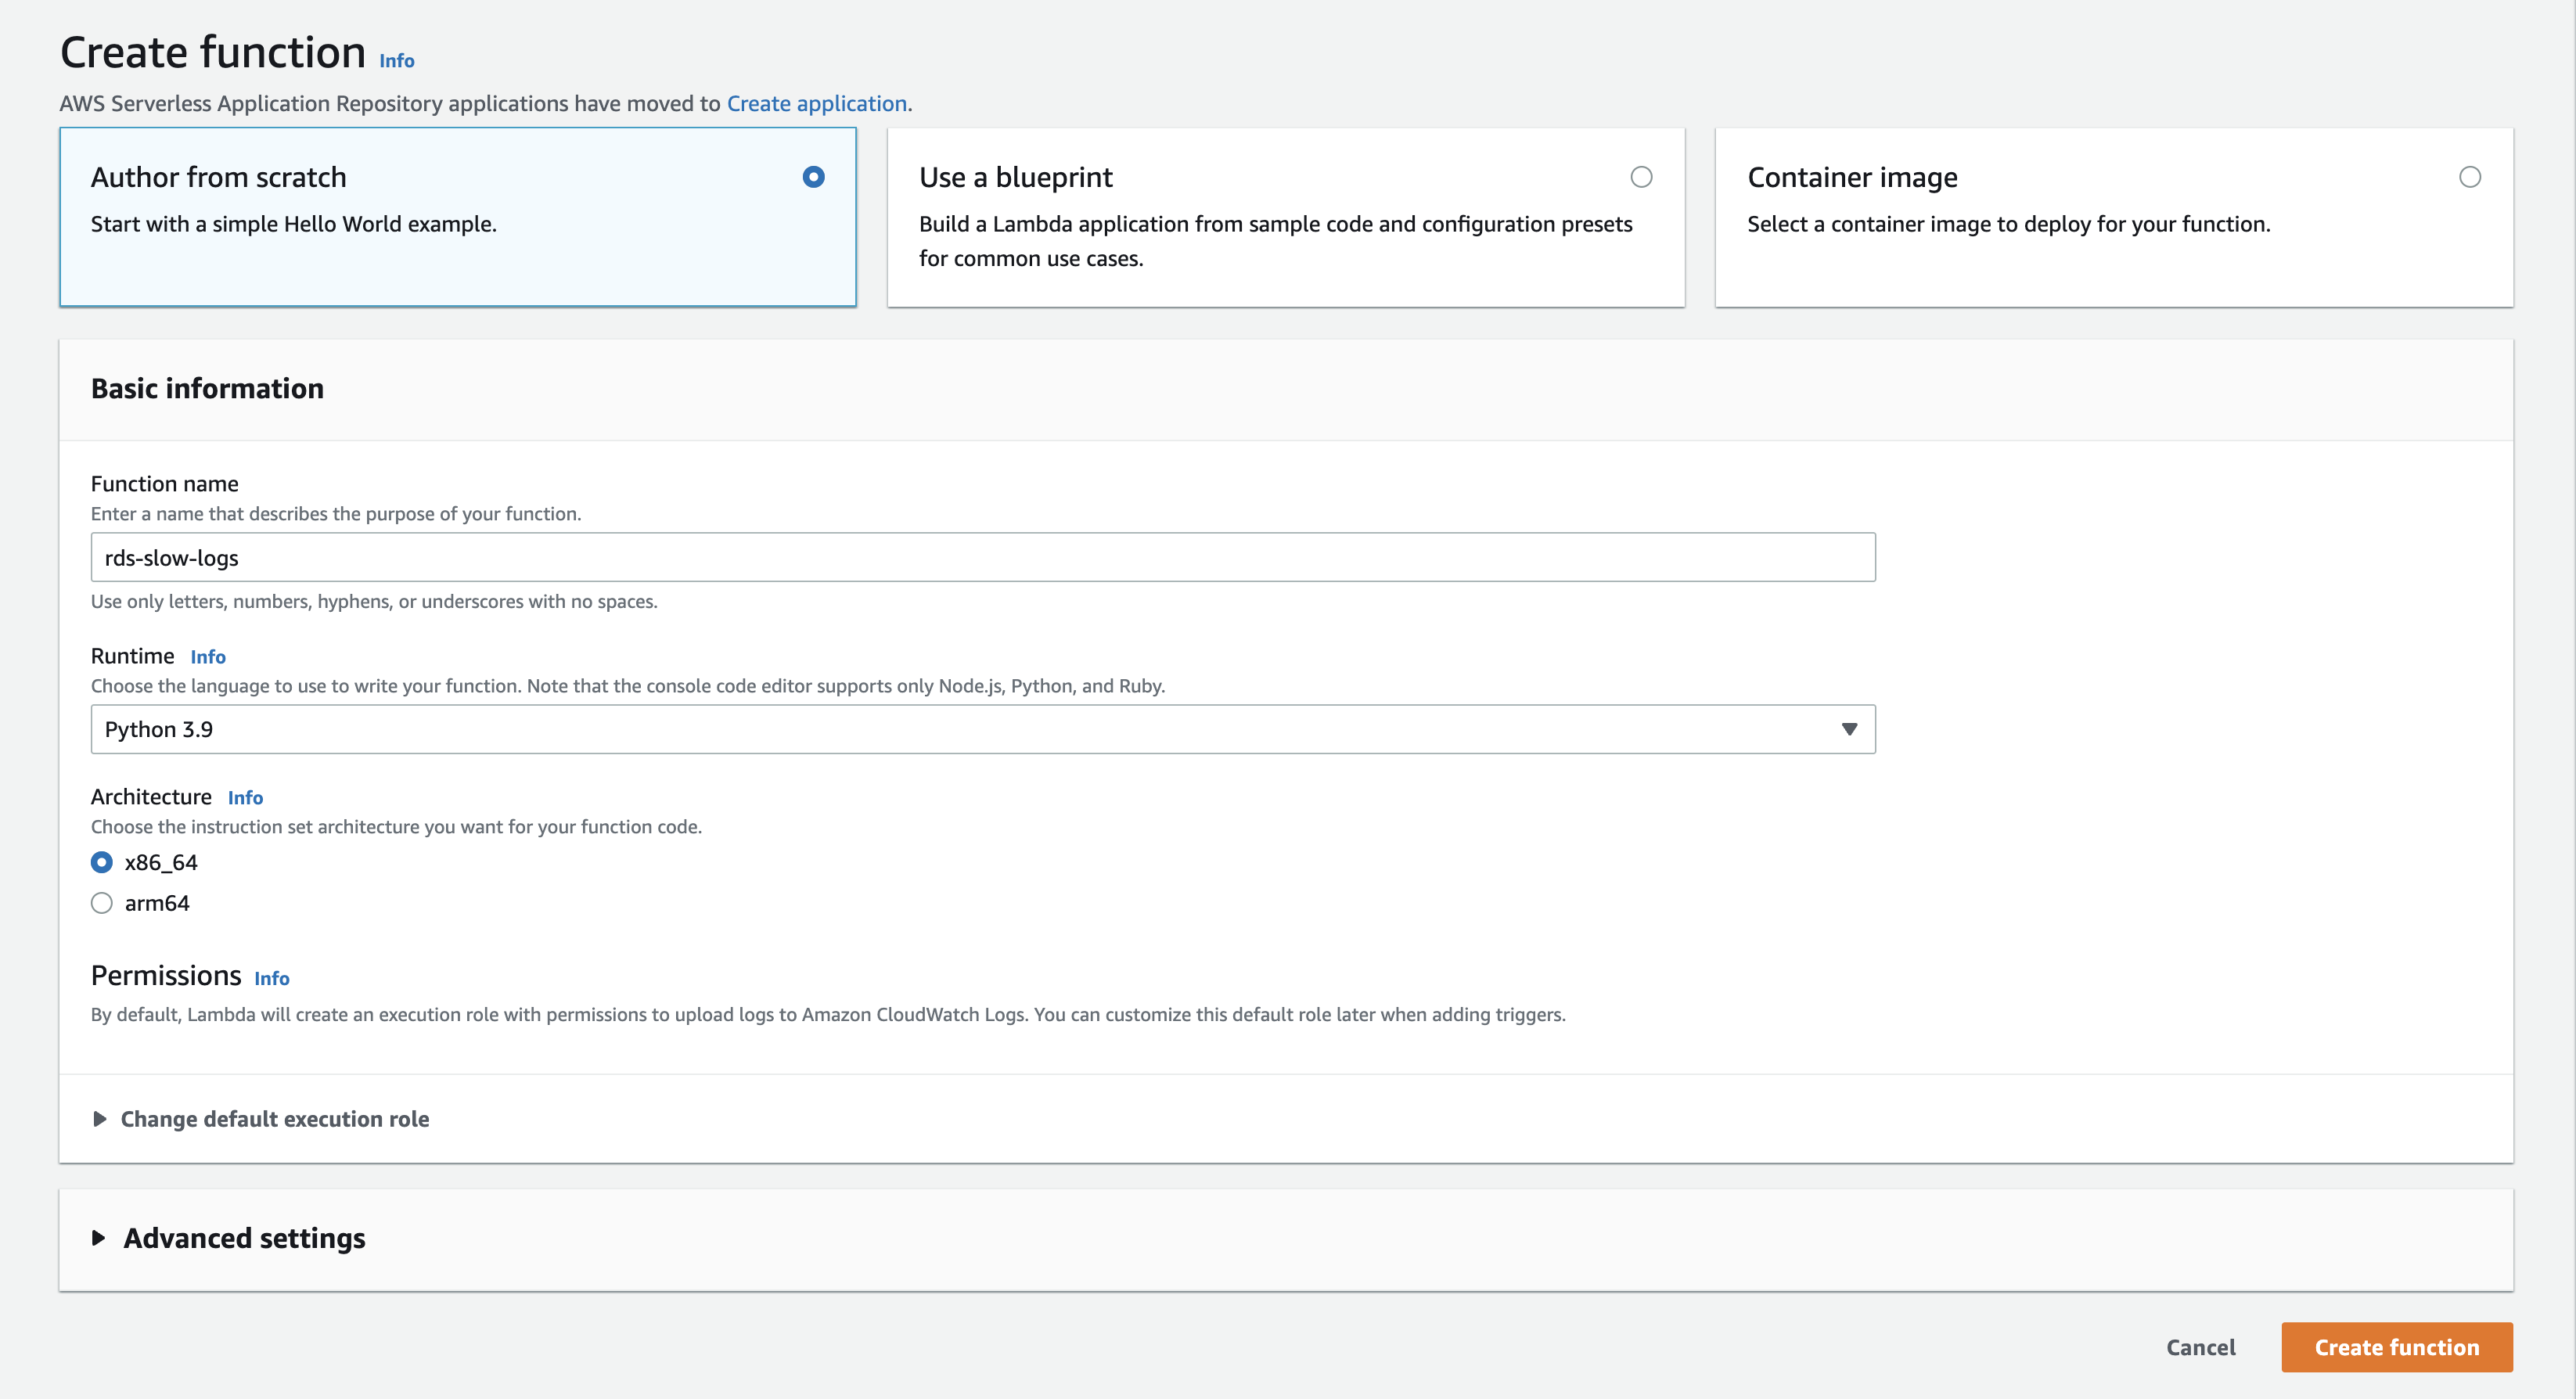
- Permissions: You can choose an existing IAM role or create a new role with basic Lambda permissions. You also have the option to create a new user role and extend permission to other services as well.
- Add triggers: Scroll down to choose CloudWatch Logs.
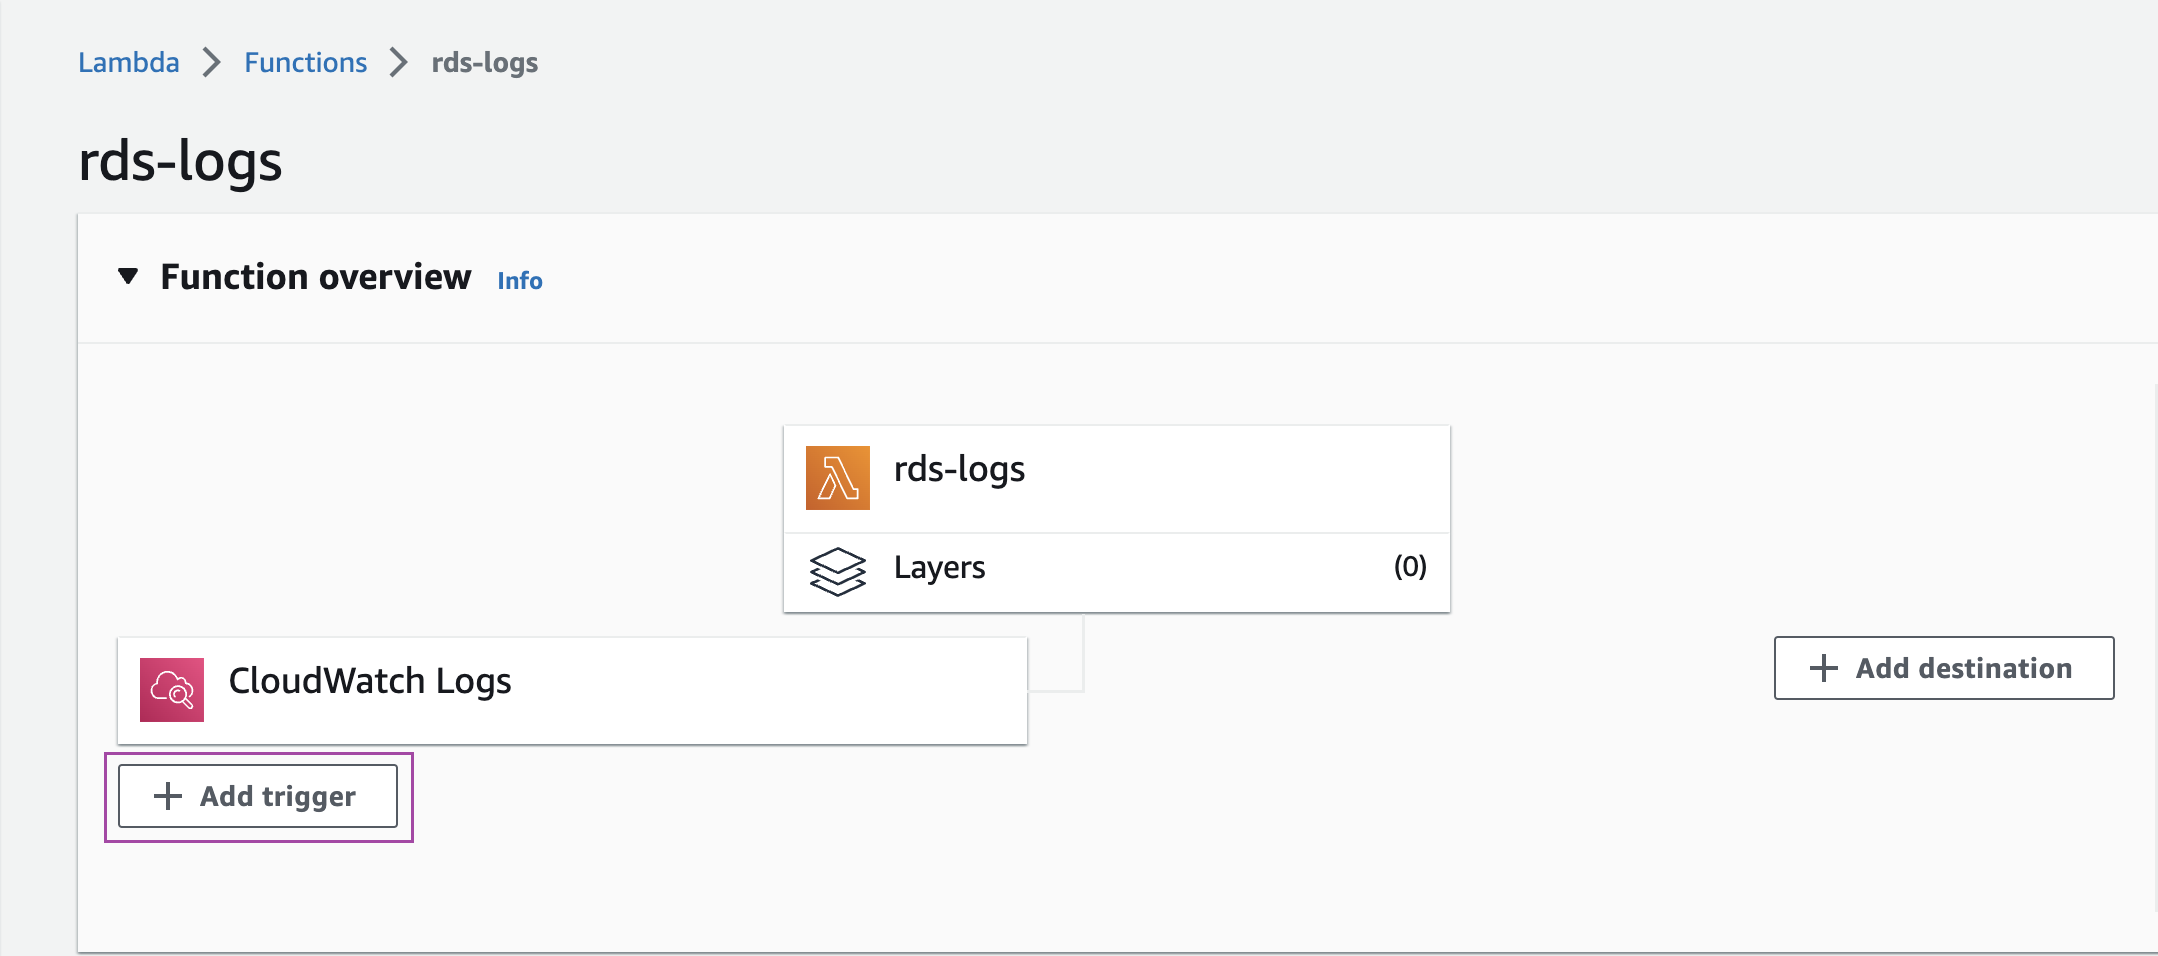
- Configure Triggers
- Log group: Select the CloudWatch log group that acts as the source. Here we should select the log group in which slow query logs are written. Any event triggered in the selected group will call the Lambda Function.
- The log group name format will look like: (/aws/rds/instance/<db_instance_name>/slow)
- Filter name: Choose a name for your filter.
- Click Add.
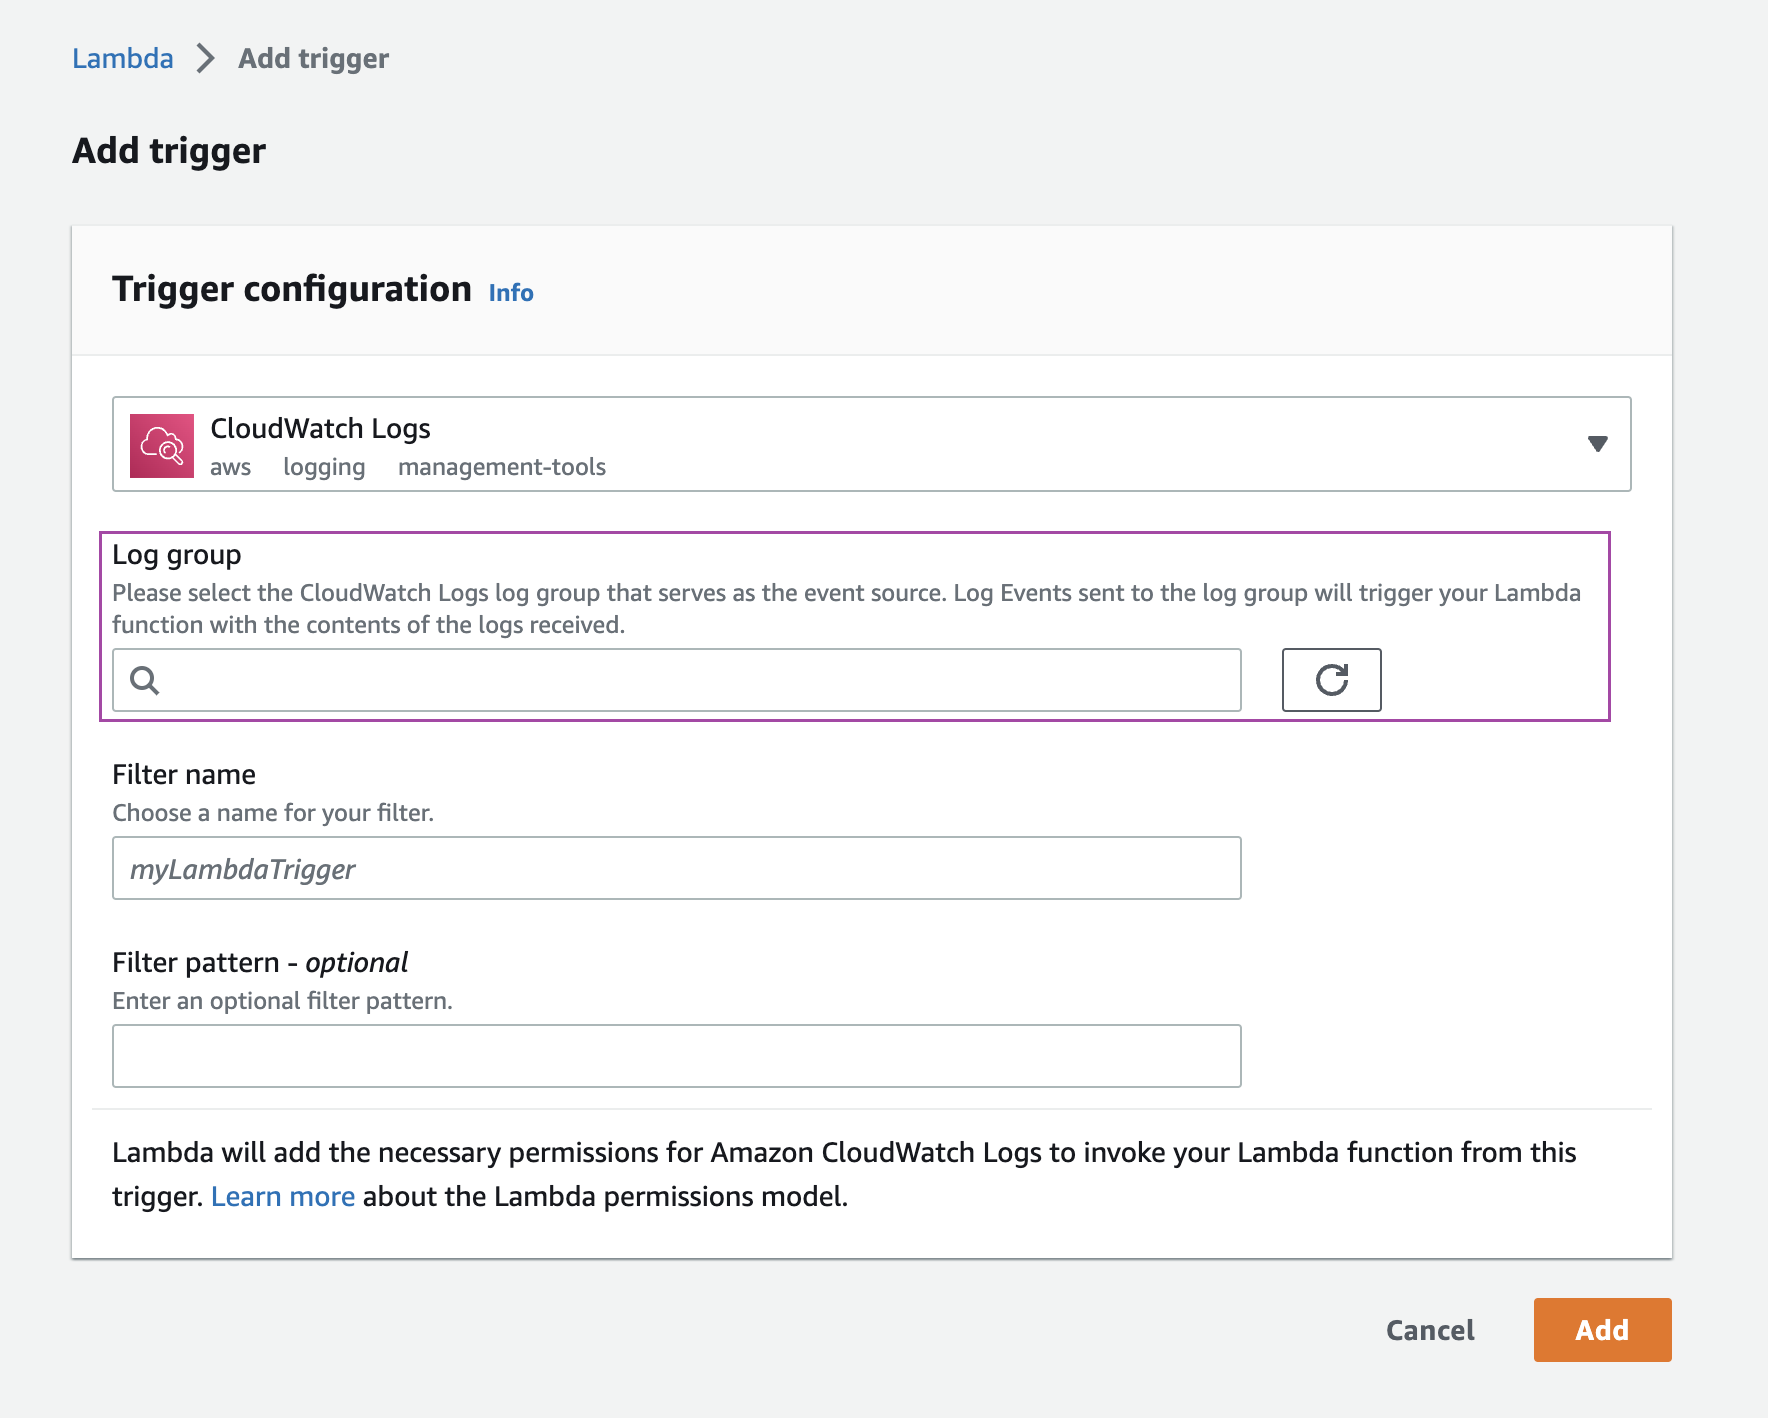
- Log group: Select the CloudWatch log group that acts as the source. Here we should select the log group in which slow query logs are written. Any event triggered in the selected group will call the Lambda Function.
- In the window that opens, click on the Lambda Function.
- Scroll to the editor, and place the code provided in the link below:
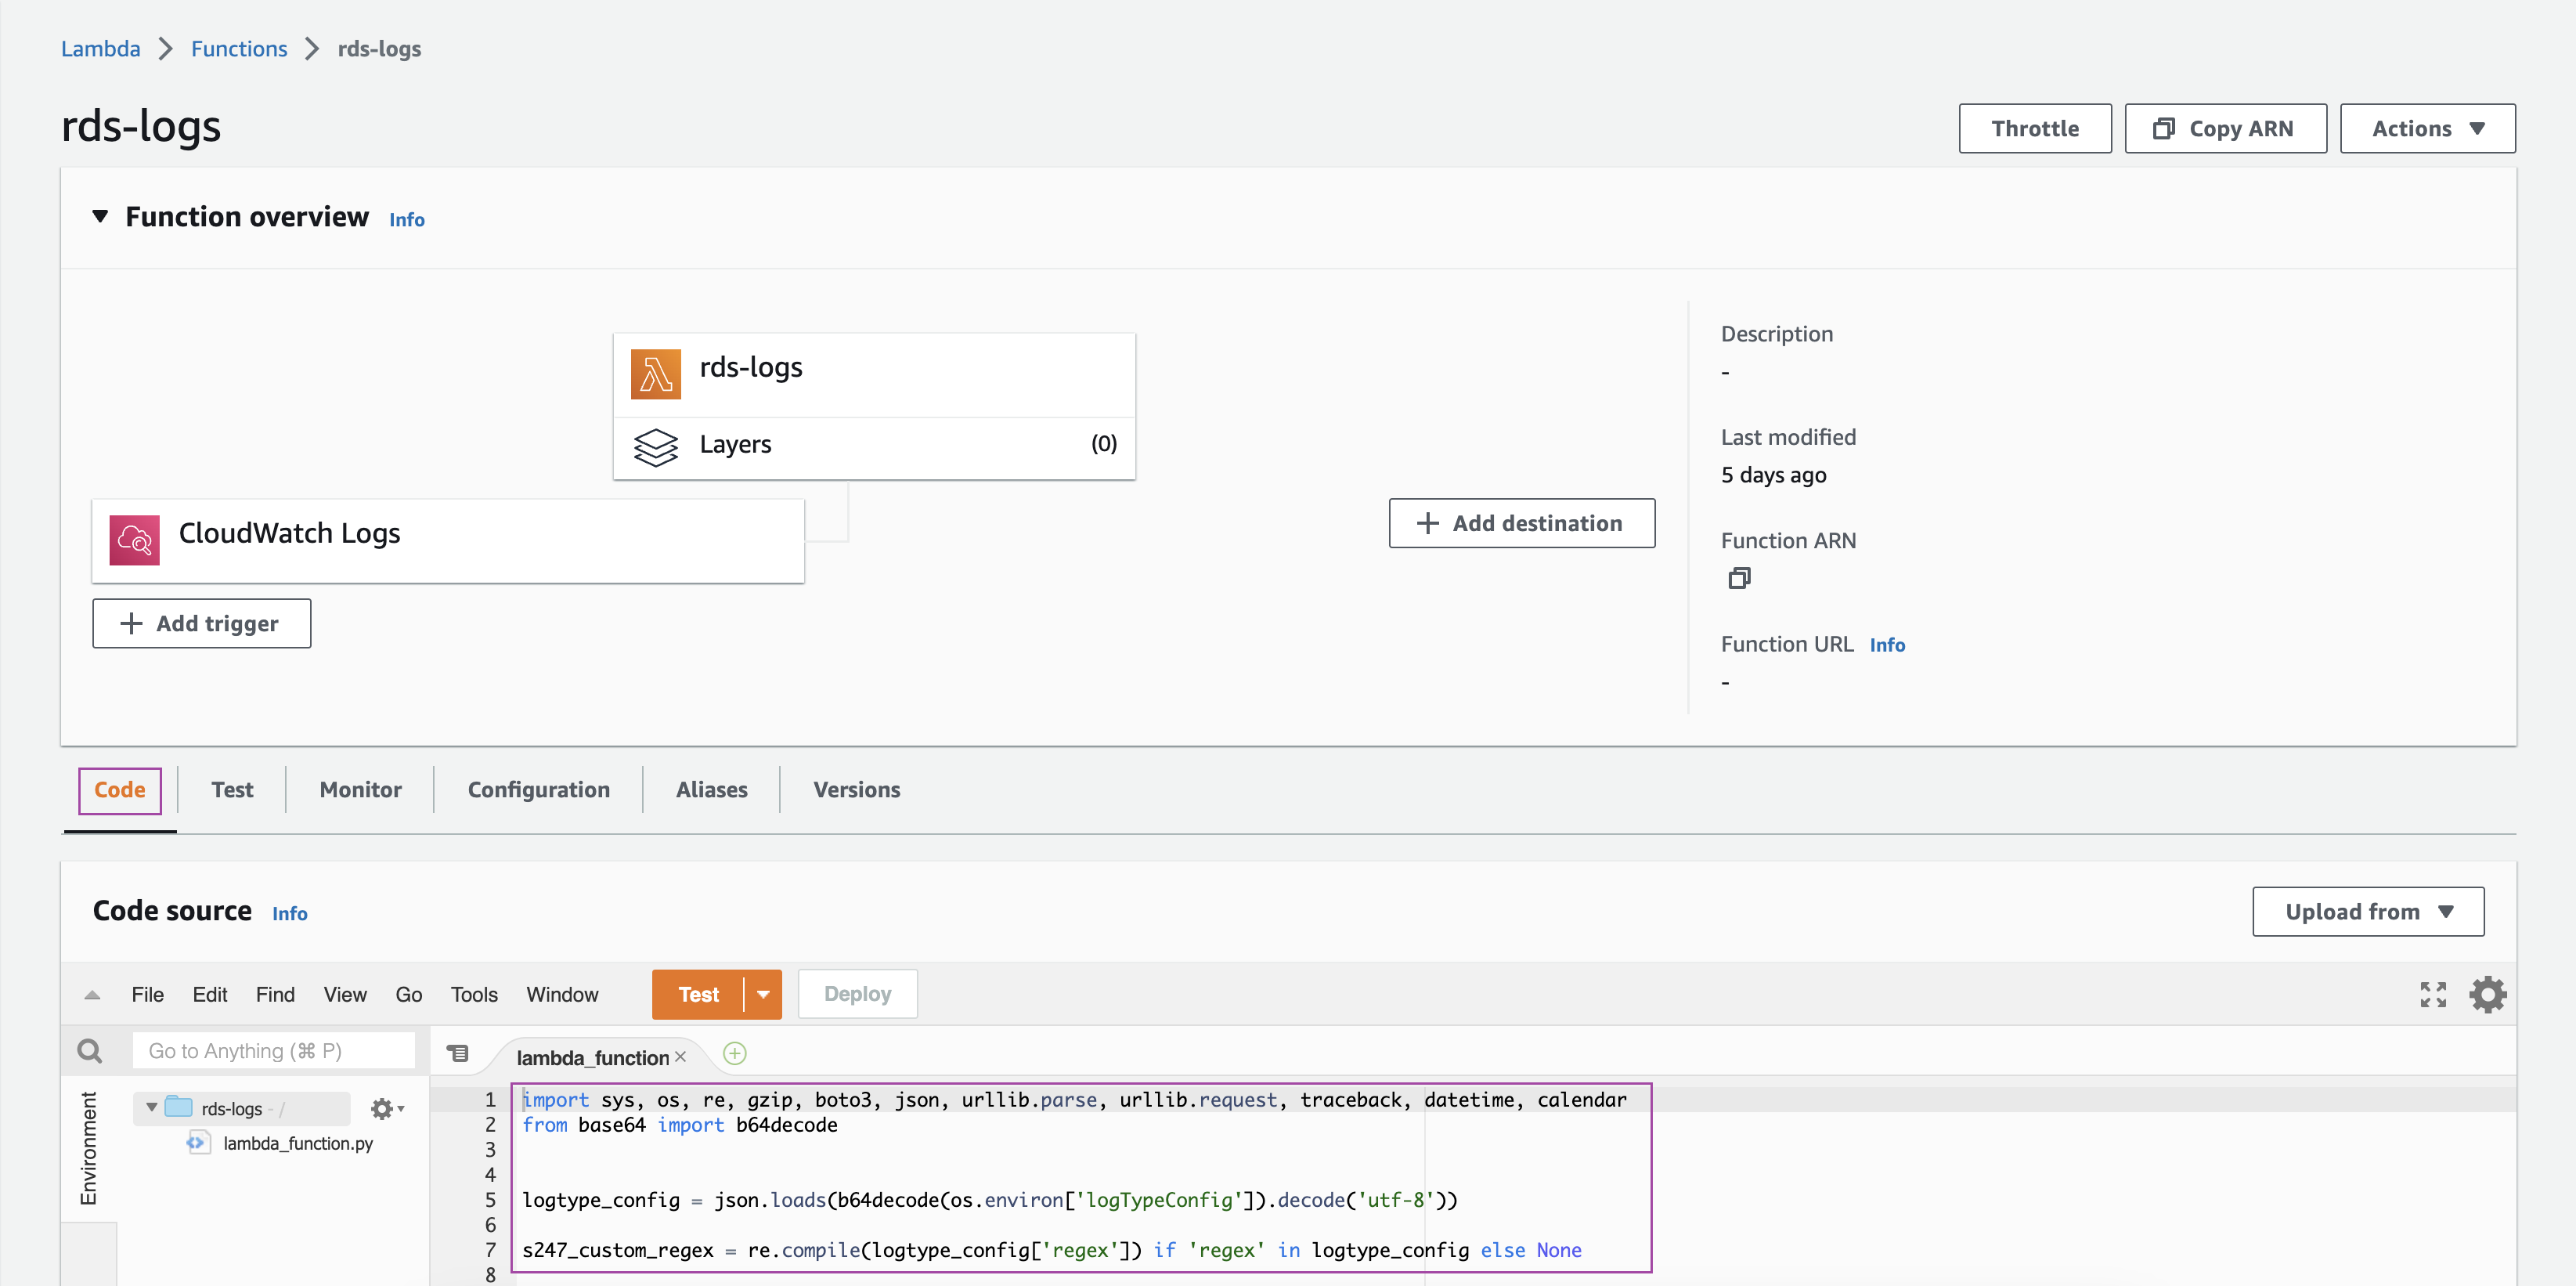
- After entering the code:
- Navigate to the Site24x7 web client.
- Select Admin > AppLogs > Log Profile.
- Select the created Log Profile.
- Copy the code on the screen.
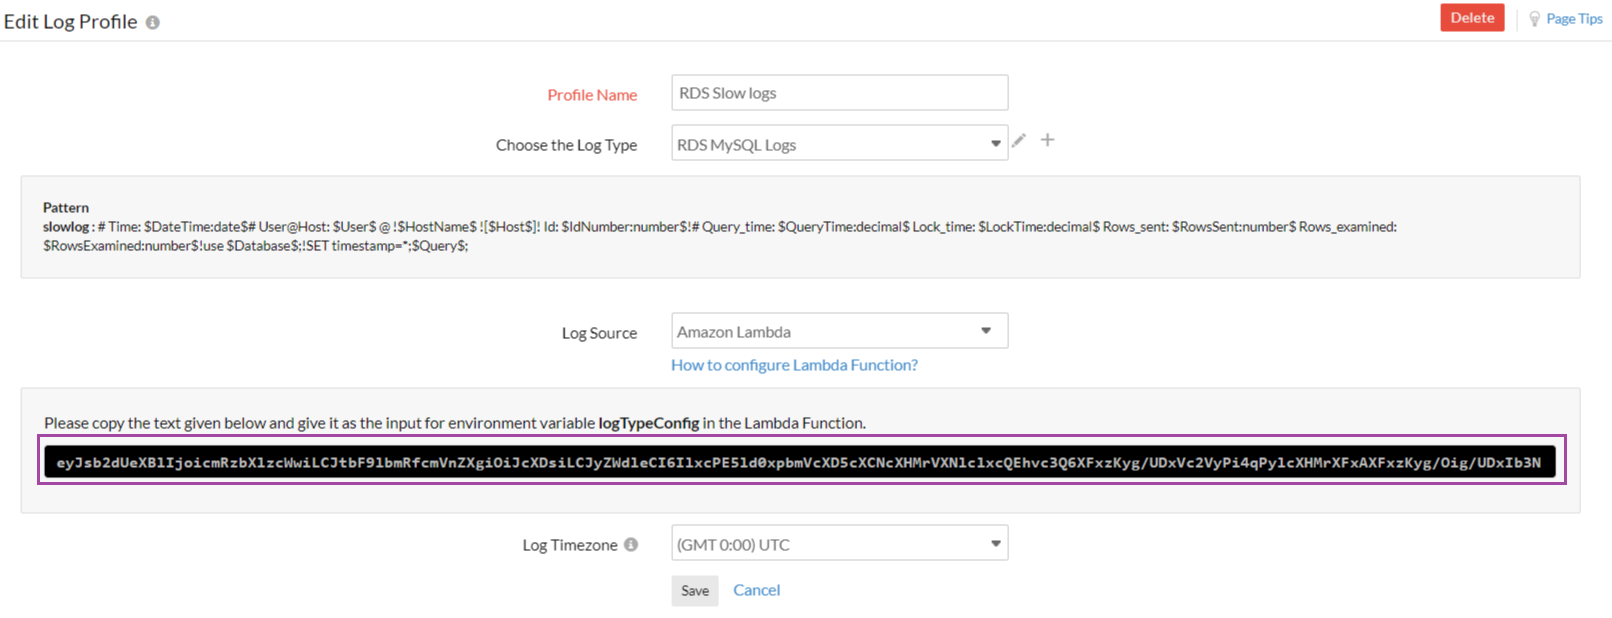
- Paste this code under Environment Variable with the field name logTypeConfig in the AWS console.
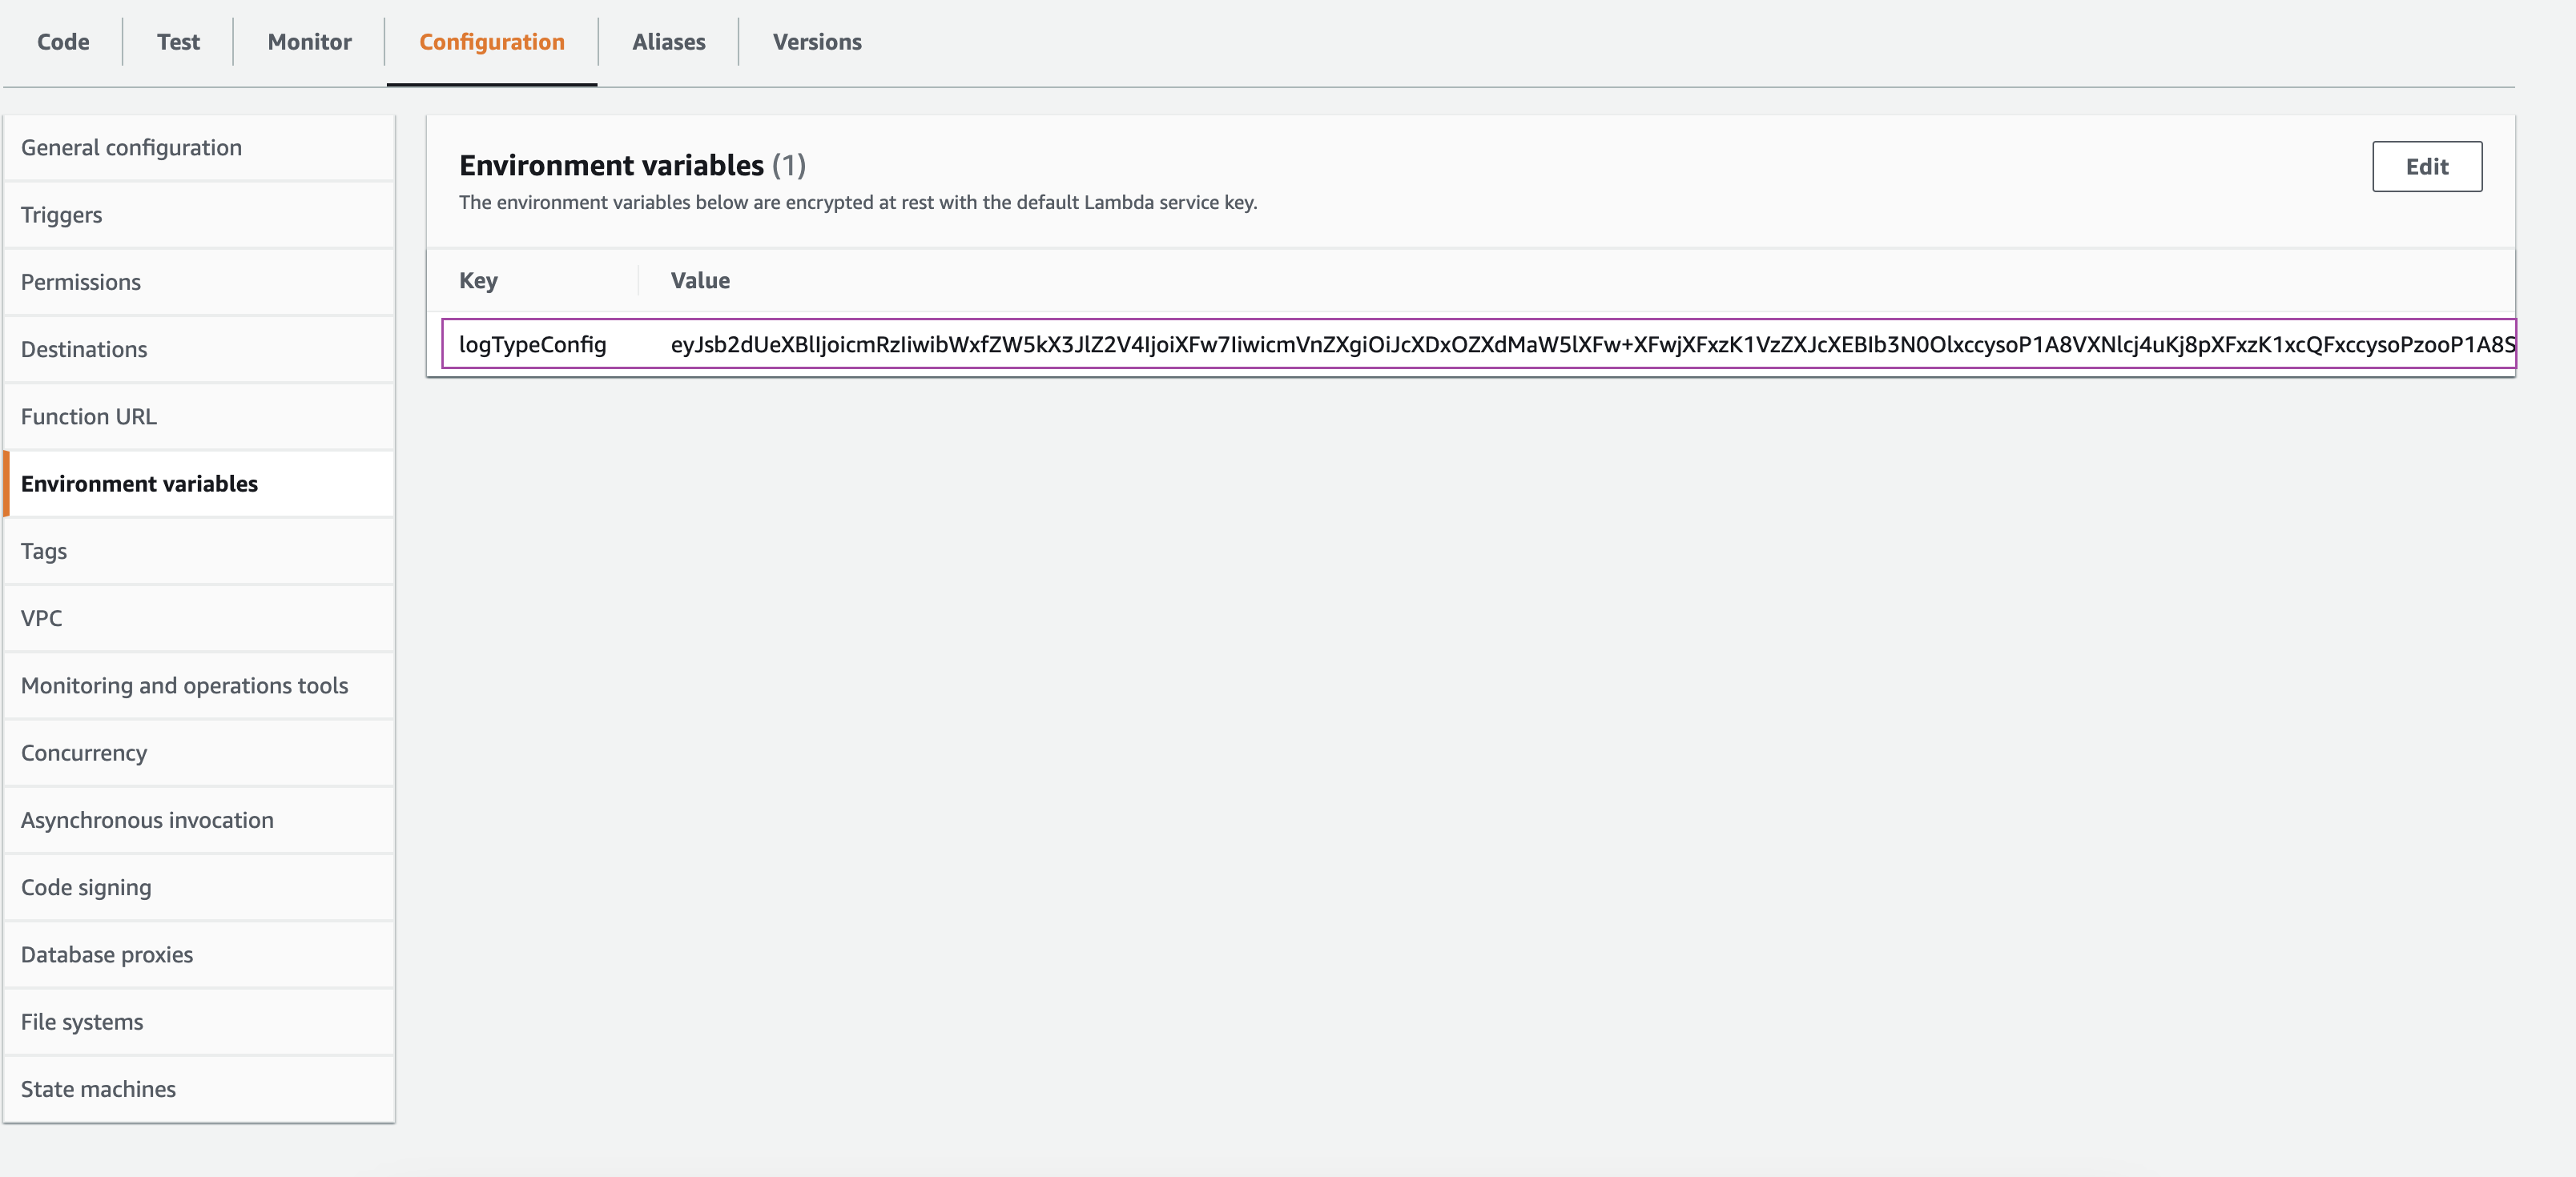
Whenever there is a change in the log type, make sure to replace the logTypeConfig key in the lambda with the new key from the log profile.
Dashboard
AppLogs creates an exclusive dashboard for every log type, and shows a few widgets by default. Here's a list of the widgets available in the RDS MySQL Slow Query Logs dashboard:

