Color Conditions for log analysis
The Color Conditions feature provides a visual mechanism to highlight specific log entries based on defined criteria. By using unique colors for specific fields or entire log rows, users can swiftly recognize and classify error messages, warnings, and informational entries within the log lines.
Use cases
Severity triage: In high-traffic environments, configuring distinct colors for severity-based logs, such as red for critical and yellow for warning, can provide immediate visual identification of critical issues. This allows IT teams to distinguish catastrophic failures from background noise, drastically reducing mean time to repair.
HTTP status code classification: Use visually color-based differentiation to separate 200 (OK or success), 400 (bad request or client errors), and 500 (internal server errors) status codes. This enables support and DevOps teams to prioritize server errors that require immediate attention over client-originated issues.
Security and authentication events: Highlight suspicious login or access behavior. This improves security visibility and accelerates incident detection and investigation.
HTTP response time classification: Use visual color-coded logs to differentiate response times based on the duration of requests, like red (> 10 seconds), orange (5–10 seconds), yellow (1–5 seconds), or green (< 1 seconds).
Key benefits
- Immediate recognition: Instantly identify critical logs, enhancing response times to events.
- Customization: Tailor the log view to specific needs by applying multiple or single conditions.
- Enhanced visualization: Enhance dashboard reports and log summaries with consistent color categorization.

Types of conditions
Color conditions can be defined using either an exact value or a regex pattern within the field name. The following condition types are supported for color formatting:
- Matches: Highlights logs where the field value is an exact match to your specified string or regex. The entire field must match the input exactly. No partial matches or extra characters are allowed.
For example: If you set the value to site24x7, only the string site24x7 will be highlighted. A log containing site24x7-app will not be matched. - Contains: Highlights logs that include your specified substring anywhere within the field. If the specified value exists as part of a larger message, the matching portion will be highlighted.
For example: If you color-code the value 500, any log message containing that number (i.e., Error 500: Connection Failed) will trigger the highlight for the 500 portion.
NoteEntire row color formatting can be applied to only one field at a time.
- Matches (Case Insensitive): Performs an exact match while ignoring casing. The field must contain only the specified string (or regex pattern), but the casing does not need to be identical.
For example: A pattern for SSL will successfully match ssl, Ssl, and SSL provided no other text is present in the field. - Contains (Case Insensitive): Identifies and highlights sub strings or regex patterns regardless of their case. This is the most flexible option and will find your specified text anywhere in the log, no matter how it is capitalized.
For example: Searching for error will highlight Error, ERROR, or erRoR within any part of the log message.
For both field-level and row-level color conditions, you may define up to five color condition rules for each field. If a new row-level color condition is applied to a different field, any previously configured row condition will be replaced.
- Entire row formatting supports both font color and background color.
- Field-level formatting is limited to font color only.
Steps to implement color conditions
To implement color conditions in your logs while creating a new log type, follow these steps:
- Log in to Site24x7.
- Navigate to Applogs > Log Types.
- Adding a sample log pattern will generate the Sample Output section.
- Under the Sample Output section, locate the field for which you want to apply a color condition.
- Click the gear icon
 next to a field name.
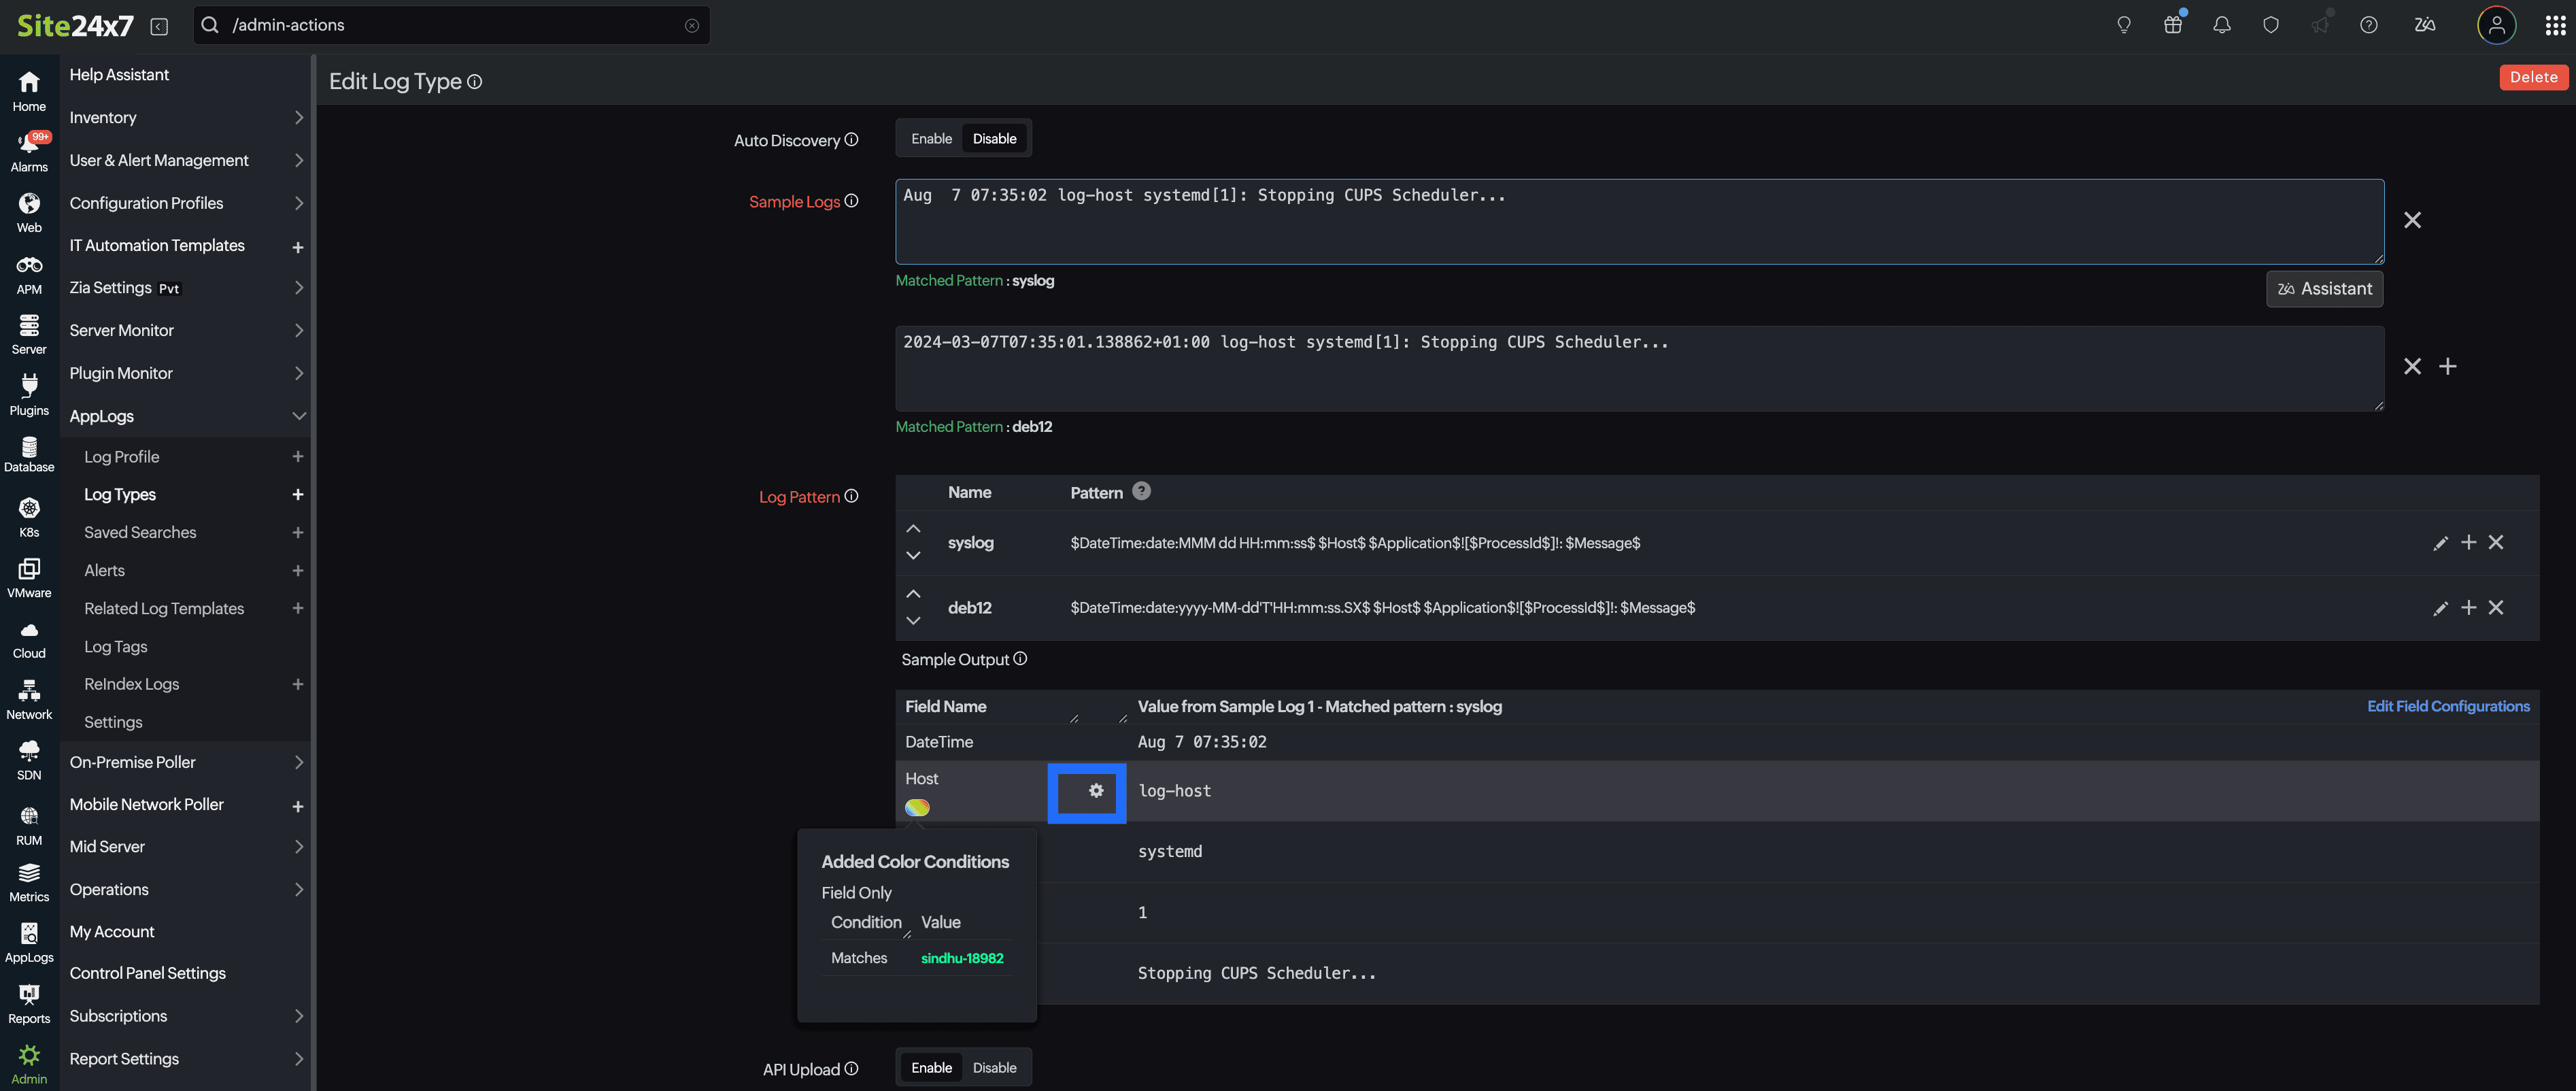
- Toggle between Entire Row or Field Only for color application.
- Entire Row: When applying a color condition to an entire row, it can only be done once. You can choose both a font color icon and a background color icon for that row.

- Field Only: When applying color conditions to a particular field, you can specify multiple conditions. You can also choose a specific font color for that field.

- Entire Row: When applying a color condition to an entire row, it can only be done once. You can choose both a font color icon and a background color icon for that row.
- Select your preferred condition type and assign a highlight color. For value-based conditions, you may use either literal strings or regex patterns.
- Click Apply.
If you want to apply a color condition to another field, the existing row condition will be replaced by the new one.
Edit color conditions
To edit an existing color condition, follow the steps below:
- Navigate to AppLogs > Log Types.
- Selecting a log type will open the edit page.
- Under the Sample Output section, locate the colored oval icon
 beneath the field name. Hover over this colored oval icon to see a summary of the existing condition applied to that field.
 - To update the existing condition, click either the gear icon or the colored oval icon next to the respective field name.
- The Edit Field Configuration pop-up opens, directing you to the color condition settings.
- Choose the appropriate color condition and click Apply to save the changes.

View color conditions
The configured color conditions are reflected in AppLogs search results. When searching for a specific log type, the matching logs are displayed in the list view with the updated color formatting applied.

Save your search queries and add them to dashboards to maintain consistent visual formatting. Your color conditions will dynamically reflect across the AppLog search page, raw log widgets, and chart-based dashboard widgets.

By supporting both field-level and row-level color highlighting, this feature enables teams to identify critical events more quickly; reduce troubleshooting time; and maintain consistent visual context across logs, charts, and dashboards. It is particularly valuable in high-volume log environments where rapid analysis and visual clarity are essential.