Kubernetes Pod Logs
Collect, track, and monitor the logs of your applications running on Kubernetes pods using Site24x7 AppLogs. Site24x7's server agent supports collecting logs from Kubernetes log files.
Steps to add Kubernetes pod logs:
- Log in to your Site24x7 account.
- If you do not have a Kubernetes monitor, add one by following the steps here (or go to Server > Kubernetes > Clusters (+) > Add Kubernetes Monitor).
- After adding the Kubernetes monitor, our Site24x7 pod will run on each of your Kubernetes cluster nodes and will be ready to collect the logs.
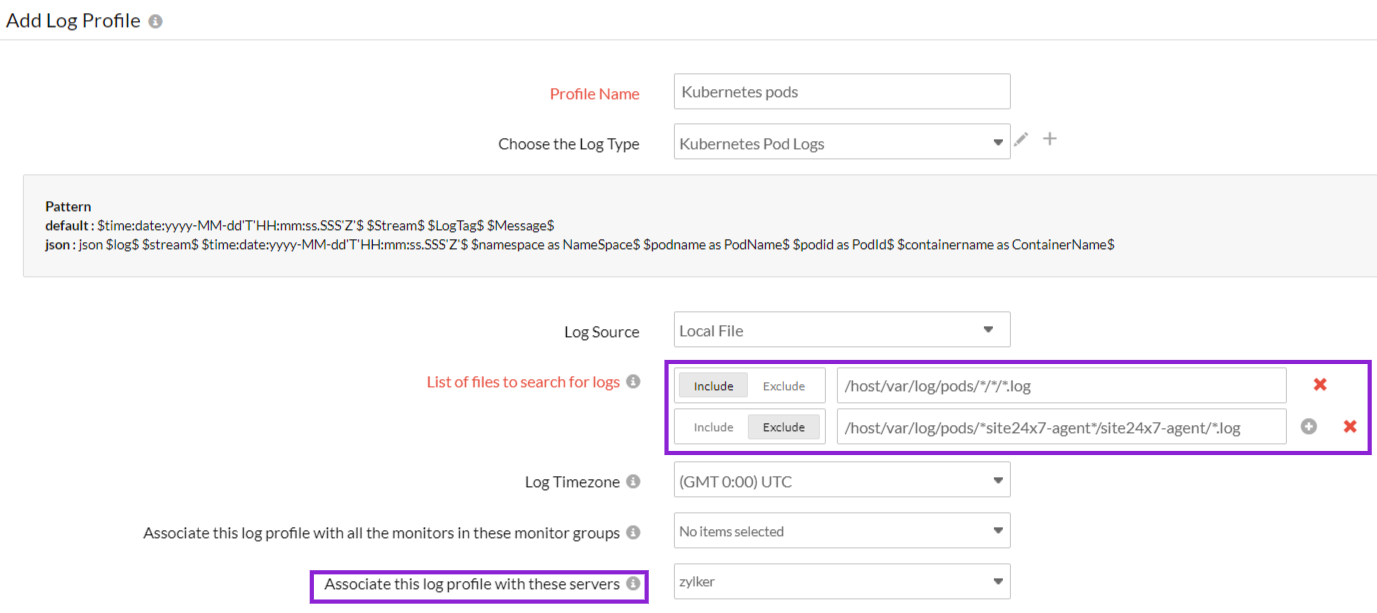
- Then, you can create a log profile by navigating to Admin > AppLogs > Log Profile > Add Log Profile.
- Select Kubernetes Pod Logs from the log type list.
- Kubernetes pod logs are sourced from the /var/log/pods/ folder path. Adding the Kubernetes monitor will automatically mount the /var folder as /host/var into our Site24x7 pod. The site24x7-agent.yaml file already contains the path mentioned under the parent directory so that our pod can read the logs from the mentioned folder.
Filtering pod logs
- If you want to collect all the pod's logs, use the file path below in the log profile. The file path below is a generic path that will gather logs from all namespace folders:
/host/var/log/pods/*/*/*.log - The following path represents the location of container logs organized by namespace, pod name, and unique pod identifier:
/host/var/log/pods/namespace_podame_podid/ container_name/*.log
- If you want to collect logs from a specific pod, you can do so by specifying the particular pod name path as follows:
/host/var/log/pods/*<particular Pod name>*/*/*.log - To collect logs from specific namespaces, set the file path as below in the log profile:
/host/var/log/pods/*<namespace>*/*/*.log
- If you want to collect logs from a specific pod, you can do so by specifying the particular pod name path as follows:
- To exclude the Site24x7 pod logs, click the + icon, select the Exclude option, and add the file path below:
/host/var/log/pods/*site24x7-agent*/site24x7-agent/*.log
- If you want to collect all the pod's logs, use the file path below in the log profile. The file path below is a generic path that will gather logs from all namespace folders:
- Once you add the Kubernetes monitor, you can associate that Kubernetes node using the Associate this log profile with these servers option.

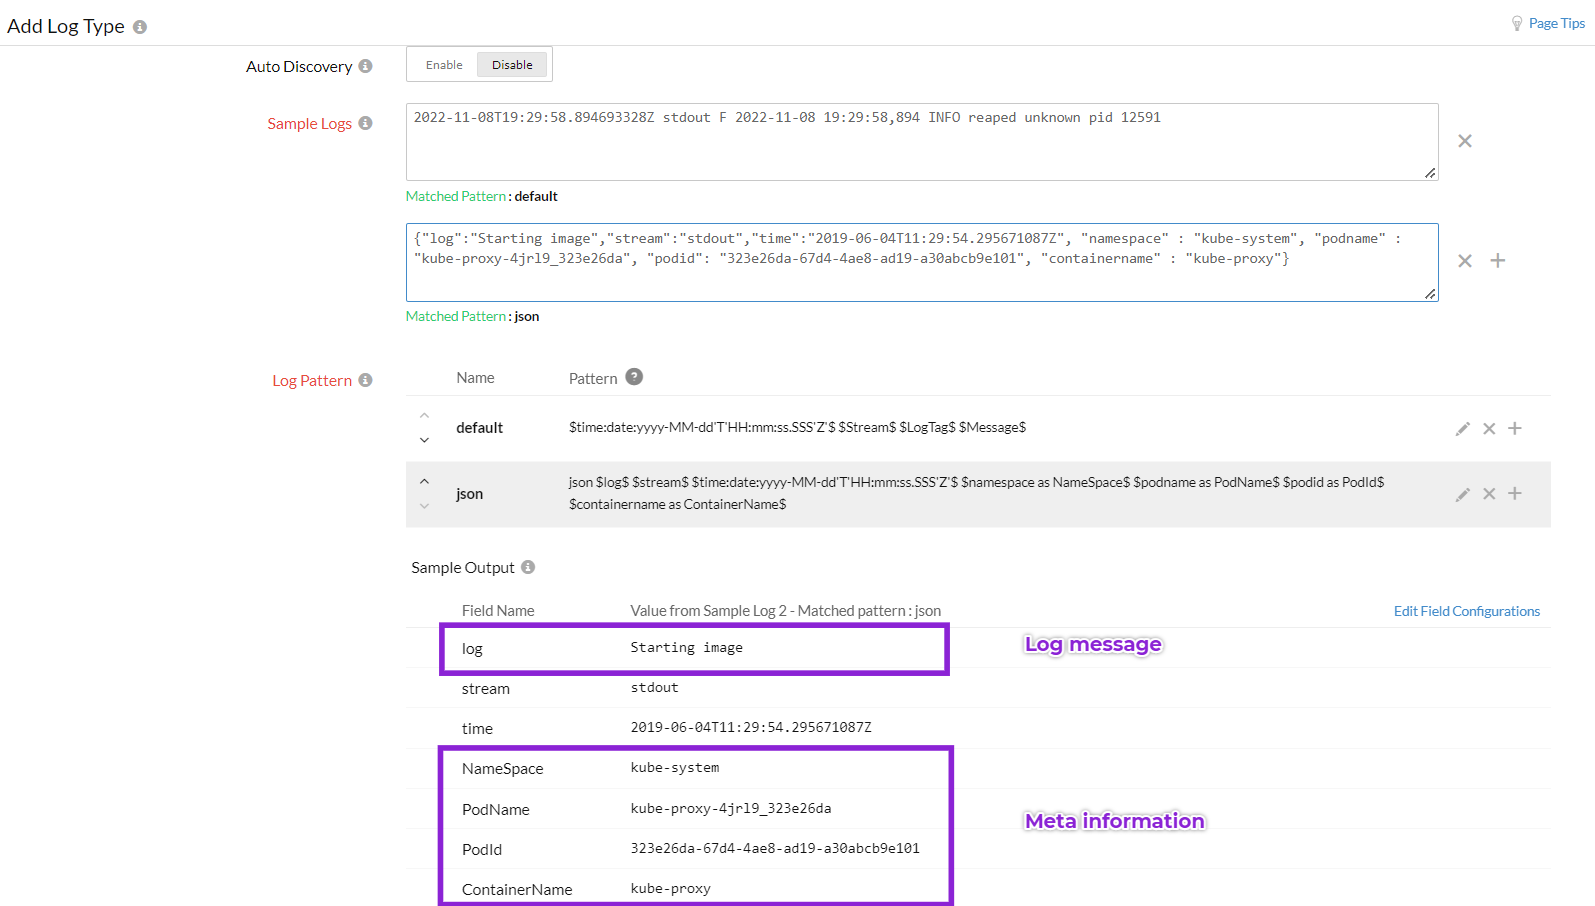
In Kubernetes, some pods write logs in JSON format, while others write the logs in klog native format. Site24x7 supports klog native and JSON log formats for parsing Kubernetes Pod logs.
Klog native: Sample log and log pattern
2022-11-08T19:29:58.894693328Z stdout F 2022-11-08 19:29:58,894 INFO reaped unknown pid 12591
$time:date:yyyy-MM-dd'T'HH:mm:ss.SSS'Z'$ $Stream$ $LogTag$ $Message$
JSON: Sample log and log pattern
{"log":"Starting image","stream":"stdout","time":"2019-06-04T11:29:54.295671087Z", "namespace" : "kube-system", "podname" : "kube-proxy-4jrl9_323e26da", "podid": "323e26da-67d4-4ae8-ad19-a30abcb9e101", "containername" : "kube-proxy"}
json $log$ $stream$ $time:date:yyyy-MM-dd'T'HH:mm:ss.SSS'Z'$ $namespace as NameSpace$ $podname as PodName$ $podid as PodId$ $containername as ContainerName$
This log is separated into fields, each of which will take its respective value and then be uploaded to Site24x7.
| Field name | Field value |
| log | Starting image |
| stream | stdout |
| time | 2019-06-04T11:29:54.295671087Z |
| NameSpace | kube-system |
| PodName | kube-proxy-4jrl9_323e26da |
| PodId | 323e26da-67d4-4ae8-ad19-a30abcb9e101 |
| ContainerName | kube-proxy |
Here, the log key will capture the actual log messages. The rest of the field names, such as NameSpace, PodName, PodID, and ContainerName, are additional meta information.

With Site24x7's Kubernetes event logs, you can view and also manage all the event logs of your clusters, pods, and nodes.
Related log types
Further reading
Learn article: Kubernetes logging 101
