
Azure Service Bus log collection
Azure Service Bus is a cloud-based messaging service that enables reliable communication between distributed applications. When your applications publish log or event data to a Service Bus queue or topic, AppLogs can collect and monitor those messages.
By configuring AppLogs to an Azure Service Bus queue, you can collect log messages published by your applications, forward them for indexing, and search and analyze them from a single place without modifying your existing logging workflow.
Use case
A DevOps team manages a microservices application in which services communicate through Azure Service Bus topics. When a downstream service stalls or begins throwing errors, tracing the affected messages becomes difficult: once a message is consumed, it is gone, and each service records only its own side of the exchange.
Solution: Add a dedicated subscription to the topic for the monitoring account, so that every published event is also collected and indexed in AppLogs, without modifying the application or competing with the existing services for messages. The team can then:
- Search the full event stream by order ID, correlation ID, or any other message field to reconstruct a transaction's path across services.
- Pinpoint the stage at which processing stopped by comparing published events against each service's own logs.
- Configure log alerts on error patterns in the event stream to catch failures before users report them.
- Build AppLogs dashboards showcasing message volume by event type to identify traffic drops or surges at a glance.
This helps the team search message logs, identify failed transactions, detect recurring issues, and set up alerts for faster incident response.
Benefits of Azure Service Bus
Using Azure service bus offers the following benefits:
- Faster troubleshooting: Filter and correlate messages by field to trace failures back to their source.
- No pipeline to maintain: A monitored Azure function handles parsing and delivery for you.
- Flexible routing: Send different message categories to their own log types automatically.
- Proactive alerting: Set up log-based alerts to catch issues as soon as they appear.
Collecting Azure Service Bus logs
Log collection from Azure Service Bus involves the following steps:
- Your applications or services publish log messages to an Azure Service Bus queue (or a topic subscription).
- The queue triggers an Azure function, which is deployed from the Site24x7 applogs-azure-function repository.
- The Azure function parses the messages and sends the logs to the AppLogs HTTP source.
Configuring log collection
To set up this log collection, you need to:
- Create a log profile.
- Get your Service bus connection string.
- Deploy the Azure function using an ARM template.
Create a Log Profile
In the monitoring web console:
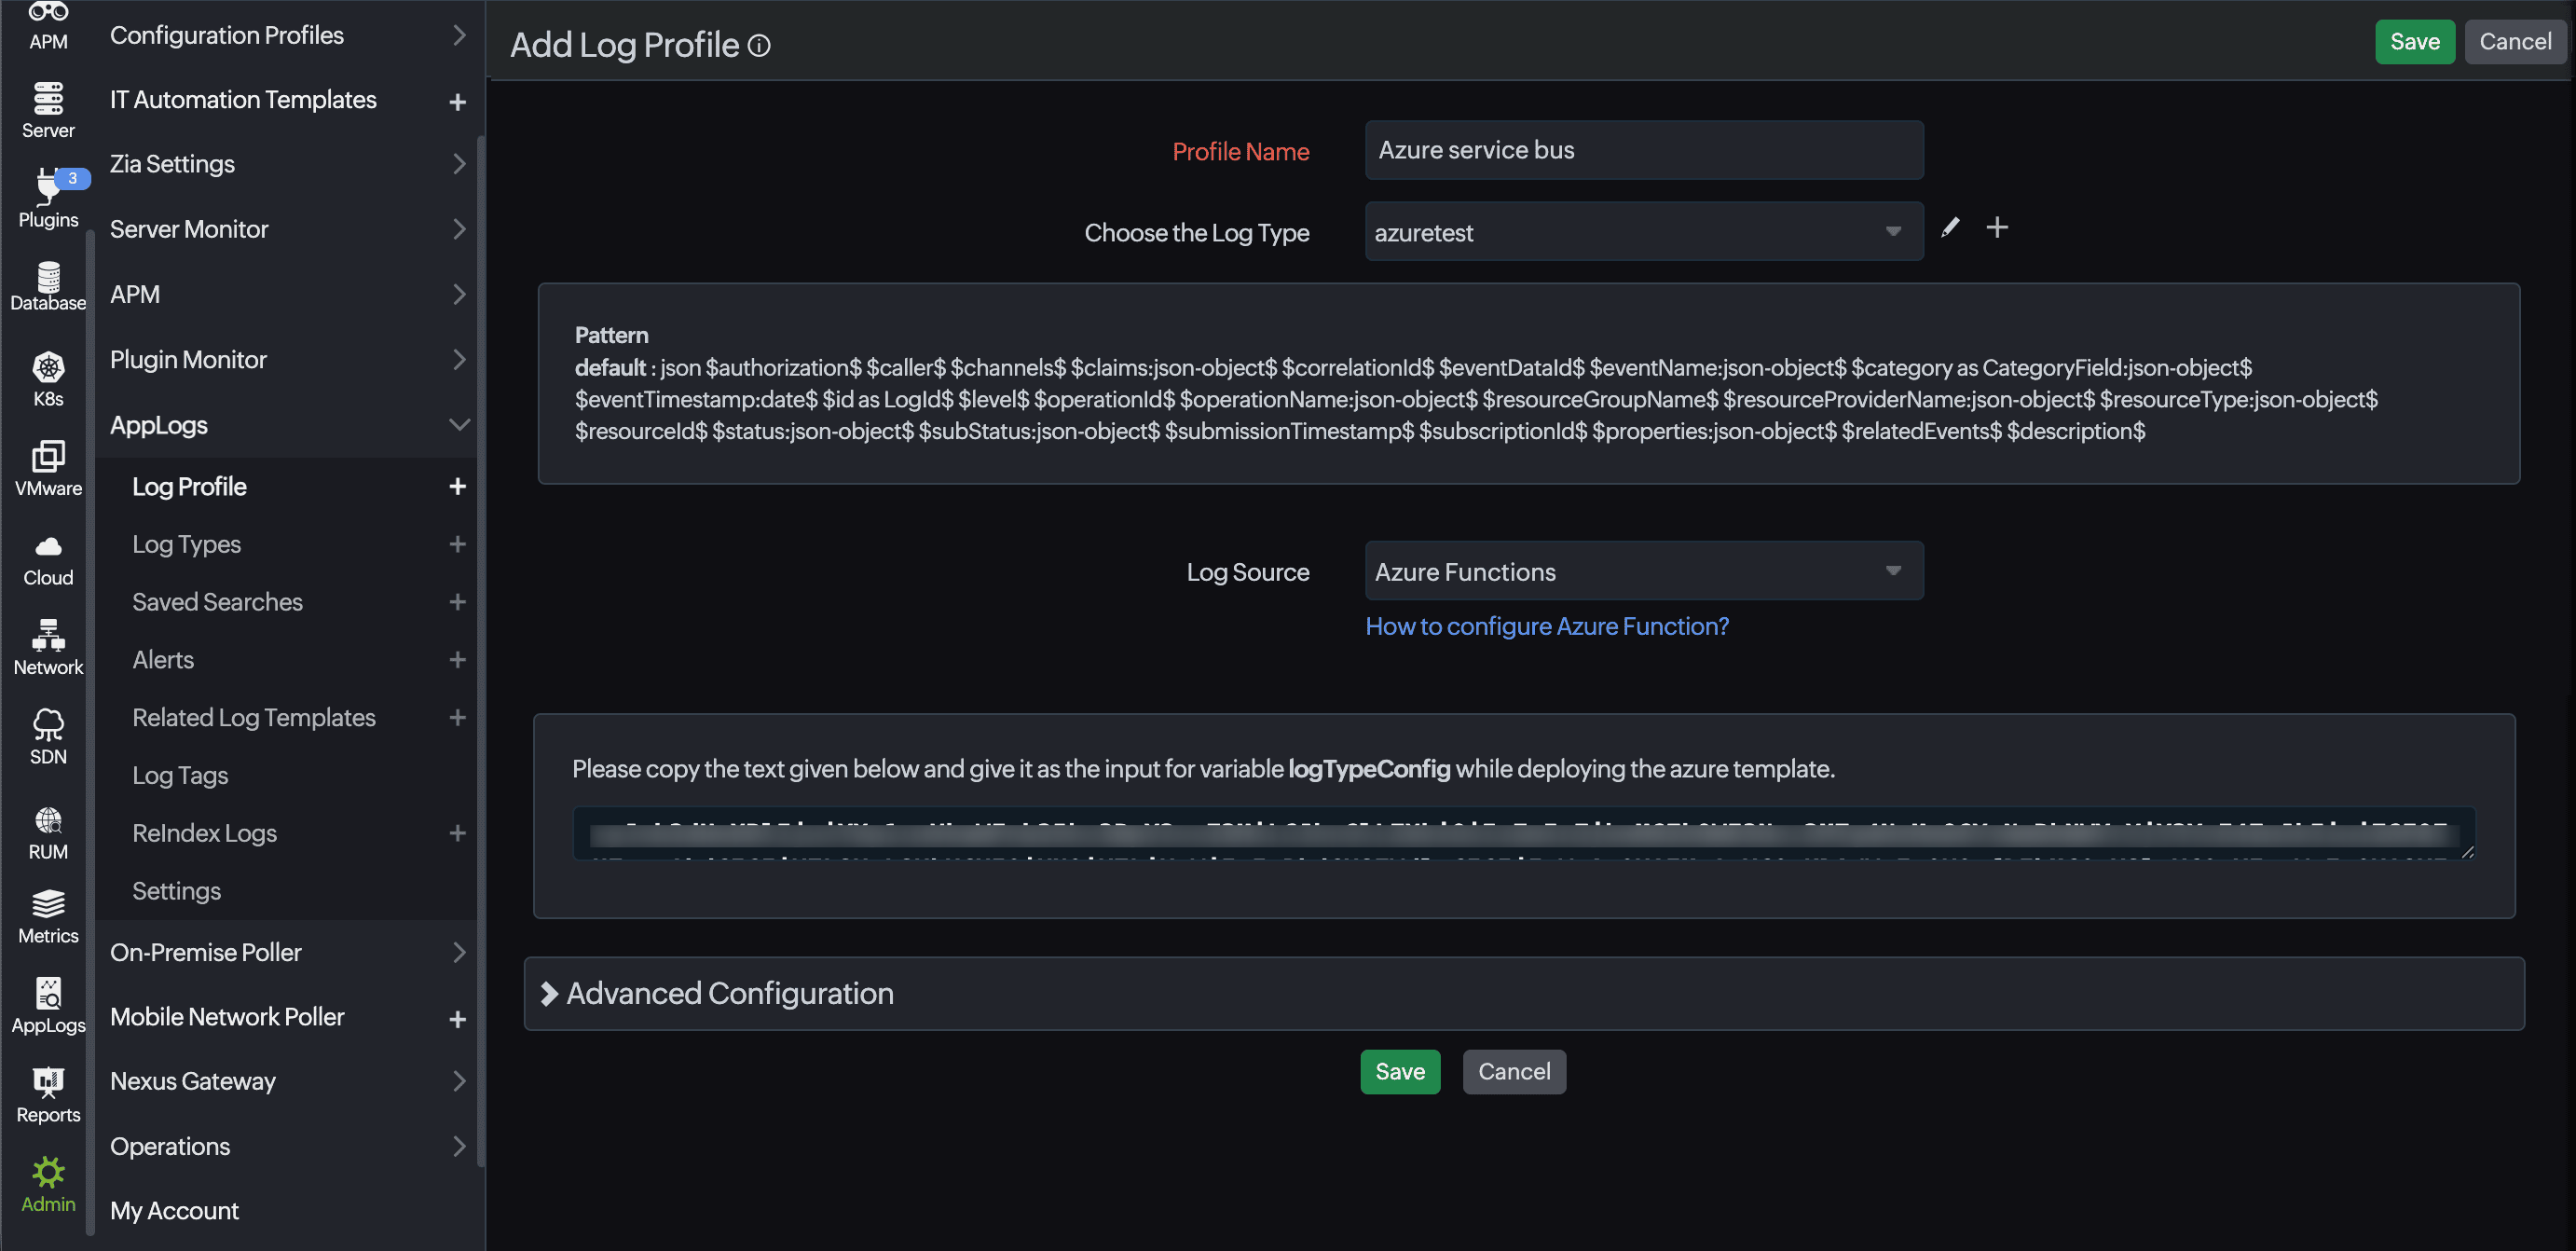
- Go to Admin > AppLogs > Log Profile > Add Log Profile, and enter the following details:
- Profile Name: Enter a name for your Log Profile.
- Log Type: Select an existing Log Type that matches your application's log fields, or create a custom Log Type using a sample of the events your application publishes.
- Log Source: Select Azure Functions from the drop-down menu.
- Click Save.
Open the saved profile and copy the logTypeConfig value shown on screen. You will need it during deployment.
Getting your Service Bus connection string
The function connects to your existing Service Bus namespace and queue. To get the connection string:
- In the Azure portal, open your Service Bus Namespace.
- Go to Settings > Shared access policies.
- Select an existing policy such as RootManageSharedAccessKey, or click + Add to create a policy with only Listen rights (recommended for least privilege).
- Copy the Primary connection string.
Also note the name of the queue to which the logs are published.
Deploying the Azure function using an ARM template
The ARM template creates an App Service plan, a Storage Account for the function state, and the Function App with the Service Bus trigger. The function code is pulled from the applogs-azure-function GitHub repository.
Method 1: Automatic installation
To start automatic installation, click the button below, then jump to step 7, in the Manual installation section.

Method 2: Manual installation
For manual installation, follow the steps below:
- Download the ARM template.
- Log in to your Azure portal, and go to Marketplace > Template deployment (deploy using custom templates).
- Click Create.
- On the Custom deployment page, click Build your own template in the editor.
- Paste the contents of the JSON file into the editor window.
- Click Save.
- On the Custom Deployment page, in the Basics section, enter the following:
- Subscription: Select your subscription from the drop-down menu.
- Resource group: Create a new resource group with a name similar to Site24x7-Azure-SB-Logs.
- Region: Select a location from the drop-down menu.
- In the Settings section:
- Name: The function name will be prefilled. You don't need to change it.
- Log Type Config: Paste the logTypeConfig value copied from your Log Profile (Admin > AppLogs > Log Profile > your newly created profile).
- Service Bus Connection String: Paste the connection string as mentioned in the Getting your Service Bus connection string section.
- Service Bus Queue Name: Enter the name of your queue.
- Debug Mode: Leave as False. Set to True only while troubleshooting.
- Check the I Agree to the terms and conditions above box, and click Purchase.
There are some charges involved for the App Service plan and Function App execution.
- Click the notification icon in the top pane to verify that your deployment was successful.
- Once you see the Deployment succeeded notification, click Go to resource group and verify that the App Service plan, Function App, and Storage Account were created.
For the full list of input parameters, refer to the ServiceBus_Logs README in the repository.
To change the queue later, update the ServiceBusQueueName and/or AzureServiceBusConnectionString app settings on the Function App. No redeployment is needed. To read from a topic subscription instead of a queue, see the ServiceBus_Logs README.
Sending logs to the Service Bus queue
Messages published to the queue must be JSON in one of the following formats:
- Azure diagnostic log format:
{"records": [ {"time": "...", "level": "...", "message": "..."}, {...} ]} - A JSON array of log events:
[ {...}, {...} ] - A single JSON log event:
{"time": "...", "level": "...", "message": "..."}
The field names should match the Log Pattern of the Log Type configured in your Log Profile. If the events carry a category field, the function can resolve a separate Log Profile per category (see Multiple Log Types below).
To verify the pipeline without changing your application, you can send a test message from the Azure portal:
- Open the queue.
- Go to Service Bus Explorer > Send messages.
- Paste a sample payload.
Multiple log types with the same function
If your applications publish events with different category values to the same queue, you can route each category to its own Log Type:
- Create a Log Type and Log Profile for each category in Site24x7.
- In the Function App, go to Settings > Environment variables and add one setting per category:
- Name:
S247_<Category>(must start withS247_; replace any hyphens in the category value with underscores) - Value: The logTypeConfig of the matching Log Profile
- Name:
- Events whose
categoryhas no matchingS247_<category>setting fall back to the defaultlogTypeConfigapp setting.
Example: For events published with the PaymentServiceLogs category, add the app setting S247_PaymentServiceLogs with the logTypeConfig value of the PaymentServiceLogs Log Profile.
Troubleshooting log collection
If Site24x7 doesn't receive the logs, check where log collection has failed by:
- Verifying configurations.
- Verifying that the queue is receiving messages.
- Verifying logs in Site24x7.
Verifying configurations
- From the Azure portal home page, go to Resource groups and open the resource group created by the ARM template.
- Check that it lists the three resources: An App Service plan, a Function App, and a Storage Account.
- Open the Function App and confirm the ServiceBus_Logs function is listed under Functions with the status Enabled.
- Go to Settings > Environment variables, and confirm that
AzureServiceBusConnectionString,ServiceBusQueueName, andlogTypeConfighave the expected values.
Verifying that the queue is receiving messages
- In the Azure portal, open your Service Bus Namespace and select the queue.
- On the Overview blade, check the Incoming Messages metric, it should be greater than zero when your application publishes.
- If the Active message count keeps growing instead of returning to zero, the function is not processing messages from the queue. Recheck the connection string and queue name app settings.
- Check the Dead-letter message count. Messages that repeatedly fail processing are moved to the dead-letter queue after 10 delivery attempts. Use Service Bus Explorer to view the message payloads in the dead-letter queue.
Verifying logs in Site24x7
In the Site24x7 web console, and go to AppLogs. On the AppLogs Search window, search for the Log Type configured in your Log Profile.
If the above verifications fail, contact support@site24x7.com with the function logs. To collect them:
- Enable debugMode: In the Function App, go to Environment variables under Settings, set debugMode to True, and click Save. The first event of each batch is then printed to the function logs.
- Enable Application Insights: In the Function App, go to Application Insights and select Turn on Application Insights.
- Retrieve logs: In the Function App, go to Application Insights > Logs. Enter traces in the query editor and click Run to view the function's trace logs. Export the results as needed.
- Disable Application Insights after collecting the data to avoid additional costs.
Related articles
-
On this page
- Use case
- Benefits of Azure Service Bus
- Collecting Azure Service Bus logs
- Configuring log collection
- Sending logs to the Service Bus queue
- Multiple log types with the same function
- Troubleshooting log collection
- Verifying configurations
- Verifying that the queue is receiving messages
- Verifying logs in Site24x7