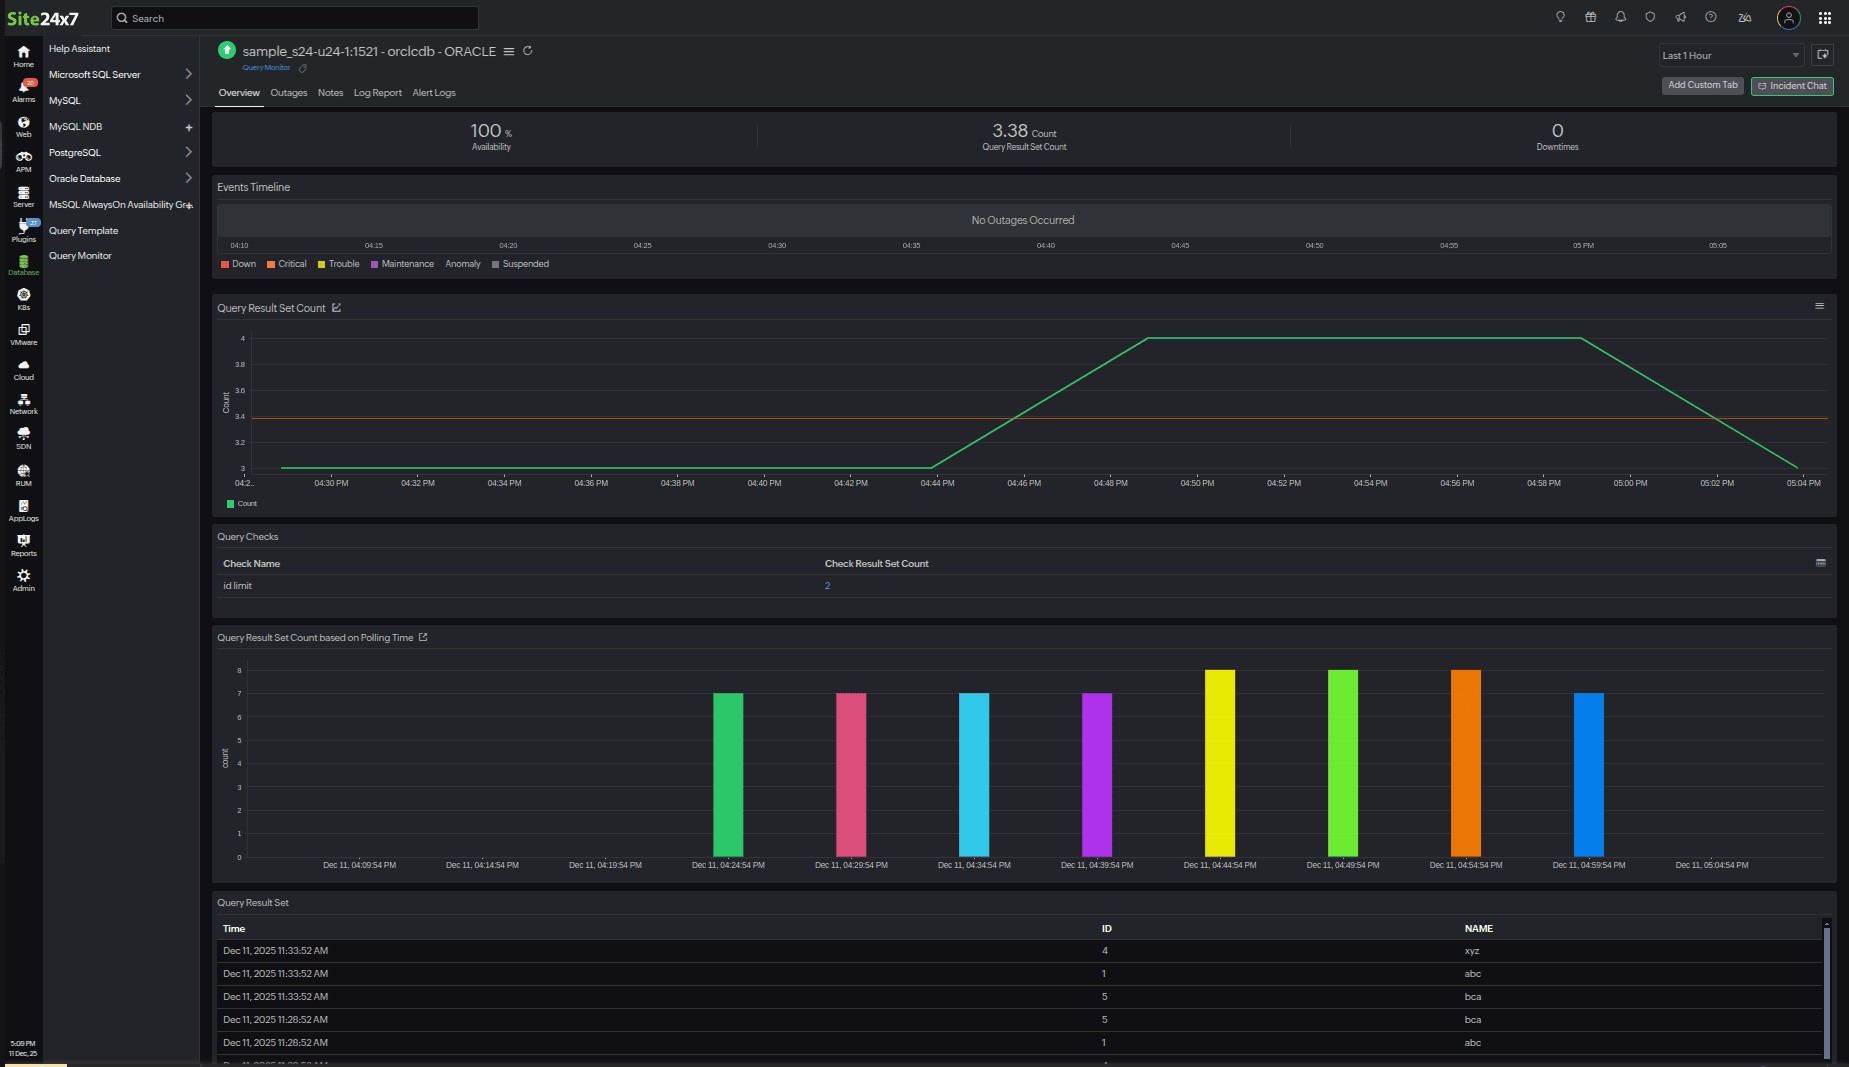
Add a database Query Monitor
The Query Monitor feature in Site24x7 allows you to run custom SQL queries on your database instances and monitor their results. You can create reusable query templates, associate them with specific databases, and configure alert conditions to get notified whenever query results meet defined criteria.
This enables proactive tracking of database metrics and business-critical KPIs without manually querying your database.
Use case
You can use a Query Monitor to check if your Oracle instances are mounted and running. For example:
SELECT instance_name, status FROM v$instance;
This creates a Criteria-based Check with:
- Criteria: status != OPEN
- Row count: > 0
- Severity: Trouble
This ensures you receive alerts whenever an instance is not in the OPEN state.
Prerequisites
You must provide the following permission to add a query monitor:
grant select any table to <username>;
This provides select access to all user-created tables in all schemas.

Steps to add a Query Monitor
Follow the steps below to create and configure a new Query Monitor in Site24x7.
- Log in to Site24x7. Go to Database > Query Template.
- Click Add Template. This opens up the Add Template page.
- Define the Query Template:
- Display Name: Enter a descriptive name for your query template (e.g., Oracle Health Check Query Monitor).
- Query: Enter the SQL query that you want Site24x7 to execute. For example: SELECT instance_name, status FROM v$instance;
- Poll Interval: Customize the poll interval for the query monitor.
-
Click Validate Query. A Query validation successful
message appears once the query syntax is validated successfully.
Note
Your query must return at least one result column to define alert checks.
- Select the Monitor Type and Associate Monitors:
- Monitor Type: Choose the database type for which this query applies (e.g., Oracle and MSSQL).
- Select Monitors to associate the Template: Select the database monitors where this query should be executed.
- Define Column Data Types:
After validating your query, Site24x7 automatically lists all columns returned by the query. For each column, select the appropriate Data Type (e.g., String , Number , Boolean , or DateTime ) across their respective Column Name . These data types help Site24x7 interpret and evaluate query results correctly.
Example:
Column Name
Data Type
instance_name
String
status
String
- Click Add Check and choose one of the following:
- Criteria-based Check: To set alert conditions based on specific column values.
- Define Criteria: Select a column, operator, and value (e.g., status != OPEN).
- Notify When Row Count Is: Define the threshold (e.g., > 0).
- Severity: Select the alert type (Trouble, Critical, or Down).
- Row Count-based Check: Trigger alerts based on the number of rows returned by the query.
- Check Name: Enter a name for the check (e.g., Instance Count Check).
- Notify When Row Count Is: Define the row count condition (e.g., = 0).
- Severity: Select the alert type (Trouble, Critical, or Down).
NoteYou can add up to 25 checks per query template.
- Criteria-based Check: To set alert conditions based on specific column values.
- Once all configurations are complete, click Save to save the Query Template. The newly created query monitor template appears in the Query Template list. You can edit, delete, or clone templates as needed.
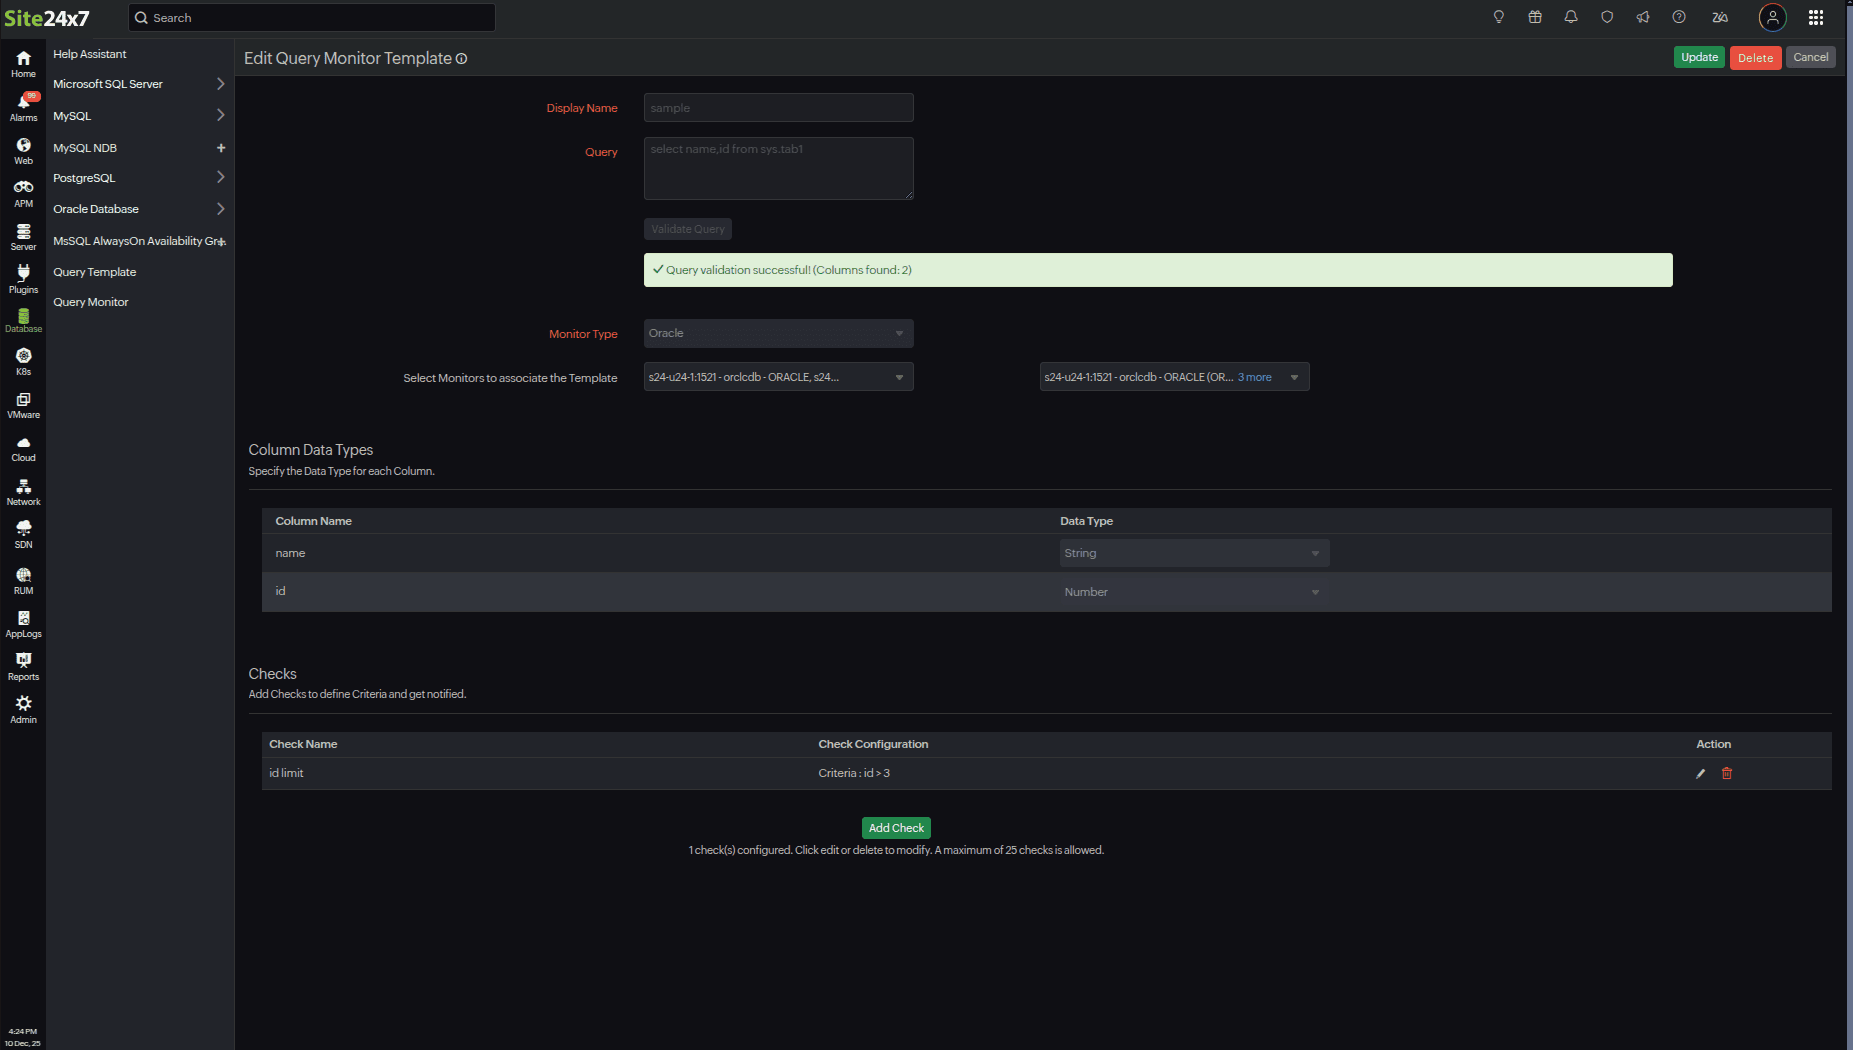
Editing a Query Template
To edit a query template, follow these instructions:
- Navigate to Database > Query Template.
- Select the Query Template that you wish to edit.
- In the Query Template form, modify the query, column data types, or alert checks.
- Click Update to save the changes.
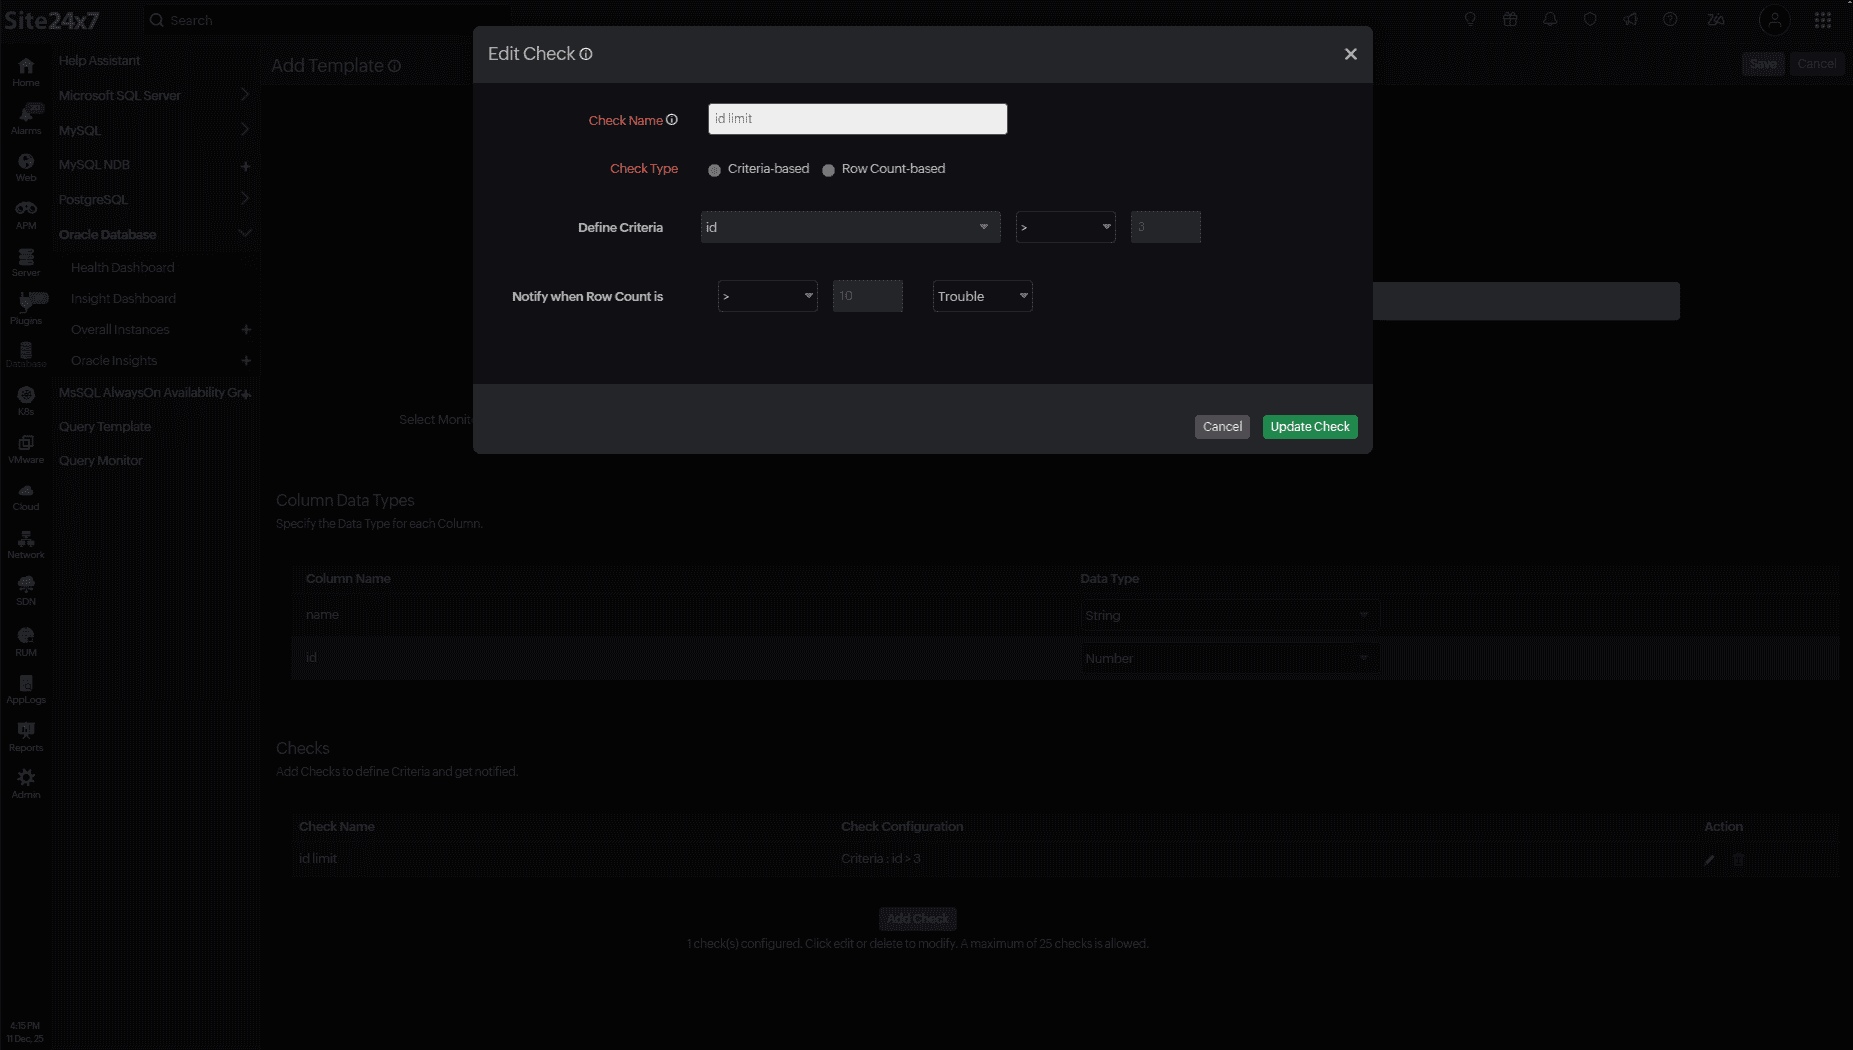
You can delete individual checks or the entire template if they are no longer needed.
Next steps
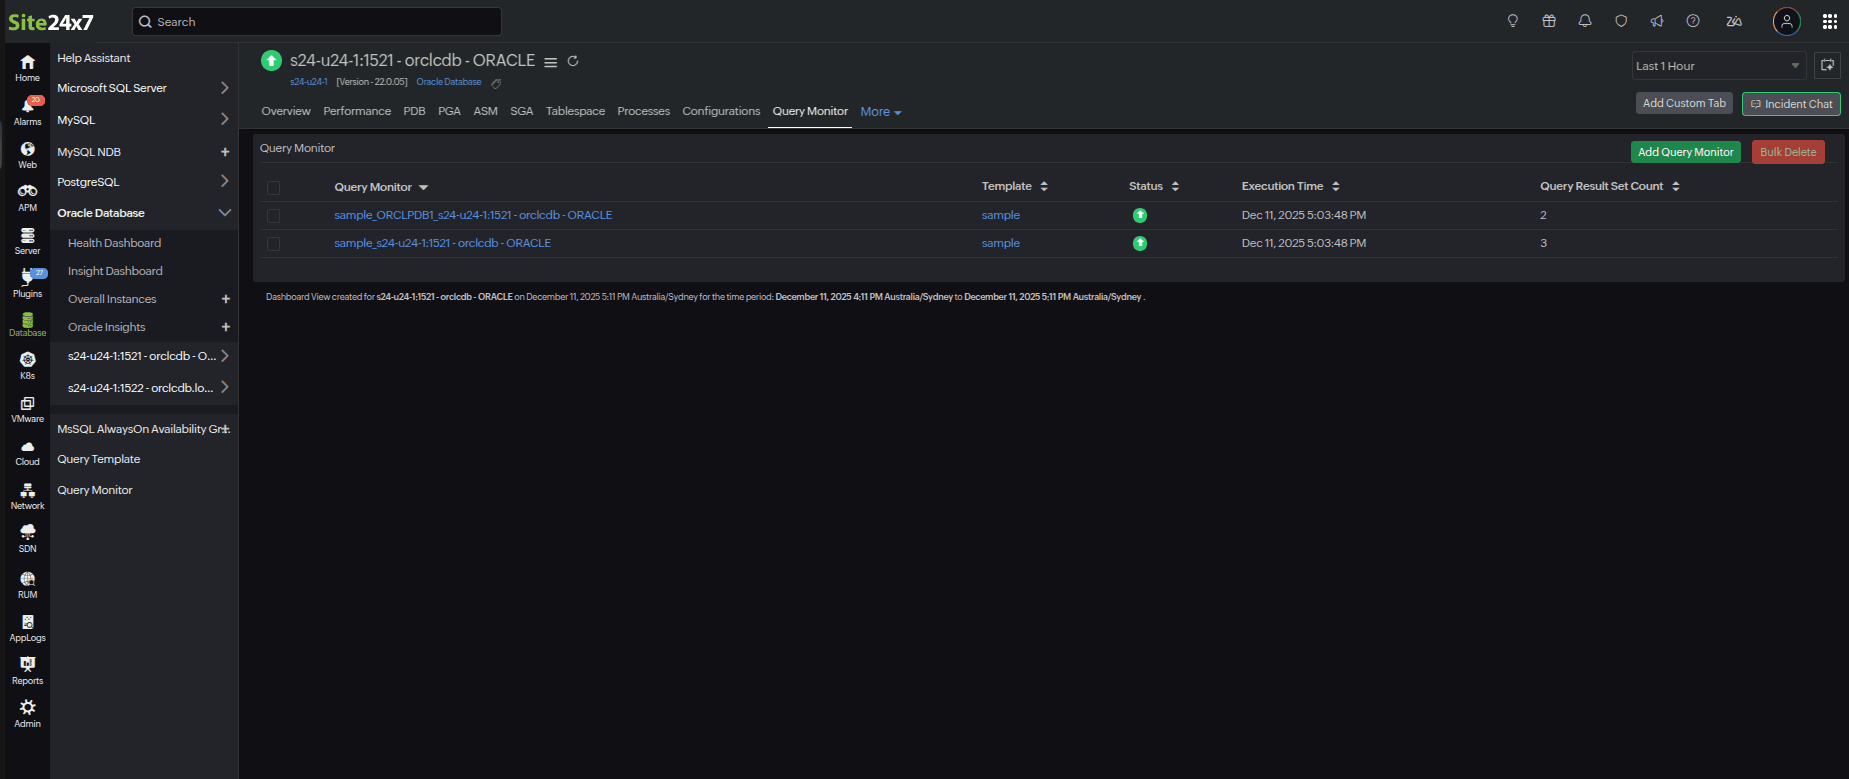
To view the data in your Query Monitor, navigate to the required database monitor and click the Query Monitor tab.