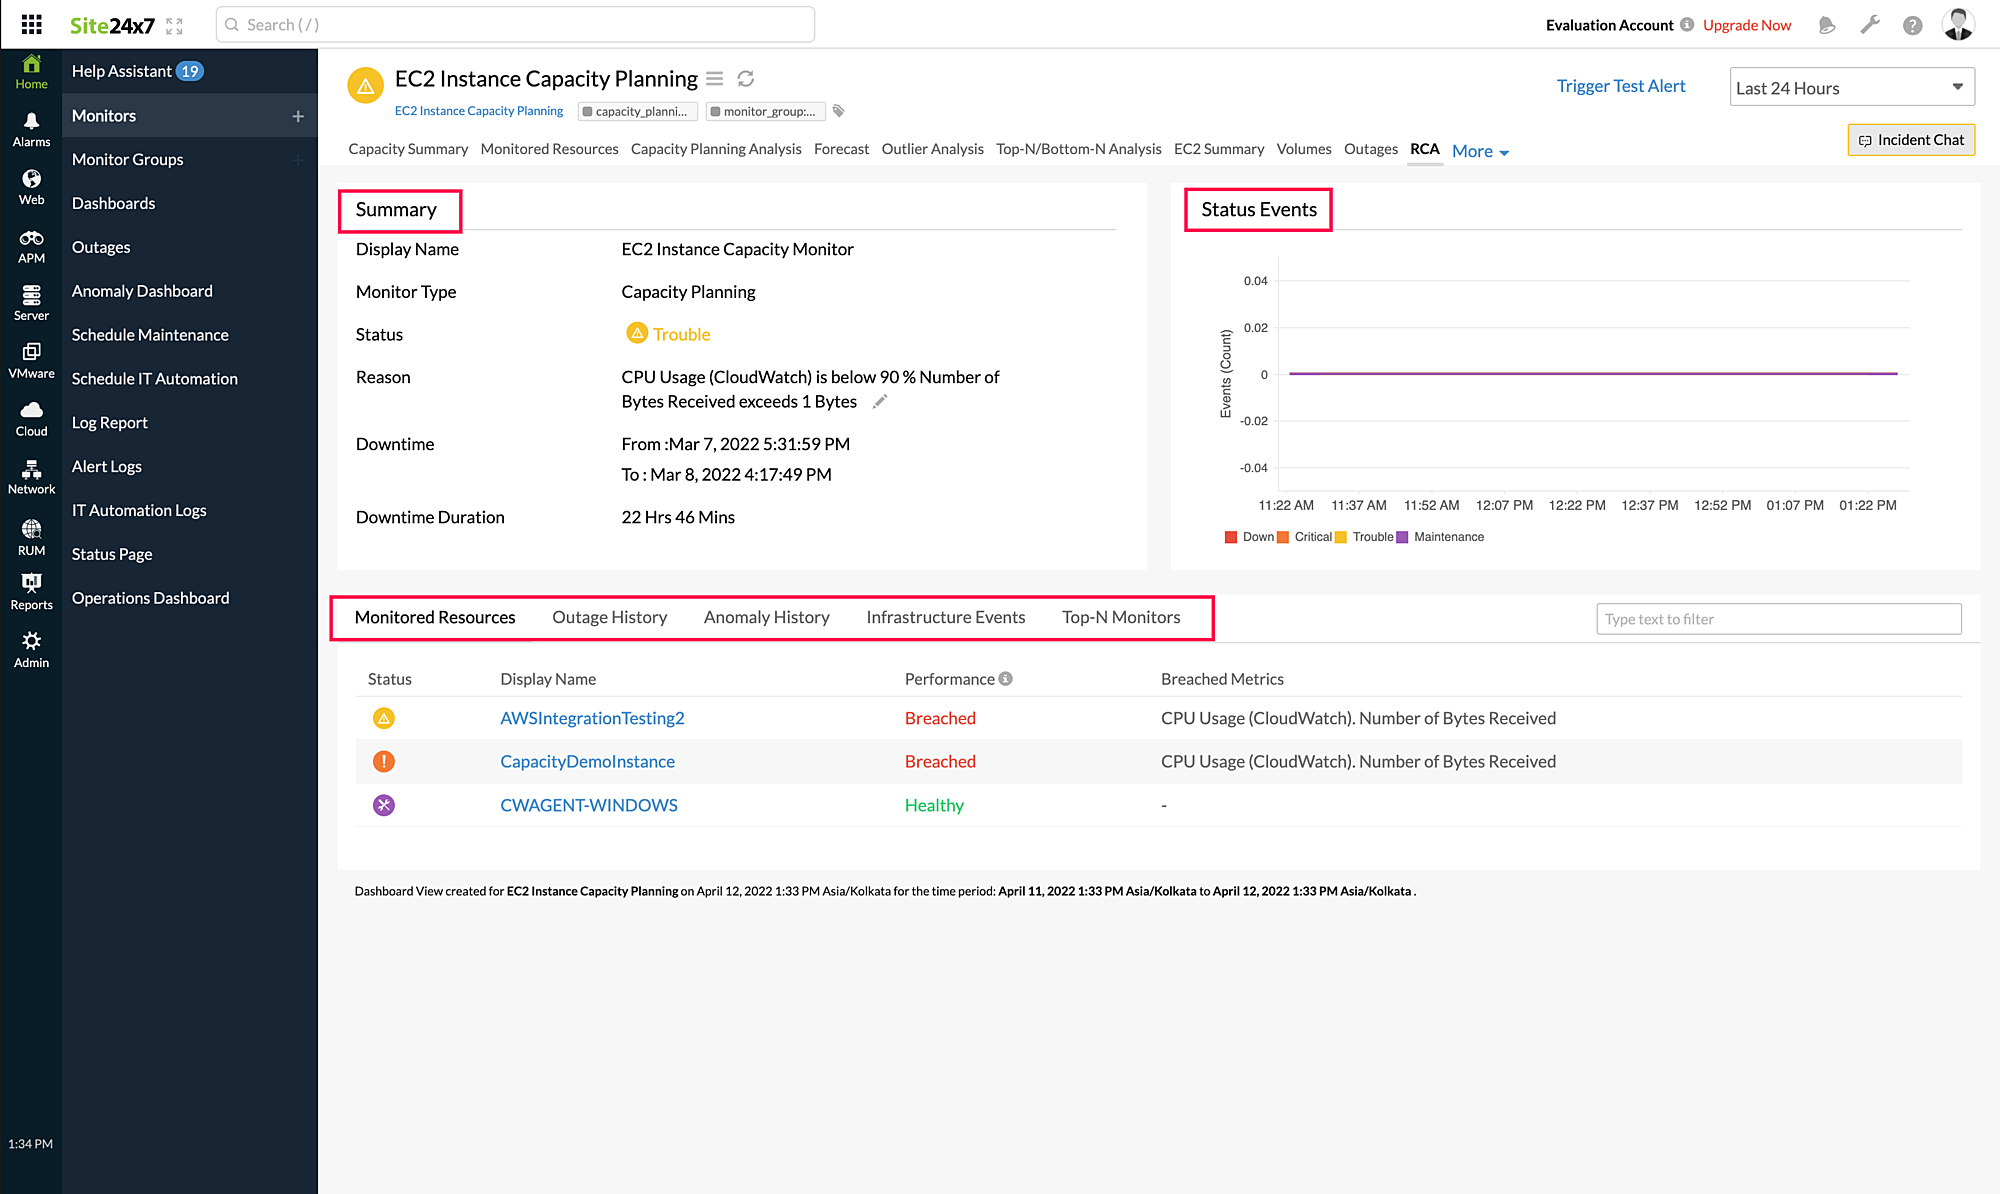
RCA for Capacity Planning Monitors
Every time an outage is detected, a root cause analysis (RCA) report is generated and sent to the user based on the alerting contact and medium. The RCA generated provides the actual reason behind the downtime along with other data like monitored resources, individual resource outages, data on the top-N monitors for the attributes experiencing outages, and anomalies.
Benefits of RCA
The RCA report allows you to:
- Efficiently drill down to the root cause of the outage and resolve it.
- Take steps to eliminate the issue from happening again in the future.
Use case
If a resource exceeds the allowed threshold limit for CPU utilization, then the reason for the issue along with other data is displayed in the RCA report and sent to the user. This will help in quicker troubleshooting and prevent similar downtime issues in the future.
Summary
Obtain details like Display Name, Monitor Type, Status, Reason, Downtime, and Downtime Duration from the Summary tab.
Status Events
Obtain the status of events for your resources recorded in the past 24 hours in the Status Events tab. The status could be Down, Critical, Trouble, or Maintenance.
Monitored Resources
From this tab, you can view all the resources mapped under the respective Capacity Planning Monitor along with their statuses, performance, and the breached metrics. Consider that you have five resources mapped under the Capacity Planning monitor with the CPU utilization threshold configured as 90%. If two resources exceed the CPU utilization threshold of 90%, then for those two resources, the performance status will be marked as Breached. See the Monitored Resources documentation for more details.
Outage History
You can view the details of your resource outage mapped to the Capacity Planning Monitor in the Outage History tab. Only the monitors that had an outage for the last 24 hours are listed in this tab.
Anomaly History
You can view the anomaly history for the last 24 hours along with other details like severity and cause analysis identified for the particular resource mapped to the Capacity Planning Monitor in the Anomaly History tab.
Top-N Monitors
You can view the top monitors with the metrics that breached the thresholds in the Top-N Monitors tab. For instance, if you have a monitor that breached the threshold limits for CPU Utilization and Number of Bytes Received, then you can view the top monitors for these metrics in two different Top-N Monitors sections.

