
Azure Inventory Dashboard
The Inventory Dashboard gives you a consolidated view of all your Azure monitors across subscriptions, resource groups, and resource types. Use it to check monitor status at a glance, filter by resource type or subscription, group monitors by different dimensions, and take bulk actions—all from a single page.
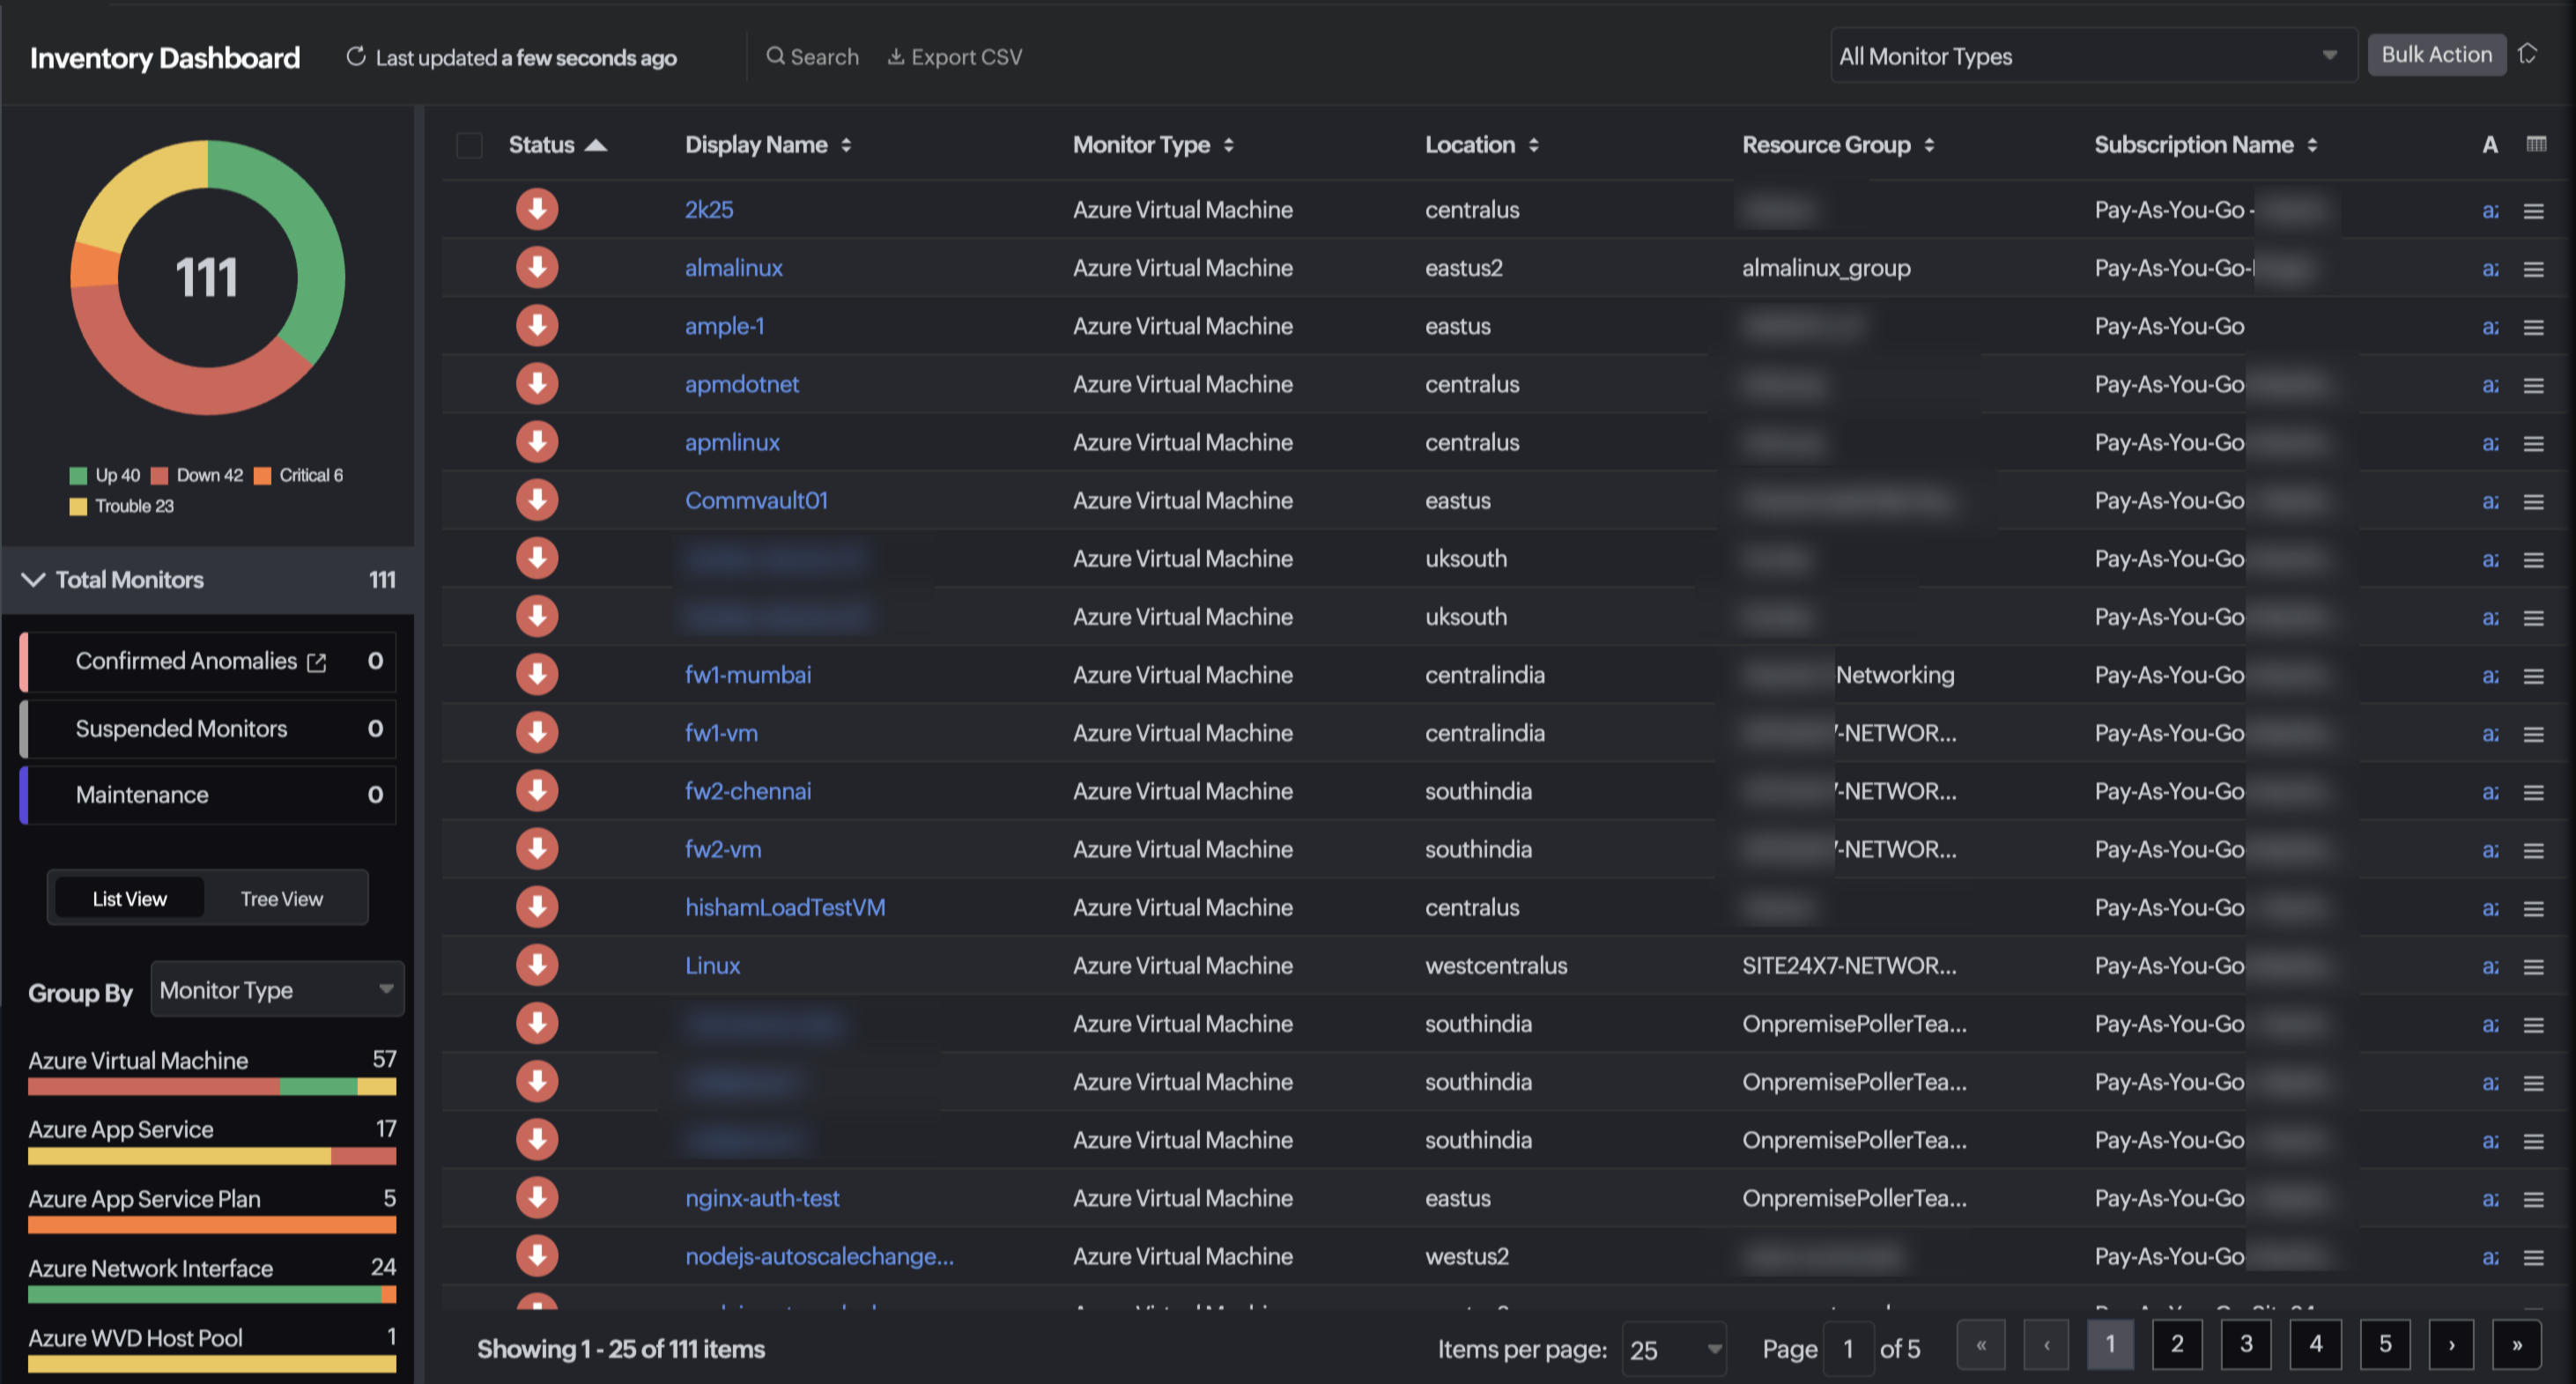
Navigate to the Azure Inventory Dashboard
Go to Cloud > Azure > Inventory Dashboard.
Monitor summary panel
The left panel provides an at-a-glance health summary of all your Azure monitors:
- A donut chart displays the total monitor count broken down by status—Up, Down, Critical, and Trouble. Click any segment to filter the table to monitors in that state.
- Total Monitors shows the overall count with the following breakdowns:
- Confirmed Anomalies: Monitors where Site24x7 has confirmed an anomaly. Click the external link icon to view them in the Anomalies view.
- Suspended Monitors: Monitors that have been suspended and are not actively collecting data.
- Maintenance: Monitors currently in a scheduled maintenance window.
- Use the List View and Tree View toggle buttons to switch between a flat list and a hierarchical view of your monitors.
Filter and search monitors
Use the controls in the top bar to narrow down the monitors displayed in the table:
- Search: Search for the required monitor with a search bar in each column.
- All Monitor Types dropdown: Filter the table to a specific Azure resource type (for example, Azure Virtual Machine, Azure SQL Database, Azure App Service). The dropdown includes a search field to find a specific resource type quickly. Select All Monitor Types to clear the filter and show all monitors.
- Export CSV: Export the current table view as a CSV file.
- More: Access additional options for the dashboard.
Group By
Use the Group By dropdown in the left panel to reorganize monitors into groups. The following grouping options are available:
- Monitor Type (default): Groups monitors by Azure resource type, with a count and color-coded status bar for each type.
- Location: Groups monitors by Azure region (for example, East US, West Europe).
- Resource Group: Groups monitors by the Azure resource group they belong to.
- Subscription: Groups monitors by the Azure subscription they belong to.
Click any group in the left panel to filter the inventory table to monitors in that group.
Inventory table
The inventory table lists all Azure monitors across your subscriptions. For example, filtering for Virtual Machines will show the data related to it like memory and CPU utilization. The table supports sorting on all columns by clicking the column header. The following columns are displayed:
| Column | Description |
|---|---|
| Status | The current health status of the monitor, indicated by a color-coded icon—Down (red), Critical (orange), Up (green), or Trouble (yellow). |
| Display Name | The name of the Azure resource monitor. Click the name to navigate to the monitor's detail page. |
| Monitor Type | The Azure resource type of the monitor (for example, Azure Virtual Machine, Azure SQL Database, Azure App Service). |
| Location | The Azure region where the resource is deployed (for example, East US, West Europe). |
| Resource Group | The Azure resource group the resource belongs to. |
| Subscription | The Azure subscription the resource belongs to. Click the subscription name to navigate to the subscription monitor. |
Click the hamburger  icon at the end of any row to perform actions on that individual monitor, such as edit, schedule maintenance, suspend, or delete.
Use the Items per page dropdown at the bottom of the table to control how many monitors are shown per page. Use the page navigation controls to move between pages.
Bulk Action
Select one or more monitors using the checkboxes in the table, then click Bulk Action to perform actions across multiple monitors at once. Click Bulk Action to view the full list of supported bulk operations for Azure monitors and perform administrative actions on monitors you select.
Set as landing page
In the top-right corner of the page, click the Home icon to set this Inventory Dashboard page as the default landing page whenever you log in to Site24x7.