Monitoring Azure Functions
Azure Functions is a serverless computing platform that allows you to write less code, manage less infrastructure, and save money. Rather than worrying about establishing and managing servers, Azure Functions' cloud architecture delivers all of the current resources necessary to keep your apps running.
With Site24x7's integration, you can now monitor your hosted functions with reliable metrics, define thresholds, and get alerts when there is a breach.
Setup and configuration
Adding Azure Functions while configuring a new Azure monitor
If you haven't configured an Azure monitor yet, add one by following the steps below:
- Log in to your Site24x7 account.
- Choose Cloud from the left navigation pane, select Azure > Add Azure Monitor. You can also follow these steps to add an Azure monitor.
- During Azure monitor configuration, in the Edit Azure Monitor page, select Azure Functions from the Service/Resource Types drop-down.
Adding Azure Functions to an existing Azure monitor
If you already have an Azure monitor configured for the tenant, you can add Azure Functions by using the following steps:
- Log in to your Site24x7 account.
- Navigate to the Infrastructure, Inventory, or Management Dashboard from the left pane of the Azure monitor for which you wish to add an Azure functions monitor.
- Click the hamburger icon
 and then Edit, which will bring you to the Edit Azure Monitor page.
 - In the Edit Azure monitor page, select the corresponding Subscription and Resource Group from the drop-down menu, select Azure Functions from the Service/Resource Types drop-down, and click Save.
After successful configuration, go to Cloud > Azure, select Azure Functions from the Azure monitor drop-down. Now you can view the discovered Azure Functions.
It will take 15-30 minutes to discover new Azure resources. For immediate discovery of the selected configuration, go to the Infrastructure Dashboard of the Azure monitor and click on Discover Now from the ![]() icon.
icon.
Polling frequency
Site24x7's Azure Functions Monitor collects metric data every minute and the statuses from your functions every five minutes.
Supported metrics
The following metrics are collected:
| Metric name | Description | Statistic | Unit |
|---|---|---|---|
| Requests | The total number of requests regardless of their resulting HTTP status code | Total | Count |
| Data In | The amount of incoming bandwidth consumed by the application | Average | Bytes |
| Data Out | The amount of outgoing bandwidth consumed by the application | Average | Bytes |
| Http Server Errors | The number of requests resulting in an HTTP status code between 500-599 | Total | Count |
| Memory Working Set | The current amount of memory used by the application | Average | Bytes |
| Average Memory Working Set | The average amount of memory used by the application | Average | Bytes |
| Function Execution Units | The number of function units executed | Average | Mbps |
| Function Execution Count | The number of functions executed | Total | Count |
| Private Bytes | The current amount of memory that the app process has allocated that can't be shared with other processes | Average | Bytes |
| IO Read Bytes Per Second | The rate at which the app process is reading bytes from input/output (I/O) operations | Average | Bytes per second (Bps) |
| IO Write Bytes Per Second | The rate at which the app process is writing bytes to I/O operations | Average | Bps |
| IO Other Bytes PerSecond | The rate at which the app process is issuing bytes to I/O operations that don't involve data, such as control operations | Average | Bps |
| IO Read Operations Per Second | The rate at which the app process is issuing read I/O operations | Average | Bps |
| IO Write Operations Per Second | The rate at which the app process is issuing write I/O operations | Average | Bps |
| IO Other Operations Per Second | The rate at which the app process is issuing I/O operations that aren't read or write operations | Average | Bps |
| Requests In Application Queue | The number of requests in the application request queue | Average | Count |
| Current Assemblies | The current number of assemblies loaded across all AppDomains in this application | Average | Count |
| Total App Domains | The current number of AppDomains loaded in this application | Average | Count |
| Total App Domains Unloaded | The total number of AppDomains unloaded since the start of the application | Average | Count |
| Gen 0 Garbage Collections | The number of times the generation 0 objects are garbage collected since the start of the app process: higher generation Garbage Collections (GCs) include all lower generation GCs | Average | Count |
| Gen 1 Garbage Collections | The number of times the generation 1 objects are garbage collected since the start of the app process: higher generation GCs include all lower generation GCs | Average | Count |
| Gen 2 Garbage Collections | The number of times the generation 2 objects are garbage collected since the start of the app process | Average | Count |
Azure Uptime monitoring
Site24x7’s Azure Uptime monitoring enables proactive tracking of your Azure resources’ availability and uptime, along with their configuration and inventory details. Note that uptime monitoring will disable performance metric data collection.
Threshold configuration
Global configuration
- Go to the Admin section in the left navigation pane.
- Select Configuration Profiles from the left pane and choose the Threshold and Availability (+) tab from the drop-down menu. Click on Add Threshold Profile in the top-right corner.
- Choose the monitor type as Azure Functions.
Now you can set the threshold values for all the metrics mentioned above.
Monitor-level configuration
- Go to Cloud > Azure and select Azure Functions from the drop-down menu.
- Choose a resource for which you would like to set a threshold and then click the hamburger icon
 . Choose the Edit option, which will direct you to the Edit Azure Functions Monitor page.
You can set the threshold values for the metrics by selecting the Threshold and Availability option. You can also configure IT Automation at the attribute level.
IT Automation
Site24x7's IT Automation tools help auto-resolve performance degradation issues. The alarm engine continually evaluates the system events for which thresholds are set, and executes the mapped automation when there is a breach.
How to configure IT Automation for a monitor.
Configuration Rules
Configure parameters like Threshold Profile, Notification Profile, Tags, Monitor Group, and others for multiple monitors with Site24x7's Configuration Rules. You can run a scan and associate any of the previously generated rules that suit the monitor configurations while adding new monitors.
How to add a configuration rule.
Summary
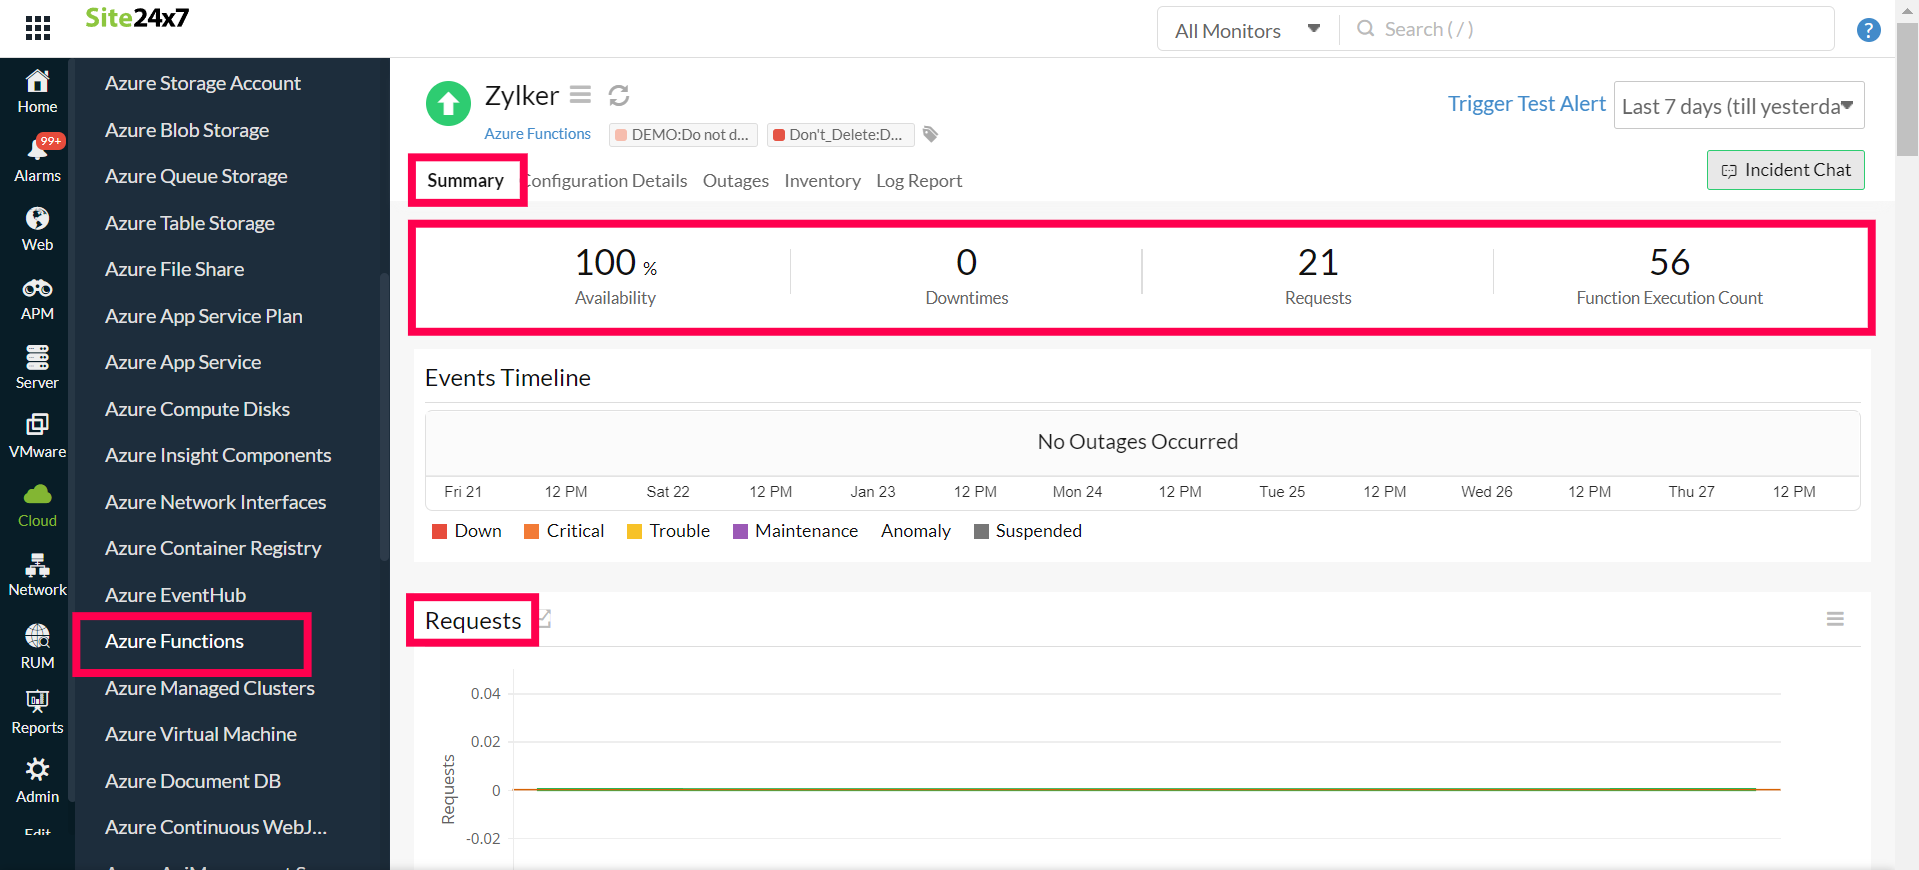
The Summary tab will give you the performance data organized by time for the above mentioned metrics.
- To view the summary, go to Cloud > Azure and click the Azure monitor > Azure Functions.
- Click a resource and select the Summary tab.
By doing so, you can view the Data In, Data Out, HTTP Server Errors, Function Execution Count, and much more.
Configuration Details
The Configuration Details of an application instance are provided under this tab. Here, you'll find the Host Names, Site Properties, SSL Certificates, Server Farm Details, and so on.
- To get the configuration details, go to Cloud > Azure and click the Azure monitor > Azure Functions.
- Click a resource and select the Configuration Details tab.
Reports
Gain in-depth data about the various parameters of your monitored resources and highlight your service performance using our insightful reports.
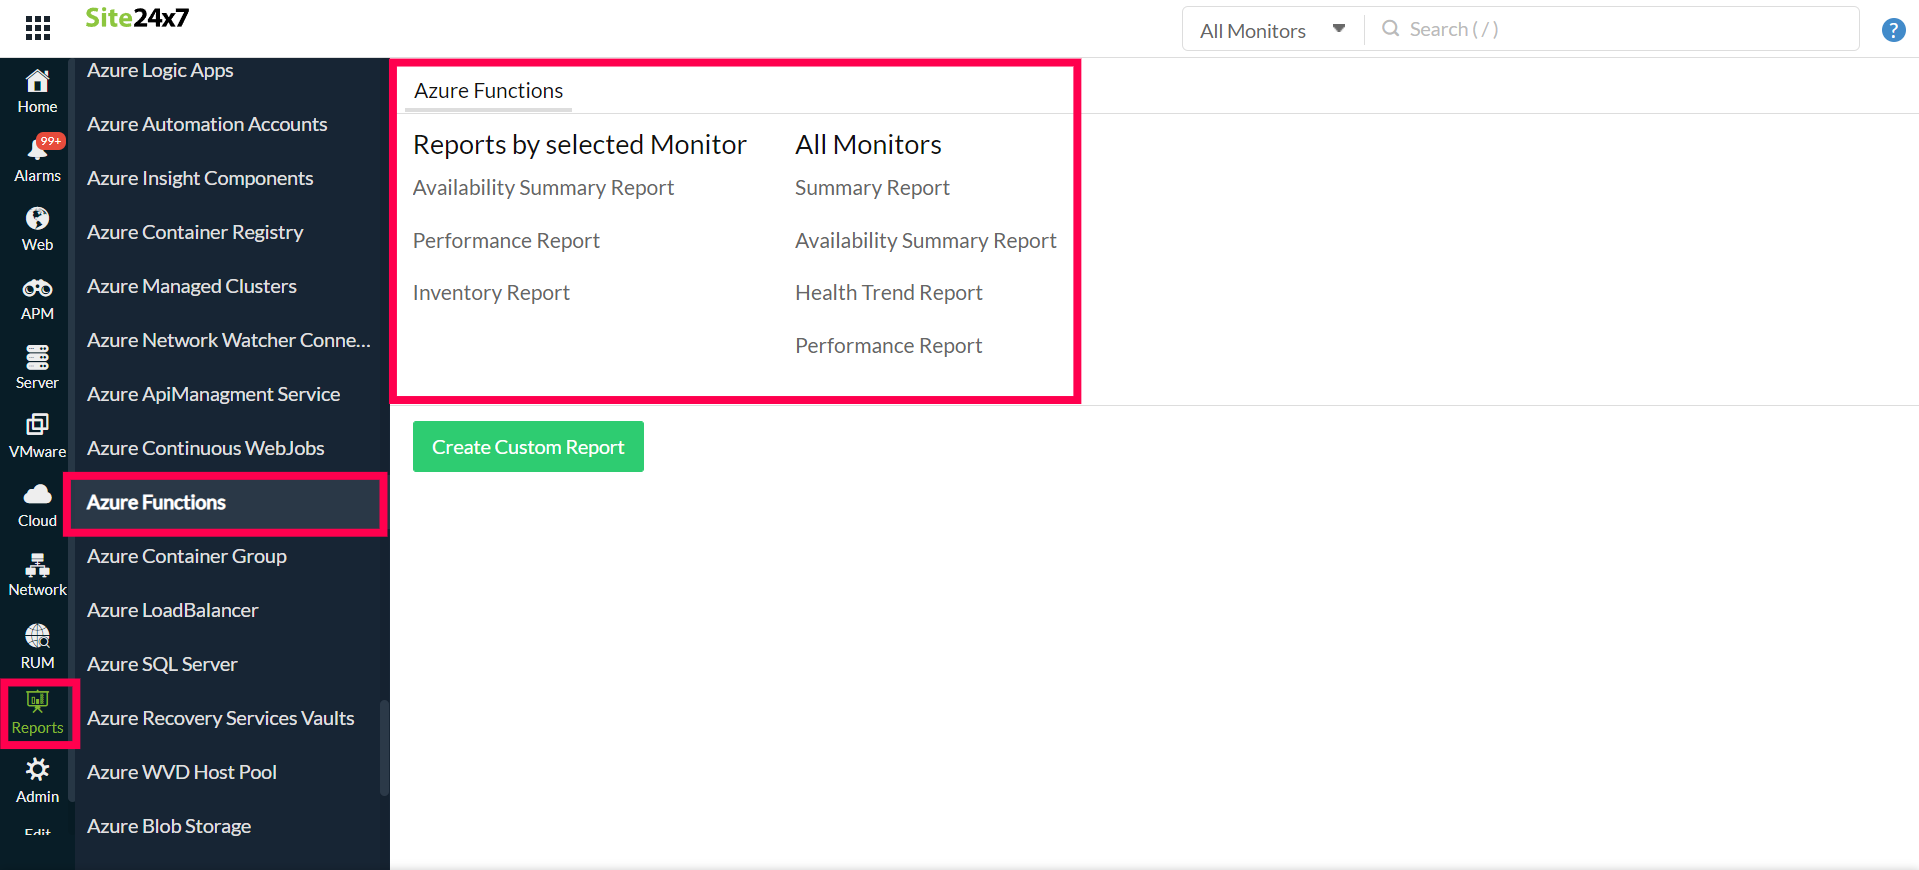
To view reports for Azure Functions:
- Navigate to the Reports section on the left navigation pane.
- Select Azure Functions from the menu on the left.
You can find the Availability Summary Report and the Performance Report for one selected monitor, or you can get the Inventory Report, Summary Report, Availability Summary Report, Health Trend Report, and the Performance Report for all the Azure Functions monitors.

You can also get reports from the Summary tab of the Azure Functions Monitor.
- Go to the Summary tab of the Azure Functions Monitor, and get the Availability Summary Report of the monitor by clicking on Availability or Downtime.
- You can also find the Performance Report of the monitor by clicking on any chart title.

Related links:
How to add an Azure monitor.
How to configure IT automations for a monitor.
How to integrate an Azure App Service monitor.
How to integrate Azure Virtual Machine monitor.
How to configure IT automations for a monitor.
View the list of monitor reports.
