Azure Database for MySQL Flexible Server Monitoring Integration
Azure Database for MySQL flexible server enables users to have a fully managed MySQL database that provides control and is easy to use. While simplifying the cost, the flexible server architecture offers high availability with more flexibility and control over database server parameters.
With Site24x7's integration, you can now monitor your MySQL databases, obtain accurate metrics, configure thresholds, and get instant alerts if there is a breach.
Set up and configuration
- Adding Azure Database for MySQL flexible server while configuring a new Azure monitor
If you haven't configured an Azure monitor yet, add one by following the steps below:
- Log in to your Site24x7 account.
- Go to Cloud > Azure > Add Azure Monitor. You can also follow these steps to add an Azure monitor.
- During Azure monitor configuration, on the Edit Azure Monitor page, select Azure Database for MySQL flexible server from the Service/Resource Types drop-down.
- Adding an Azure Database for MySQL flexible server to an existing Azure monitor
If you already have an Azure monitor configured for the tenant, you can add the Azure Database for MySQL flexible server by following the steps below:
-
- Log in to your Site24x7 account.
- Go to Cloud > Azure, > your Azure monitor, and then navigate to any of the dashboards on the left pane of your Azure monitor.
- Click the hamburger
 icon and then Edit, which will bring you to the Edit Azure Monitor page.
 - In the Edit Azure Monitor page, select the corresponding Subscription and Resource Group from the drop-down, select Azure Database for MySQL flexible server from the Service/Resource Types drop-down, and click Save.
- After successful configuration, go to Cloud > Azure and select Azure Database for MySQL flexible server from the Azure Monitor drop-down. Now you can view the discovered database for MySQL flexible servers.
It will take 15 to 30 minutes to discover new Azure resources. For immediate discovery of the selected configuration, go to the Infrastructure Dashboard of the Azure monitor, hover over the hamburger icon, and select Discover Now.
Polling frequency
Azure database for MySQL flexible server metrics are collected every minute, and the statuses of your database for MySQL flexible servers are updated every five minutes.
Supported metrics
The following metrics are collected:
| Metric name | Description | Statistic | Unit |
|---|---|---|---|
| Capacity | |||
| Host CPU Percent | The average of CPU utilized by the MySQL server host. | Average | Percentage |
| Memory Percent | The average of memory used on the MySQL server host. | Average | Percentage |
| Storage IO Percent | The average of IOPS (Input/Output operations per second) utilization for storage. | Average | Percentage |
| Storage Percent | The average of provisioned storage consumed by the server. | Average | Percentage |
| Slow Queries | The total number of slow queries identified by the server. | Total | Count |
| Threads Running | The total number of active threads executing queries. | Total | Count |
| Total Connections | The total number of client connections established with the server. | Total | Count |
| Active Connections | The average number of client connections currently executing queries. | Average | Count |
| Aborted Connections | The total number of failed connection attempts. | Total | Count |
| Active Transactions | The average number of open transactions currently running. | Average | Count |
| Connection Usage | The average of maximum connections currently in use. | Average | Percentage |
| Serverlog Storage Percent | The average of allocated log storage currently used. | Average | Percentage |
| CPU Credits Remaining | The remaining CPU burst credits (for burstable pricing tiers like B1/B2). | Average | Count |
| CPU Credits Consumed | The average number of CPU burst credits used by the server. | Average | Count |
| Storage Limit | The average allocated storage for the flexible server. | Average | Bytes |
| Storage Used | The average amount of storage currently consumed. | Average | Bytes |
| Host Network In | The total number of bytes received by the MySQL server over the network. | Total | Bytes |
| Host Network Out | The total number of bytes sent by the MySQL server over the network. | Total | Bytes |
| Serverlog Storage Used | The average amount of log storage currently consumed. | Average | Bytes |
| Serverlog Storage Limit | The average size allocated for server logs. | Average | Bytes |
| Replication Lag In Seconds | The average time delay between primary and replica server data replication. | Average | Seconds |
| HA Replication Lag | The average replication lag in seconds in a high availability setup. | Average | Seconds |
| MySQL Uptime | The average uptime of the MySQL server since the last restart. | Average | Days |
| MySQL Lock Deadlocks | The average number of deadlock events detected by the server. | Average | Count |
| MySQL Lock Timeouts | The average number of lock wait timeout events encountered. | Average | Count |
| MySQL History List Length | The average length of the InnoDB undo log history list. | Average | Count |
| Storage IO Count | The total number of I/O operations on the server’s storage. | Total | Count |
| Data Storage Used | The average amount of storage used by MySQL data files. | Average | Bytes |
| Ibdata1 Storage Used | The average storage space used by the ibdata1 file in InnoDB. | Average | Bytes |
| Binlog Storage Used | The average storage space used by binary logs. | Average | Bytes |
| Others Storage Used | The average storage consumed by miscellaneous files (e.g., temporary, error logs). | Average | Bytes |
| Backup Storage Used | The average storage space used by automated and manual backups. | Average | Bytes |
| Sort Merge Passes | The total number of merge passes that occurred during sort operations. | Total | Count |
| Traffic | |||
| Queries | The total number of SQL statements executed by the server. | Total | Count |
| Com Select | The total number of SELECT queries executed. | Total | Count |
| Com Update | The total number of UPDATE queries executed. | Total | Count |
| Com Insert | The total number of INSERT queries executed. | Total | Count |
| Com Delete | The total number of DELETE queries executed. | Total | Count |
| Com Create DB | The total number of CREATE DATABASE operations performed. | Total | Count |
| Com Drop DB | The total number of DROP DATABASE operations performed. | Total | Count |
| Com Alter Table | The total number of ALTER TABLE operations executed. | Total | Count |
| Com Create Table | The total number of CREATE TABLE operations executed. | Total | Count |
| Com Drop Table | The total number of DROP TABLE operations executed. | Total | Count |
| Replica IO Status | The status of the replication I/O thread (1 = running, 0 = stopped). | Average | Count |
| Replica SQL Status | The status of the SQL thread on the replica (1 = running, 0 = stopped). | Average | Count |
| HA IO Status | The I/O thread status in an HA-enabled flexible server. | Average | Count |
| HA SQL Status | The SQL thread status in an HA-enabled flexible server. | Average | Count |
| InnoDB | |||
| InnoDB Buffer Pool Reads | The total number of physical reads directly from disk into the InnoDB buffer pool. | Total | Count |
| InnoDB Buffer Pool Read Requests | The total number of logical read requests to the InnoDB buffer pool. | Total | Count |
| InnoDB Buffer Pool Pages Free | The total number of free pages in the InnoDB buffer pool. | Total | Count |
| InnoDB Buffer Pool Pages Data | The total number of pages containing data in the buffer pool. | Total | Count |
| InnoDB Buffer Pool Pages Dirty | The total number of modified (dirty) pages not yet flushed to disk. | Total | Count |
| InnoDB Row Lock Time | The average time spent waiting for row locks. | Average | Milliseconds |
| InnoDB Data Writes | The total number of data write operations performed by InnoDB. | Total | Count |
| InnoDB Row Lock Waits | The average number of times a query waited for a row lock. | Average | Count |
| InnoDB Buffer Pool Pages Flushed | The average number of pages flushed from the InnoDB buffer pool to disk. | Average | Count |
Threshold configuration
Global configuration
- Go to the Admin section on the left navigation pane.
- Select Configuration Profiles from the left pane and choose Threshold and Availability (+) on the top-right corner of the page.
- From the drop-down menu, click Add Threshold Profile and choose Azure Database for MySQL flexible server as the monitor type.
You can also set the threshold values for all the metrics mentioned above.
Monitor-level configuration
- Go to Cloud > Azure and select Azure Database for MySQL flexible server from the drop-down menu.
- Choose a resource for which you would like to set a threshold and then click the hamburger icon on the top. Choose the Edit option, which will direct you to the Edit Azure Database for MySQL flexible server Monitor page.
- You can set the threshold values for the metrics by selecting the Threshold and Availability option. You can also configure IT automation at the attribute level.
Default thresholds
Site24x7 alerts you based on a set of default thresholds. These default thresholds ensure that your capacity is not overutilized, thus maintaining optimal storage and performance. The default thresholds are as follows:
- Alert if Resource Health is Unavailable
- Alert if Resource Health is Unknown
IT Automation
Site24x7 offers a set of exclusive IT Automation tools to auto-resolve performance degradation issues. These tools react to events proactively rather than waiting for manual intervention. IT Automation tools help automate repetitive tasks and automatically remediate threshold breaches. The alarms engine continually evaluates system events for which thresholds are set and executes the mapped automation when there is a breach.
How to configure IT Automation for a monitor.
Configuration Rules
Editing multiple monitors to associate different monitor groups or adding a different tag can be a tedious process. With Site24x7's Configuration Rules, you can automate the configuration settings of your monitoring resources. Also, Site24x7 allows you to create custom rules to track configuration changes continuously and achieve the ideal configuration settings.
How to add Configuration Rules.
Summary
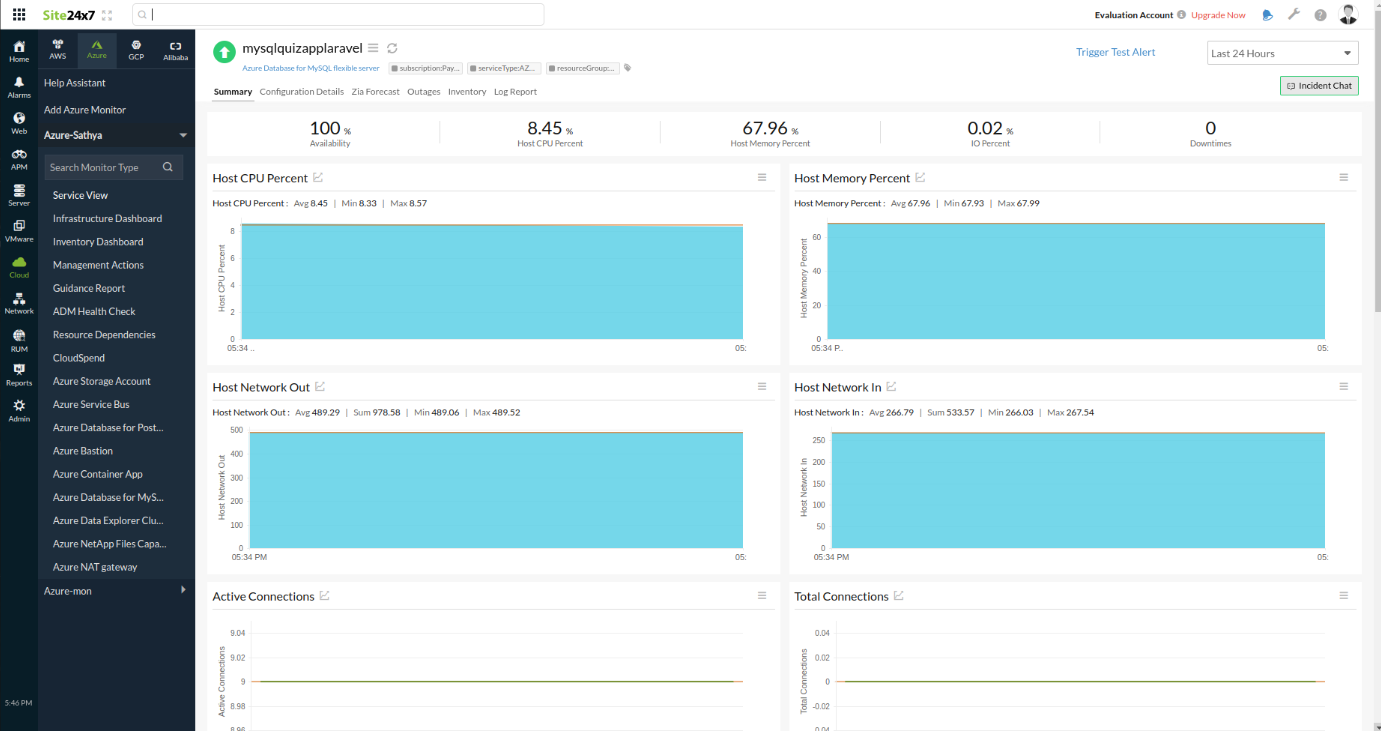
The Summary tab will give you the performance data organized by time for the above-mentioned metrics.
- To view the summary, go to Cloud > Azure and click the Azure monitor > Azure Database for MySQL flexible server.
- Click a resource and select the Summary tab.
By doing so, you can view metrics like Aborted Connections, Active Connections, Backup Storage Used, and many more.
Configuration Details
The Configuration Details tab provides details on configurations for the resource such as ID, IOPS, State, Storage Size GB, Backup Retention Days, and so on.
- To get the configuration details, go to Cloud > Azure and click the Azure monitor > Azure Database for MySQL flexible server.
- Click a resource and select the Configuration Details tab.
Reports
Gain in-depth data about the various parameters of your monitored resources and accentuate your service performance using our insightful reports.
To view reports for an Azure Database for MySQL flexible server:
- Navigate to the Reports section on the left navigation pane.
- Select Azure Database for MySQL flexible server from the menu on the left.
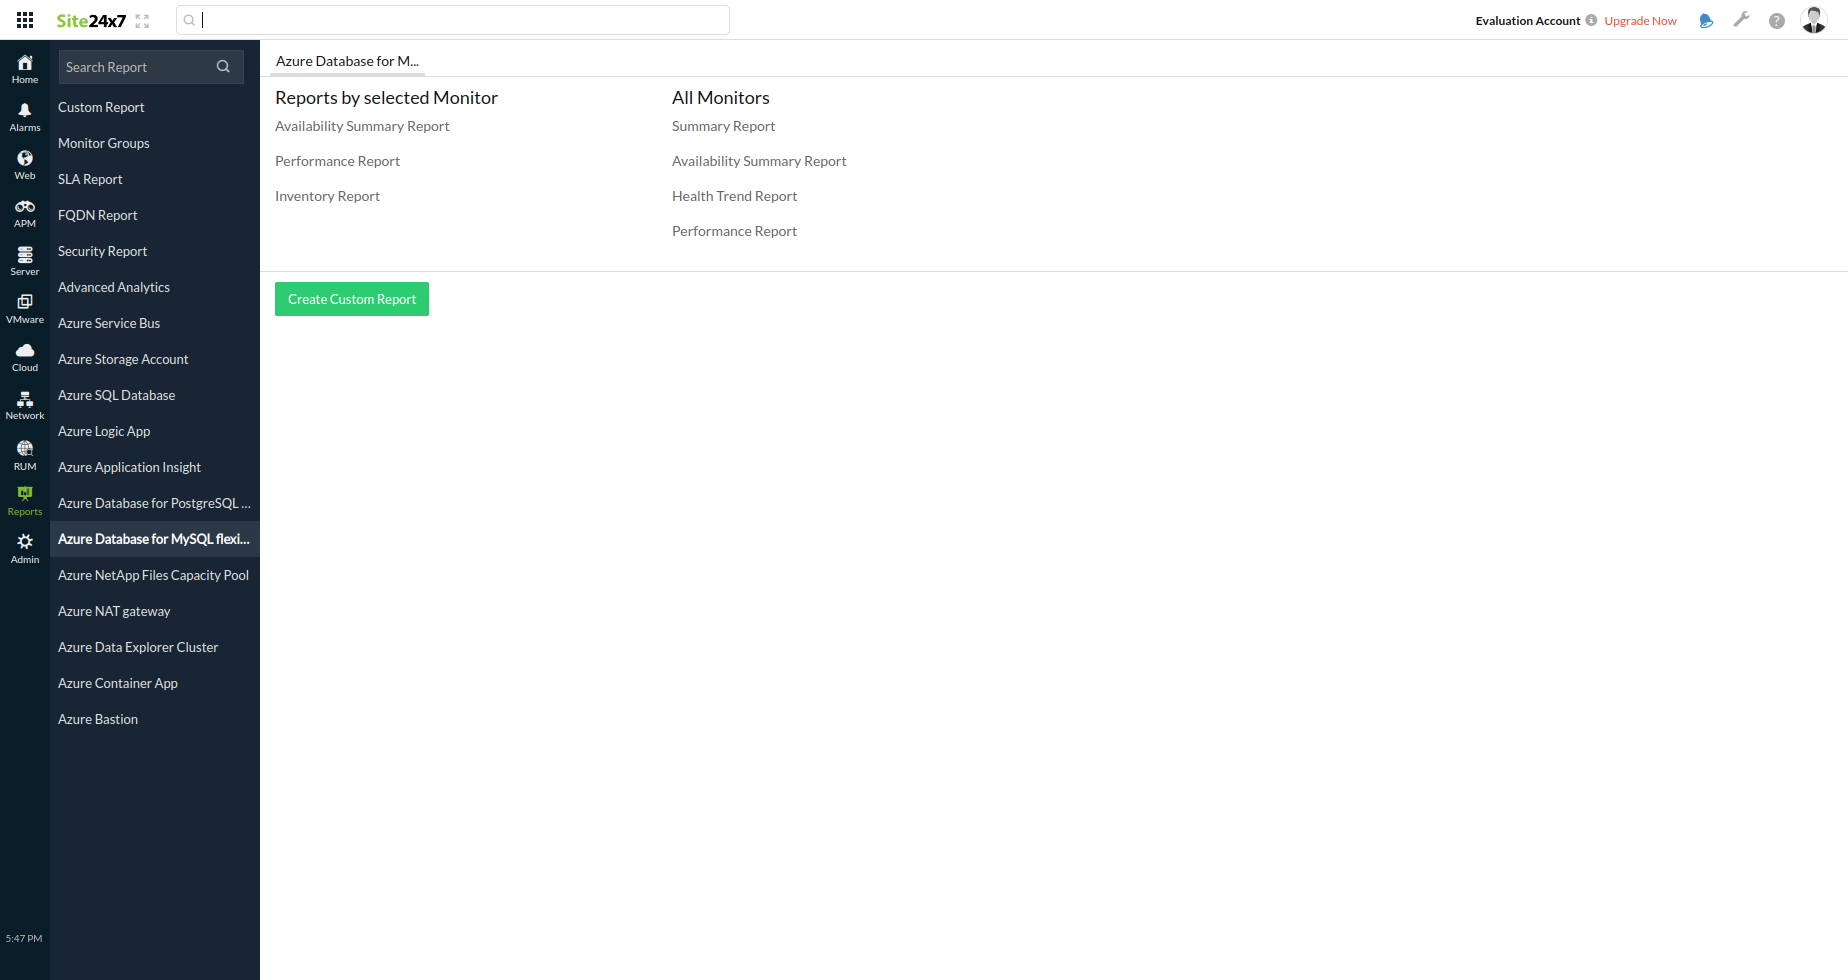
You can find the Availability Summary Report and the Performance Report for one selected monitor, or you can get the Inventory Report, Summary Report, Availability Summary Report, Health Trend Report, and the Performance Report for all the Database for MySQL flexible server monitors.
You can also get reports from the Summary tab of the Azure Database for MySQL flexible server monitor.
- Go to the Summary tab of the Azure Database for MySQL flexible server monitor, and get the Availability Summary Report of the monitor by clicking Availability.
You can also find the Performance Report of the monitor by clicking on any chart title.