Azure Cosmos DB for PostgreSQL Cluster monitoring integration
Azure Cosmos DB for PostgreSQL offers a distributed relational database solution that enables you to create scalable PostgreSQL apps.
With Site24x7's integration, now you can monitor your database with accurate metrics, configure thresholds, and get instant alerts if there is a breach.
Setup and configuration
Adding an Azure Cosmos DB for PostgreSQL Cluster while configuring a new Azure monitor
If you haven't configured an Azure Monitor yet, add one by following the steps below:
- Log in to your Site24x7 account.
- Choose Cloud from the left navigation pane, and select Azure > Add Azure Monitor. You can also follow these steps to add an Azure Monitor.
- During Azure monitor configuration, in the Add Azure Monitor page, select Azure Cosmos DB for PostgreSQL Cluster along with other required resource types from the Service/Resource Types drop-down. Check if you have configured the corresponding Resource groups and Tag filters in the Edit page.
Adding an Azure Cosmos DB for PostgreSQL Cluster to an existing Azure monitor
If you already have an Azure monitor configured for the tenant, you can add the Azure Cosmos DB for PostgreSQL Cluster using the following steps:
- Log in to your Site24x7 account.
- Navigate to Cloud > Azure > select the Azure monitor from the left pane for which you wish to add an Azure Cosmos DB for PostgreSQL Cluster.
- In the Service View page, click the Enable Monitoring button in the Azure Cosmos DB for PostgreSQL Cluster Service type. Check if you have configured the corresponding Resource groups and Tag filters in the Edit page.
It will take 15-30 minutes to discover new Azure resources. To immediately discover the selected configuration, click Discover Now in the top-right corner, by doing which all the resources that match the filters configured in Azure Edit page will be discovered even if the Auto-Discover New Resources option is disabled.
Now, you can view the discovered databases from the Service View dashboard itself.
Polling frequency
Site24x7's Azure Cosmos DB for PostgreSQL Cluster monitor collects metric data every minute and the statuses from your applications every five minutes.
Supported metrics
| Metric | Description | Statistic | Unit |
| Active Connections | The number of active connections | Average | Count |
| Reserved Memory percent | The percentage of commit memory limit reserved by applications | Average | Percent |
| CPU Credits Consumed | The total number of credits consumed by the node. Only available when burstable compute is provisioned on the node. | Average | Count |
| CPU Credits Remaining | The total number of credits available to burst. Only available when burstable compute is provisioned on the node. | Average | Count |
| CPU percent | The average amount of CPU | Average | Percent |
| IOPS | The number of IO (Input-Output) operations per second | Average | Count |
| Memory percent | The average amount of memory | Average | Percent |
| Network Out | The total amount of network outgoing across active connections | Total | Bytes |
| Network In | The total amount of network incoming across active connections | Total | Bytes |
| Replication lag | The amount of read replica nodes that are behind their counterparts in the primary cluster | Average | Milliseconds |
| Storage percent | The average amount of storage | Average | Percent |
| Storage used | The average amount of storage used | Average | Bytes |
| VM Cached Bandwidth Consumed Percentage | The average percentage of cached disk bandwidth consumed by the VM | Average | Percent |
| VM Cached IOPS Consumed Percentage | The average percentage of cached disk IOPS consumed by the VM | Average | Percent |
| VM Uncached Bandwidth Consumed Percentage | The average percentage of uncached disk bandwidth consumed by the VM | Average | Percent |
| VM Uncached IOPS Consumed Percentage | The average percentage of uncached disk IOPS consumed by the VM | Average | Percent |
Threshold configuration
Associating a threshold profile can be done from the monitor Edit page:
- Under Configuration Profiles > Threshold and Availability > select the corresponding threshold profile from the drop-down.
 pencil icon respectively.
Bulk Action:
Bulk association of threshold profiles can be done from Admin page (Admin > Inventory > Bulk Action > Under Monitor Configuration, go to Modify Threshold Profile).
You can set the threshold values for the metrics by selecting the Threshold and Availability option. You can also configure IT automation at the attribute level.
Default thresholds
Site24x7 alerts you based on a set of default thresholds. These default thresholds ensure that your database capacity is not overutilized, thus maintaining optimal storage and performance. This also helps in reducing costs. The default thresholds are provided for the below metrics:
- Coordinator Server Edition Changed
- Coordinator Storage Quota Changed
- Node Storage Quota Changed
- Coordinator VCore Changed
- Node VCore Changed
- CPU percent
- Memory percent
- Storage percent
- Active Connections
IT automation
Site24x7 offers a set of exclusive IT automation tools to auto-resolve performance degradation issues. These tools react to events proactively rather than waiting for manual intervention.
How to configure IT Automation for a monitor.
Configuration Rules
With Site24x7's Configuration Rules, you can set parameters like Threshold Profile, Notification Profile, Tags, and Monitor Group for multiple monitors. These rules can be configured and run for the existing or new monitors (during addition) matching the given criteria.
How to add a configuration rule.
Reports
Gain in-depth data about the various parameters of your monitored resources and accentuate your service performance using our insightful reports.
To view reports for an Azure Cosmos DB for PostgreSQL Cluster:
- Navigate to the Reports section on the left navigation pane.
- Select Azure Cosmos DB for PostgreSQL Cluster from the menu on the left.
You can find the Availability Summary Report, and Performance Report for one selected monitor, or you can get the Inventory Report, Summary Report, Availability Summary Report, Health Trend Report, and Performance Report for all the monitors.
Schedule reports
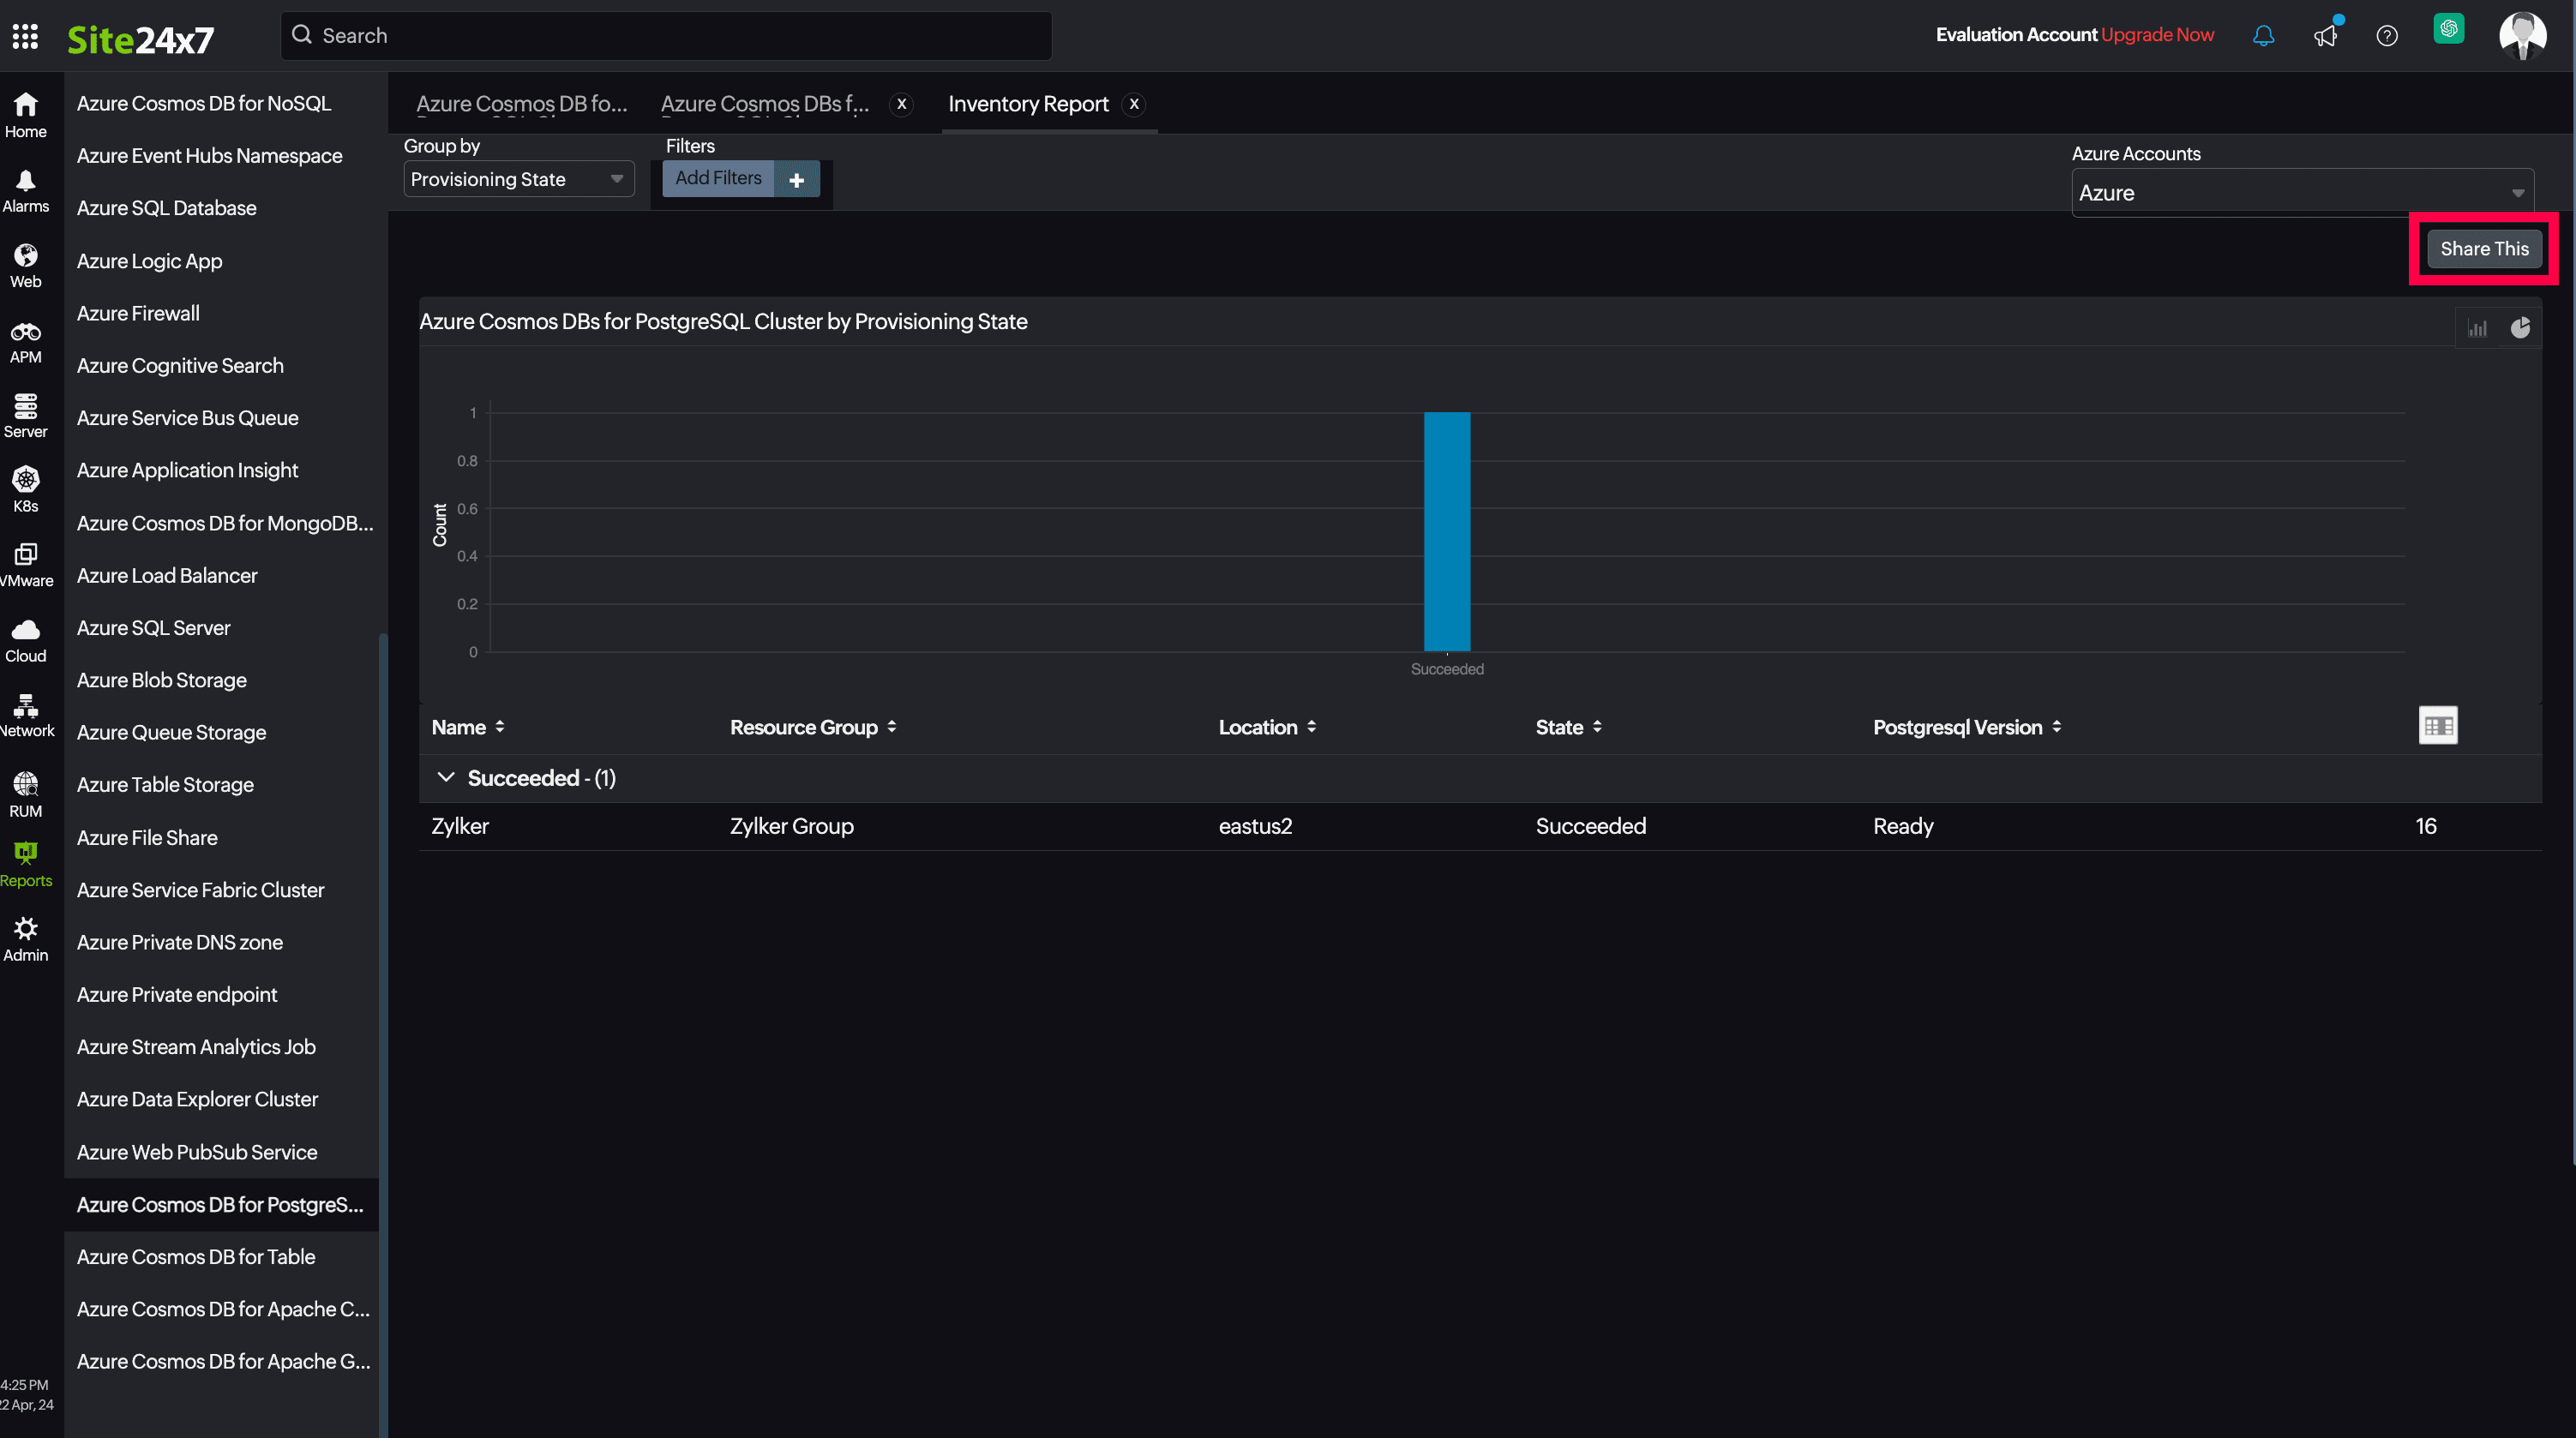
You can also schedule the Inventory Report by navigating to Reports > Azure Cosmos DB for PostgreSQL Cluster > Inventory Report and clicking the Share This button at the top-right corner. In the Schedule Report pop-up, choose the monitor, assign the desired frequency—daily, weekly, monthly, or quarterly—and receive the regular reports of your inventory details to the groups that you desire.

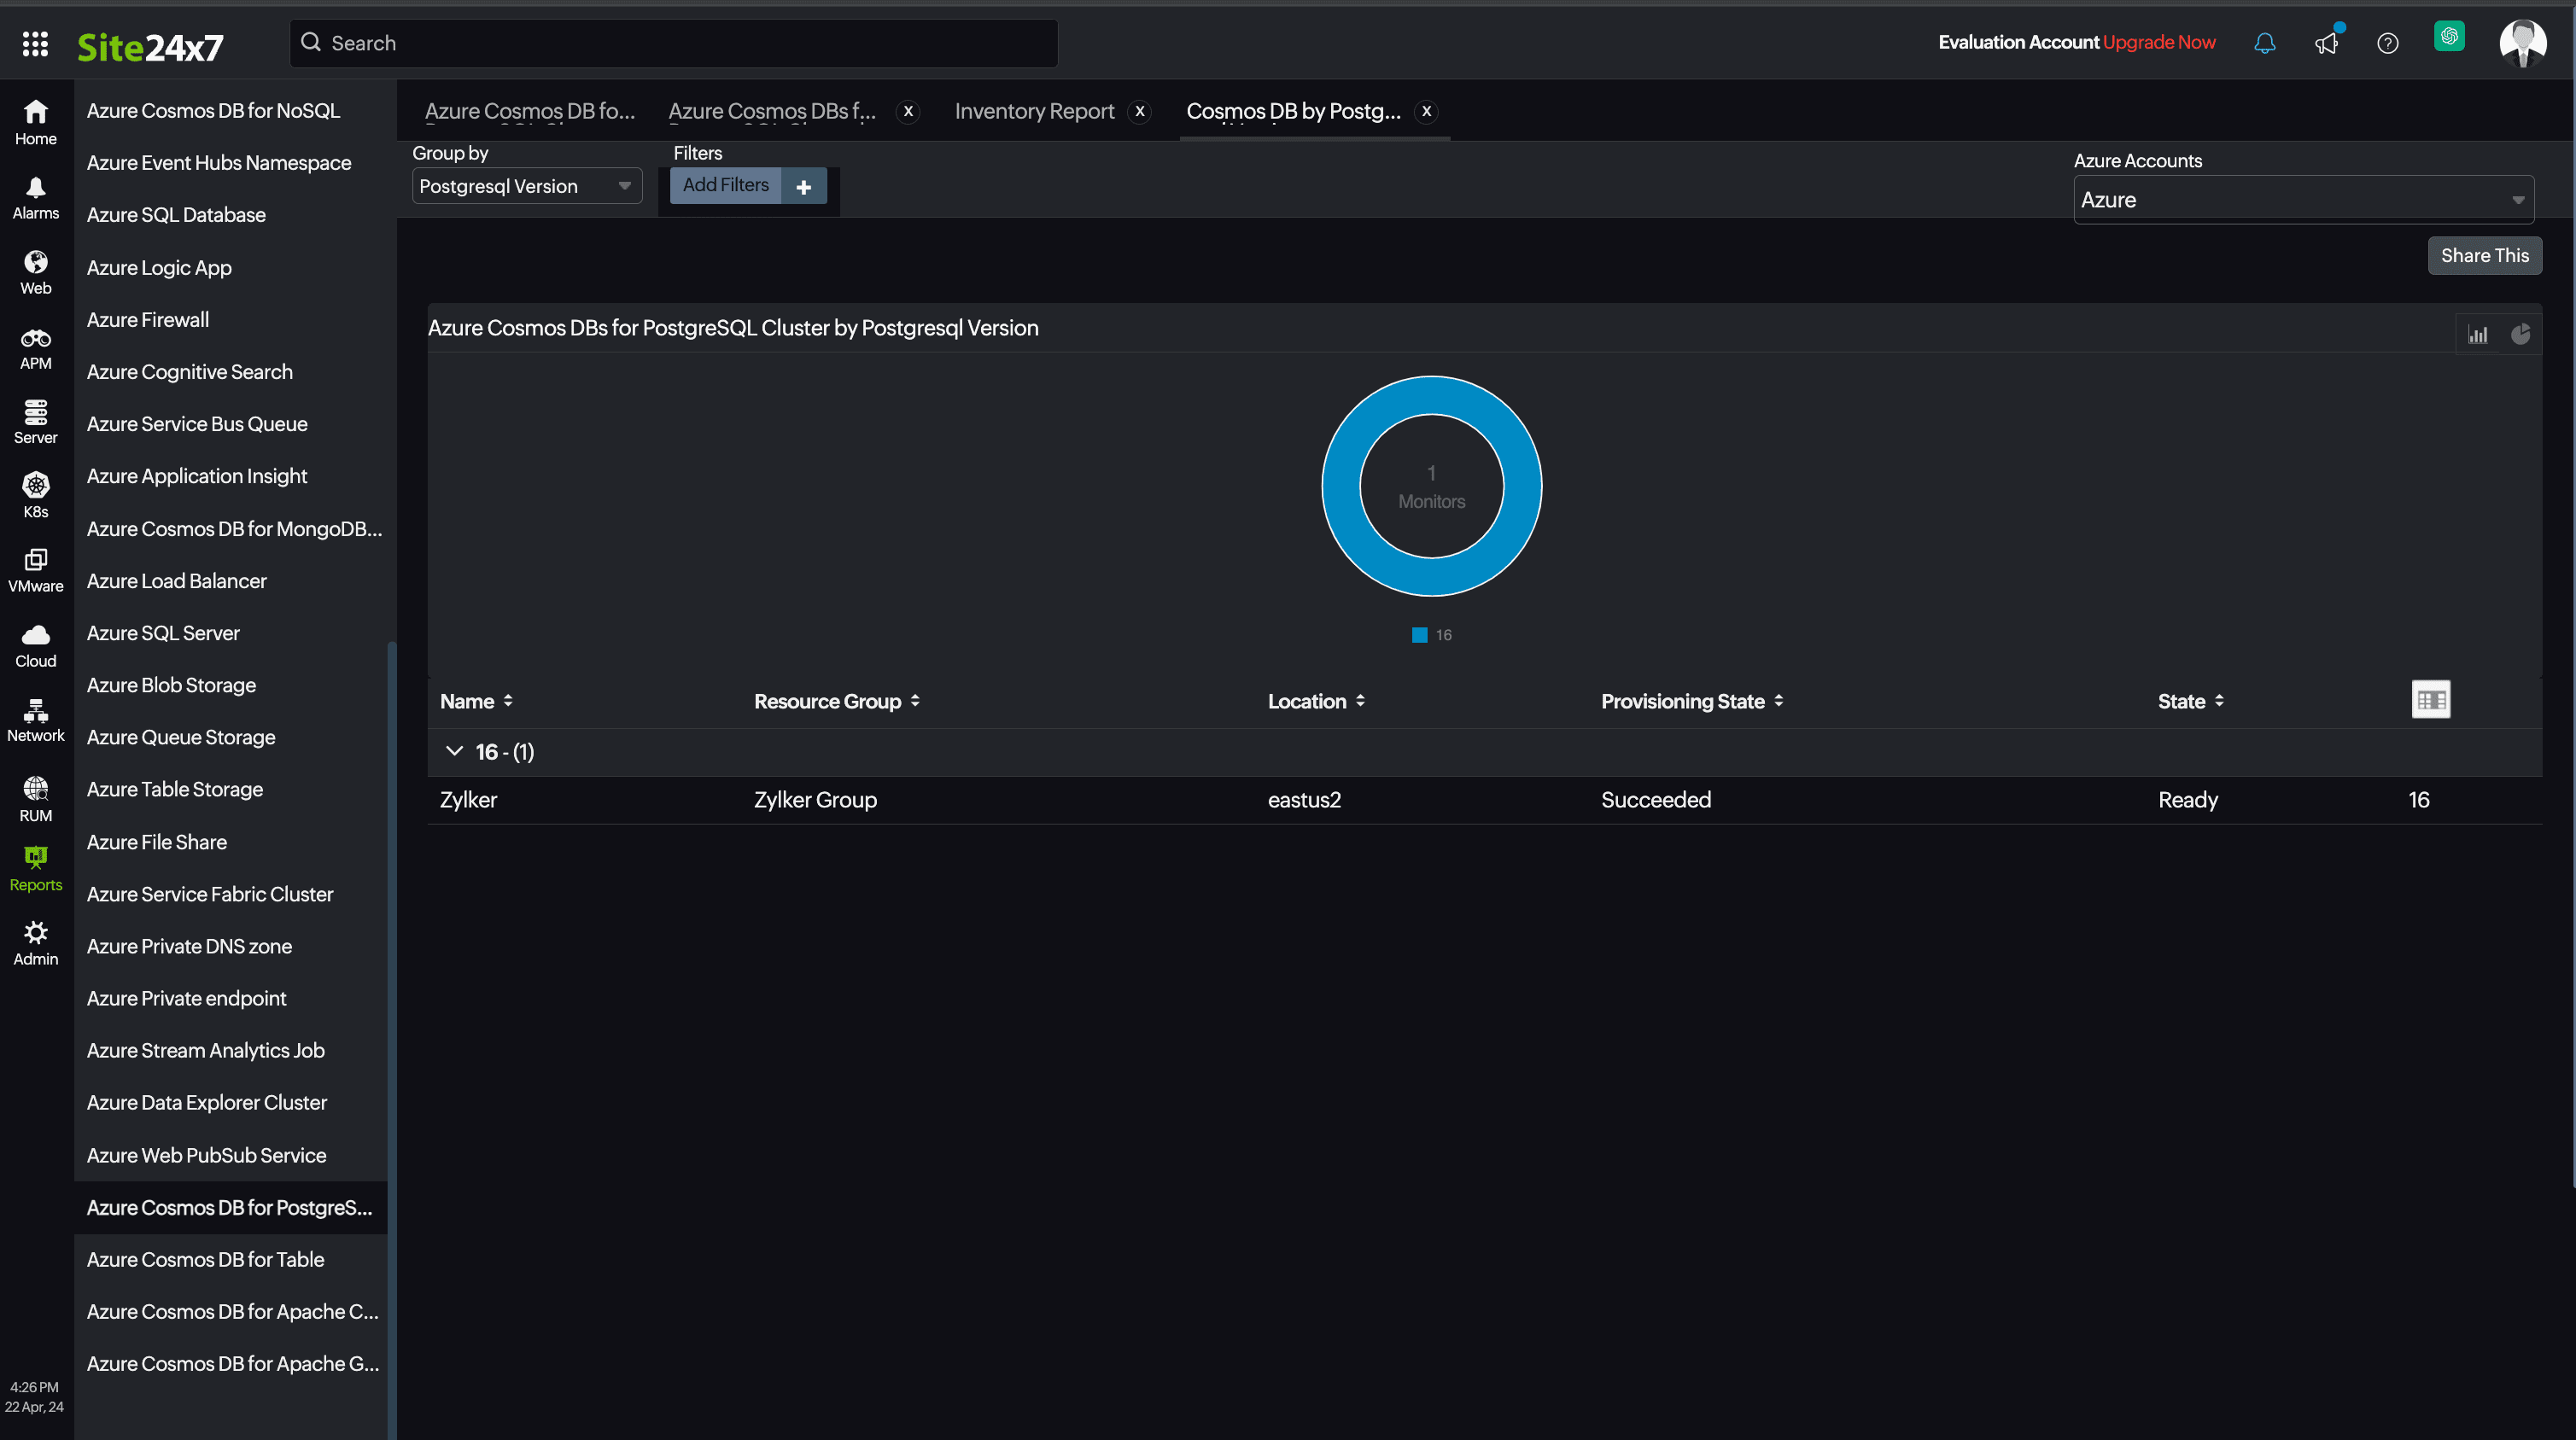
Site24x7 Azure Cosmos DB for PostgreSQL Cluster monitoring also provides CosmosDB by PostgreSQL Version reports that will enable you to gain deeper insight into your resources.

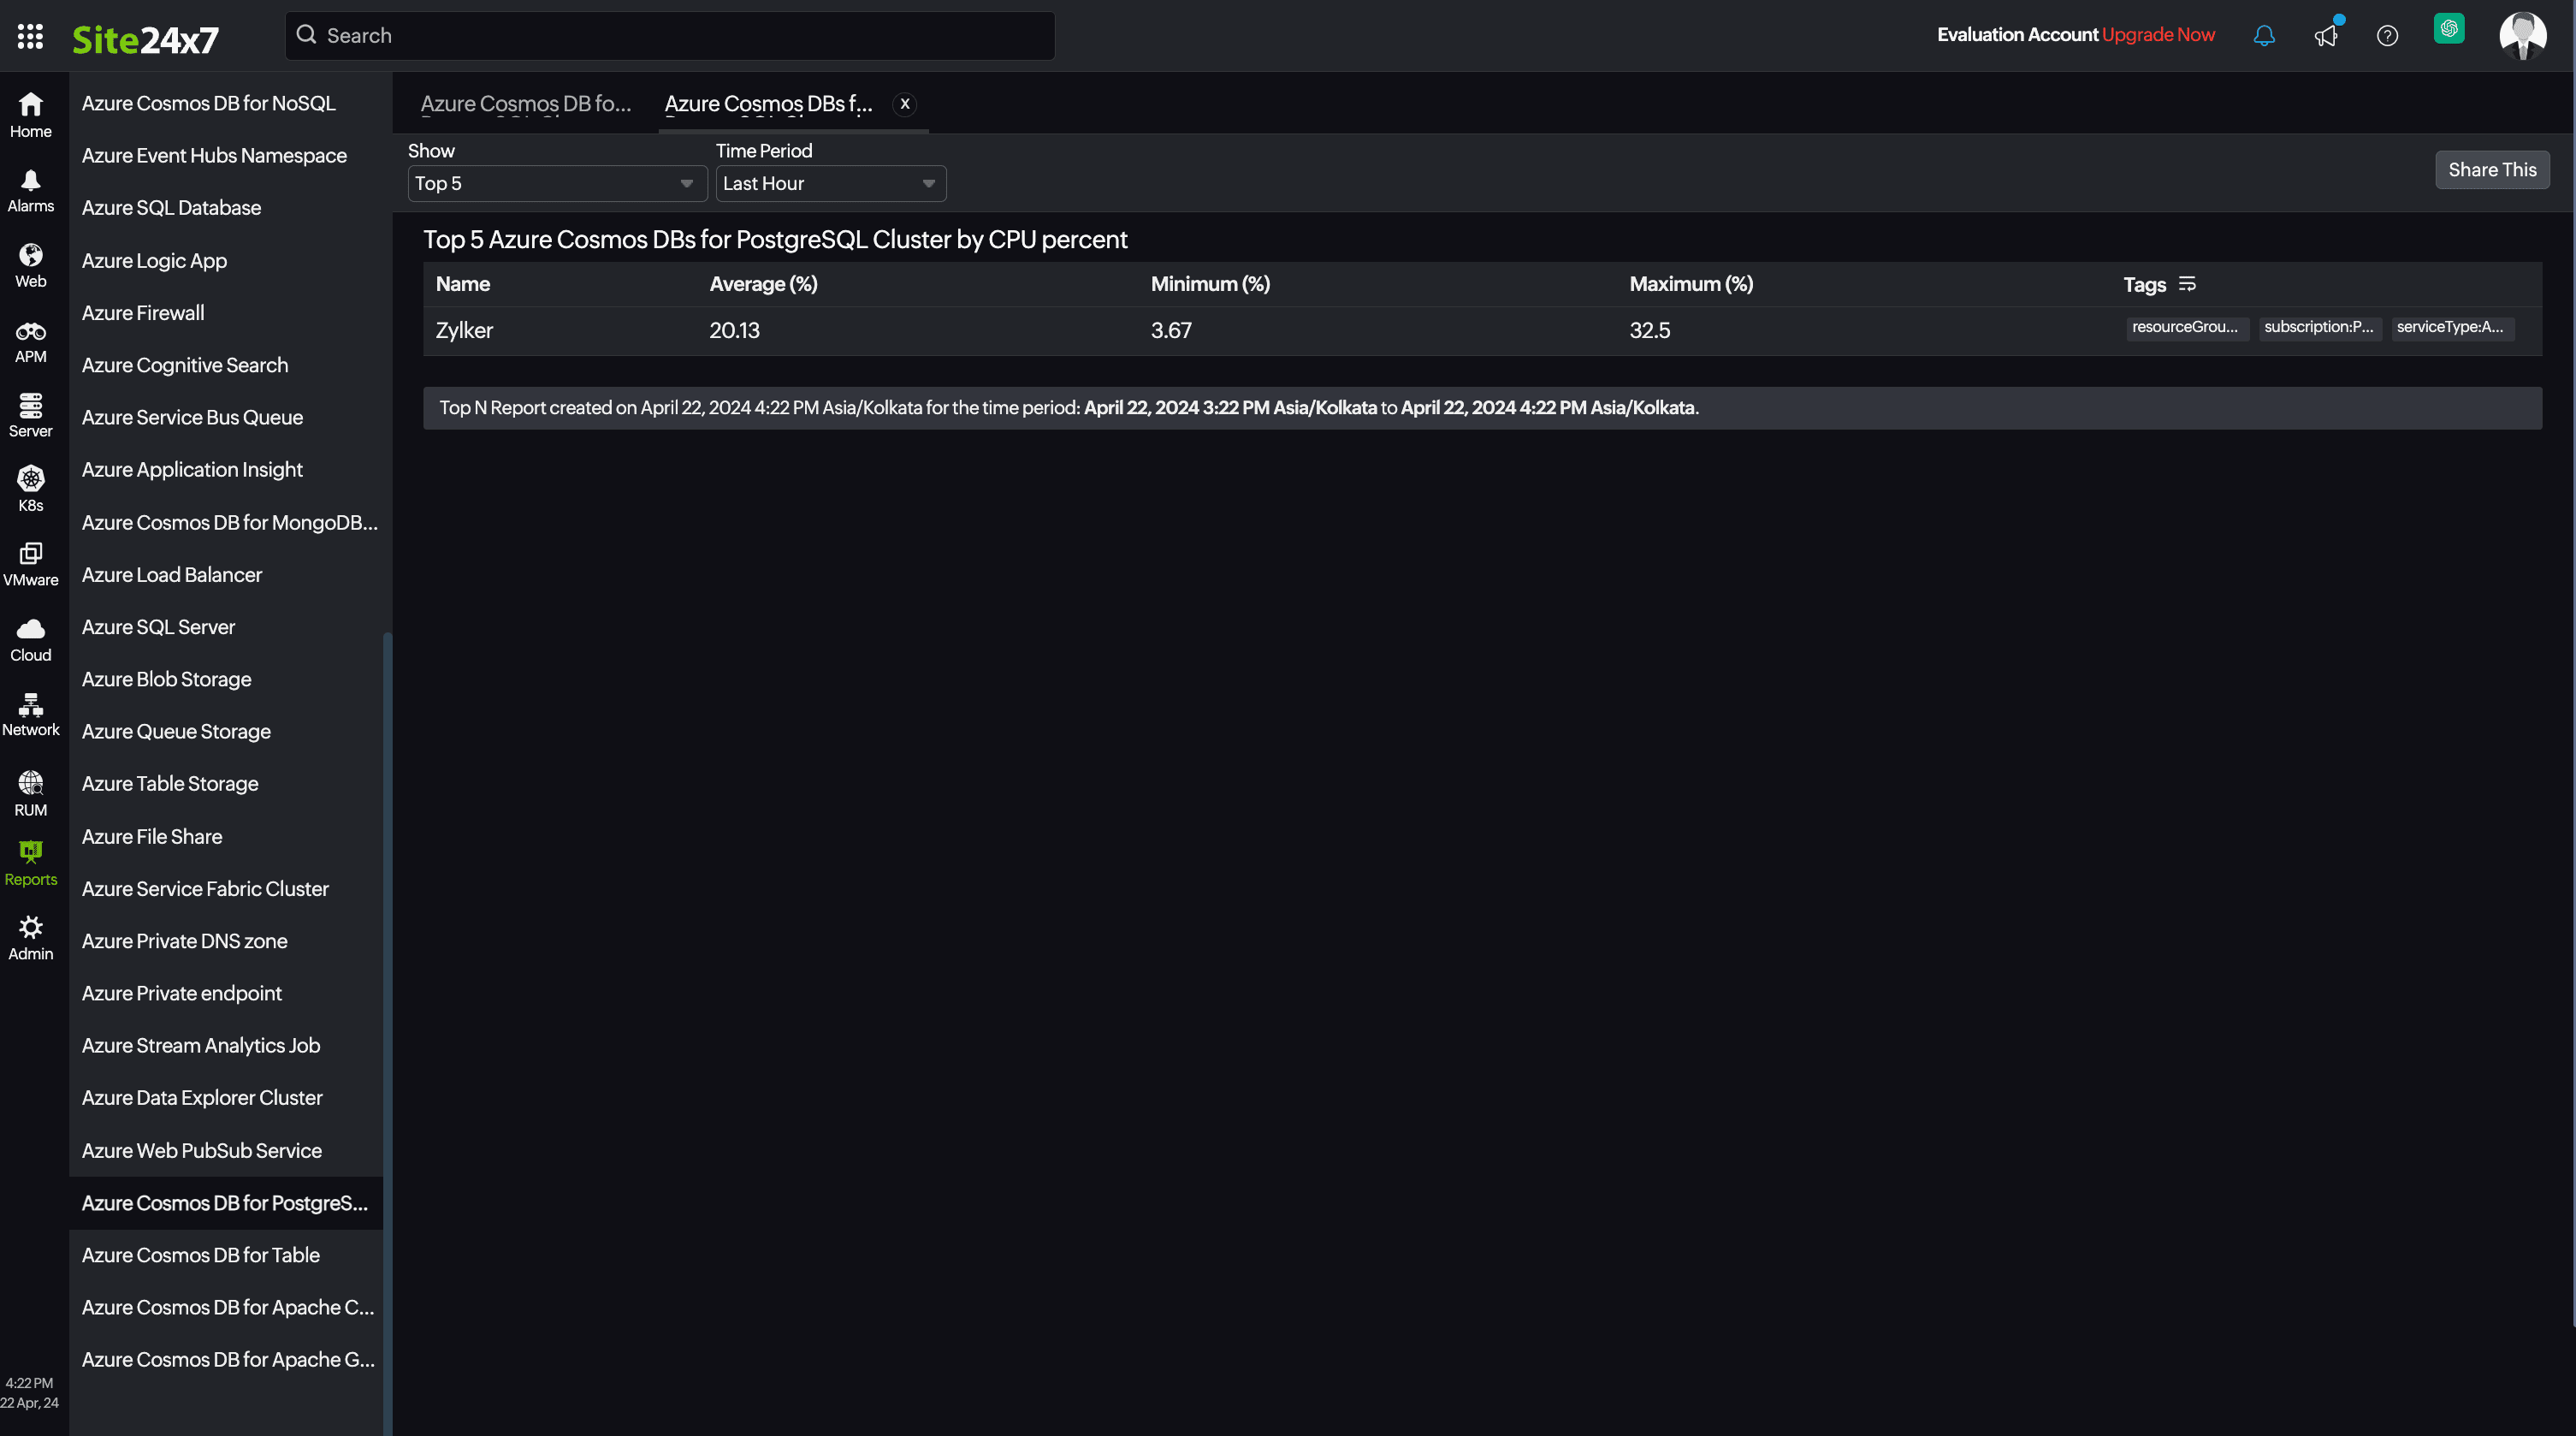
Top N and Bottom N reports
- CPU Percent
- Memory Percent
- Storage Percent
- Active Connections
- CPU Credits Consumed
- CPU Credits Remaining
- Storage Used

You can also view the reports from the Usage tab of the Azure Cosmos DB for PostgreSQL Cluster Monitor.
- Go to the Usage tab of the Azure Cosmos DB for PostgreSQL Cluster Monitor, and get the Availability Summary Report of the monitor by clicking on Availability.
- You can also find the Performance Report of the monitor by clicking on any chart title.
Site24x7's Cosmos DB for PostgreSQL Cluster monitoring interface
Get an overview of the availability and usage status of your Cosmos DB for PostgreSQL Cluster.
Summary:
The Summary tab will help you view the Active Connections, and also the CPU, Memory, Network, IOPS, and Bandwidth related information.
Configuration Details:
This tab provides the configuration details of your Cosmos DB for PostgreSQL Cluster. Details on the Coordinator Server Edition, Coordinator and Node Storage Quota, Geo Backup, PostgreSQL version and many more are included in this section.
Zia Forecast:
By leveraging the AI-driven Zia framework, you can examine resource consumption measurements through the forecast chart located in the Zia Forecast tab. This chart predicts upcoming performance metrics based on a 7-day historical data analysis, providing insights into the expected metric usage for the next seven days.
Outages:
This tab provides the history of the Cosmos DB for PostgreSQL Cluster statuses, including Down, Trouble, and Critical.
Inventory:
This provides the licensing details, the Threshold and Availability Profiles, the Notification Profiles set, the set User Alert Group, and the monitor created time and modified time.
Log Report:
The Log Report tab lists all the logs collected during every data collection, along with their statuses.
Related links:
How to add an Azure monitor
How to integrate an Azure App Service monitor
How to integrate Azure Virtual Machine monitor
How to configure IT Automations for a monitor
How to add a Configuration Rule
