Azure App Configuration monitoring integration
Using Azure App Configuration, you can instantly store and manage the configurations of all your Azure apps in one place. Additionally, it guarantees secure, scalable management of your configurations.
With Site24x7's integration, you can now monitor App Configuration with reliable metrics, define thresholds, and get alerts when there is a breach.
Setup and configuration
- Adding Azure App Configuration while configuring a new Azure monitor
If you have not configured an Azure monitor yet, add one by following the steps below:
- Log in to your Site24x7 account.
- Go to Cloud > Azure > Add Azure Monitor. You can also follow these steps to add an Azure monitor.
- During Azure monitor configuration, on the Edit Azure Monitor page, select Azure App Configuration from the Service/Resource Types drop-down.
- Adding Azure App Configuration to an existing Azure monitor
If you already have an Azure monitor configured for the tenant, you can add Azure App Configuration by following the steps below:
- Log in to your Site24x7 account.
- Go to Cloud > Azure, select your Azure monitor, then go to any of the dashboards on the left pane of your Azure monitor.
- Click the hamburger
 icon and select Edit, which brings you to the Edit Azure Monitor page.
 - On the Edit Azure Monitor page, select the corresponding Subscriptions and Resource Groups from the drop-downs, select Azure App Configuration from the Service/Resource Types drop-down, and click Save.
- After successful configuration, go to Cloud > Azure > Azure Monitor > Azure App Configuration. Now you can view the discovered Azure App Configuration.
It will take 15-30 minutes to discover new Azure resources. For immediate discovery of the selected configuration, go to the Infrastructure Dashboard of the Azure monitor, click the hamburger ![]() icon, and select Discover Now.
icon, and select Discover Now.
Polling frequency
Site24x7's Azure App Configuration monitor collects metric data and the statuses minute-wise from your app's configuration every five minutes.
Supported metrics
| Metric name | Description | Statistic | Unit |
|---|---|---|---|
| HTTP Incoming Request Count | The total number of incoming HTTP requests | Count | Count |
| HTTP Incoming Request Duration | The latency of a HTTP request | Average | Count |
| Throttled HTTP Request Count | The number of throttled HTTP requests | Count | Count |
| Daily Storage Usage | The percentage of storage used daily | Average | Percent |
Threshold configuration
- Global configuration
- In the Site24x7 web client, go to the Admin section on the left navigation pane.
- Select Configuration Profiles from the left pane and select the Threshold and Availability (+) tab from the drop-down.
- Click Add Threshold Profile in the top-right corner of the page.
- For Monitor Type, select Azure App Configuration.
- Now you can set the threshold values for all the metrics mentioned above.
- Monitor-level configuration
- In the Site24x7 web client, go to Cloud > Azure > Azure Monitor > Azure App Configuration.
- Select the resource you would like to set a threshold for, then click the hamburger
 icon.
icon. - Select Edit, which directs you to the Edit Azure App Configuration Monitor page.
- You can set the threshold values for the metrics by selecting Threshold and Availability.
- You can also configure IT Automation at the attribute level.
IT Automation
Site24x7's IT Automation tools help automatically resolve performance degradation issues. The alarm engine continually evaluates system events for which thresholds are set and executes the mapped automation when there is a breach.
How to configure IT Automation for a monitor
Configuration Rules
Configure parameters like Threshold Profile, Notification Profile, Tags, and Monitor Group for multiple monitors with Site24x7's Configuration Rules. You can run a scan and associate any of the previously generated rules that suit the monitor configurations while adding new monitors.
How to add a Configuration Rule
Summary
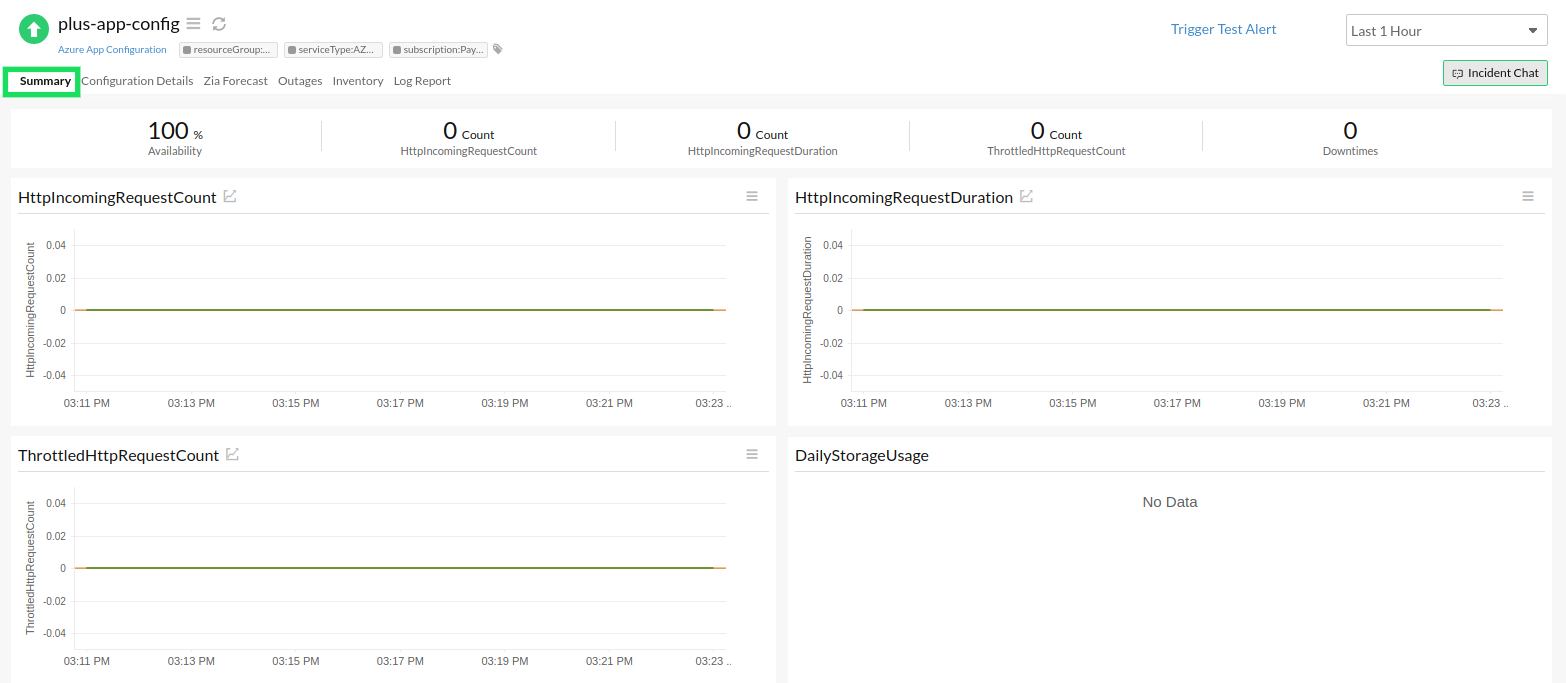
The Summary tab will give you the performance data organized by time for the metrics listed above.
- To view the summary, go to Cloud > Azure > Azure Monitor > Azure App Configuration.
- Select a resource and click the Summary tab.
- By doing so, you can view the above metrics.
Configuration Details
The configuration details of an application instance are provided under the Configuration Details tab.
- To get the configuration details, go to Cloud > Azure > Azure Monitor > Azure App Configuration.
- Select a resource and click the Configuration Details tab.
- Here, you can find Provisioning State, Endpoint, Enable Purge Protection, and more.
Reports
Gain in-depth data about the various parameters of your monitored resources and highlight your service performance using our insightful reports.
To view reports for Azure App Configuration:
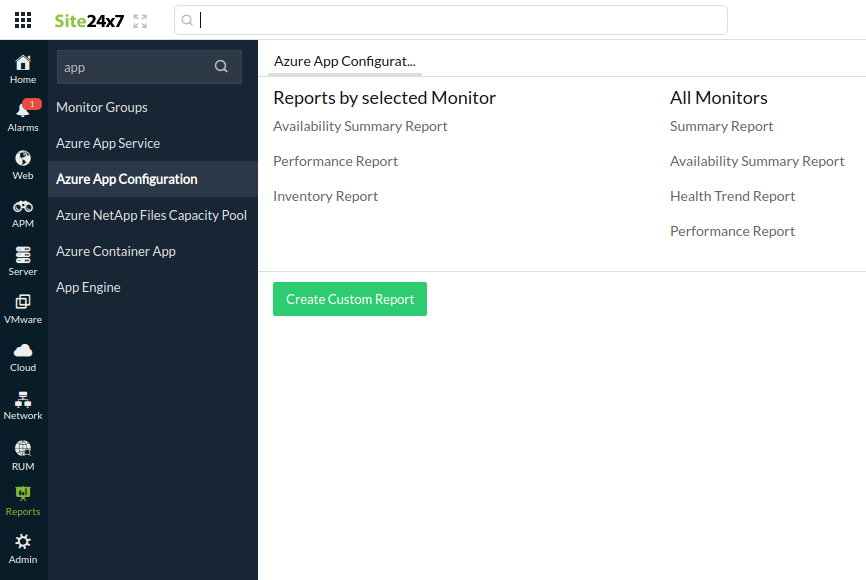
- Go to the Reports section on the left navigation pane.
- Select Azure App Configuration from the menu on the left.
- You can find the Availability Summary Report, Performance Report, and Inventory Report for one selected monitor, or you can get the Summary Report, Availability Summary Report, Health Trend Report, and Performance Report for all the Azure App Configuration monitors.

You can also get reports from the Summary tab of the Azure App Configuration monitor.
- Click the Summary tab of the Azure App Configuration monitor and get the Availability Summary Report of the monitor by clicking Availability or Downtimes.
- You can also find the Performance Report of the monitor by clicking any chart title.

