Amazon RDS Monitoring Integration
Amazon's Relational Database Service (RDS) is a managed web service that lets you deploy and scale SQL data stores in the cloud with ease. With Site24x7's RDS integration you can monitor metrics like CPU utilization, CPU credit usage, burst balance, read/write IOPS, database connections, network throughput and more for each active relational database instance. All RDS engine types are supported.
Setup and configuration
- If you have't done already, enable Site24x7 access to your AWS account (IAM user or IAM role). Learn more.
- In the Integrate AWS Account page, please select the checkbox next to the RDS listing. Learn more.
Policies and permissions
Please make sure the following read level API actions are present in the policy assigned to the Site24x7 IAM entity. Learn more.
- "rds:ListTagsForResource",
- "rds:DescribeDBInstances",
- "rds:DescribeDBLogFiles",
- "rds:DescribeAccountAttributes",
- "rds:DescribeDBClusters",
- "rds:DescribeEvents"
Polling frequency
Site24x7 queries the CloudWatch API as per the poll frequency set (1 minute to a day), to collect performance metrics for your RDS resource. Learn more.
IT Automations
You can add automations for the AWS services supported by Site24x7. Log in to Site24x7 and go to Admin > IT Automation Templates (+) > Add Automation Templates. Once automations are added, you can schedule them to be executed one after the other.
You can start, stop, and reboot with failover the DB instances with Amazon RDS automations.
Supported metrics
Amazon RDS performance metrics
| Attribute | Description | Statistics | Data type |
|---|---|---|---|
| Bin log disk usage | Measures the amount of disk space occupied by binary logs. Applicable only for MySQL read replicas. | Average | Bytes |
| Buffer cache hit ratio | Measures the percentage of requests served by buffer cache. | Average | Percentage |
| Burst balance | Measures the percentage of available GP2 burst-bucket I/O credits. | Average | Percentage |
| CPU utilization | Measures the percentage of CPU used. | Average | Percentage |
| CPU credit usage | Measures the number of credits spent by the DB instance. | Average | Count |
| CPU credit balance | Measures the number of earned CPU credits that have been accrued. | Average | Count |
| CPU surplus credit balance | Measures the number of surplus credits that have been spent. Only applicable for T2 unlimited instance. | Average | Count |
| Database connections | Measures the number of database connections in use. | Average, sum, maximum | Count |
| Database connections real count | Measures the number of active/open connections. | Average | Count |
| CPU surplus credits charged | Measures the number of spent surplus credits that are not paid down by earned CPU credits. Only applicable for T2 unlimited instance. | Average | Count |
| Disk queue depth | Measures the number of outstanding I/O requests (read/write). | Average | Count |
| Freeable memory | Measures the amount of available RAM. | Average | Bytes |
| Free storage space | Measures the amount of available storage space. | Average | Bytes |
| Maximum used transaction IDs | The maximum transaction ID that has been used. Applicable to only PostgreSQL. | Average | Count |
| Network receive throughput | Measures the incoming (Receive) network traffic on the DB instance, includes both customer and Amazon RDS traffic. | Average | MB/sec |
| Network transmit throughput | Measures the outgoing(transmit) network traffic on the DB instance, includes both customer and Amazon RDS traffic. | Average | MB/sec |
| Oldest replication slot lag | Measures the size of the replica lagging the most in terms of WAL data received. | Average | Count |
| Read IOPS | Measures the number of disk I/O operations per second . | Average | Count/sec |
| Read latency | Measures the amount of time taken per disk I/O operation. | Average | Seconds |
| Read throughput | Measures the number of bytes read from disk per second. | Average | Bytes/sec |
| Replica lag | Measures the amount of time a Read Replica DB instance lags behind the source DB instance. | Average | Seconds |
| Swap usage | Measures the amount of swap space used. | Average | Bytes |
| Transaction logs disk usage | Measures the disk space used by transaction logs. Applicable to only PostgreSQL. | Average | MB |
| Transaction logs generation | Measures the size of transaction logs generated per second. Applicable to only PostgreSQL. | Average | Count |
| Write IOPS | Measures the average number of disk I/O operations. | Average | Count/sec |
| Write latency | Measures the average amount of time taken per disk I/O operation. | Average | Seconds |
| Write throughput | Measures the average number of bytes written to disk per second. | Average | Bytes/sec |
| EBS IO balance percentage | The percentage of I/O credits remaining in the burst bucket of your RDS database. | Average | Percentage |
| EBS byte balance percentage | The percentage of throughput credits remaining in the burst bucket of your RDS database. | Average | Percentage |
| Maximum used storage percentage | The percentage of maximum storage used out of the total allocated storage. | Average | Percentage |
| Memory Utilization | The percentage of total memory utilized in the RDS Instance. | Average | Percentage |
Amazon Aurora metrics
| Attribute | Description | Statistics | Data type |
|---|---|---|---|
| Active transactions | Measures the number of current transactions executing on an Aurora database instance. | Sum | Count |
| Aurora Binlog replica lag | Measures the amount of time a replica DB cluster running on Aurora with MySQL lags behind the source DB cluster. | Average | Milliseonds |
| Aurora replica lag | Measures the amount of lag when replicating updates. | Average | Millisecond |
| Aurora replica lag maximum | Measures the maximum amount of lag between the primary instance and each Aurora DB instance. | Average | Milliseconds |
| Aurora replica lag minimum | Measures the minimum amount of lag between the primary instance and each Aurora DB instance. | Average | Milliseconds |
| Blocked transactions | Measures the number of blocked transactions. | Sum | Count |
| Commit latency | Measures the latency for commit operations. | Average | Milliseconds |
| Commit throughput | Measures the number of commit operations per second. | Average | Count per second |
| DDL latency | Measures the latency for data definition language (DDL) requests. | Sum | Milliseconds |
| DDL throughput | Measures the number of DDL requests. | Sum | Count per second |
| Deadlocks | Measures the number of deadlocks in the database. | Sum | Count |
| Delete latency | Measures the of latency for delete queries. | Average | Milliseconds |
| Delete throughput | Measures the number of delete queries per second. | Average | Count per second |
| DML latency | Measures the amount of latency for inserts, updates, and deletes. | Average | Milliseconds |
| DML throughput | Measures the average number of inserts, updates, and deletes. | Average | Count per second |
| Engine uptime | Measures the amount of time that the instance has been running. | Average | Seconds |
| Free local storage | Measures the amount of storage available for temporary tables and logs. | Average | MB |
| Insert latency | Measures the amount of latency for insert queries. | Average | Milliseconds |
| Insert throughput | Measures the average number of insert queries. | Average | Count per second |
| Login failures | Measures the number of failed login attempts. | Sum | Count |
| Network throughput | Measures the amount of bytes both received from and transmitted to clients by each instance. | Average | Count per second |
| Queries | Measures the number of queries executed. | Average | Count per second |
| Result set cache hit ratio | Measures the number of requests that are served by the Resultset cache. | Average | Percentage |
| Select latency | Measures the amount of latency for select queries. | Average | Milliseconds |
| Select throughput | Measures the average number of select queries. | Average | Count per second |
| Update latency | Measures the amount of latency for update queries. | Average | Milliseconds |
| Update throughput | Measures the average number of update queries. | Average | Count per second |
| Volume bytes used | Measures the amount of storage used by your Aurora DB instance. | Average | MB |
| Volume read IOPs | Measures the number of billed read I/O operations from a cluster volume. | Sum | Count |
| Volume write IOPs | Measures the number of billed write I/O operations to a cluster volume. | Sum | Count |
| Serverless database capacity | Measures the Serverless Aurora database instance capacity. | Average | Count |
| Total backup storage billed | The total amount of billed backup storage. | Maximum | GB, Bytes |
| Snapshot storage used | Measures the amount of billed backup storage consumed snapshots. | Maximum | GB, Bytes |
| Backup retention period storage used | Measures the amount of billed backup storage used to support the point-in-time restore feature within backup retention window. | Maximum | GB, Bytes |
| Backtrack change records creation rate | Measures the number of backtrack change records created over time. | Average | Count |
| Backtrack change records stored | Measures the actual number of backtrack change records. | Average | Count |
| Backtrack window actual | Measures the difference between the target backtrack window and the actual backtrack window. | Average | Minutes |
| Backtrack window alert | Measures the number of times that the actual backtrack window is smaller than the target backtrack window. | Average | Count |
| Rollback segment history list length | The undo logs that record committed transactions with delete-marked records. These records are scheduled to be processed by the InnoDB purge operation. | Maximum | Count |
| Row lock time | The total time spent acquiring row locks for InnoDB tables. | Average | Milliseconds |
| Aurora DML Rejected Writer Full | The number of data manipulation language (DML) requests that were rejected because the writer instance was full. | Average | Count |
| Aurora Estimated Shared Memory Bytes | The estimated amount of shared memory in bytes used by the Aurora database instance. | Average | Bytes |
| Aurora Slow Connection Handle Count | The number of slow connection handles, which are connections that took a long time to be established. | Average | Count |
| Aurora Slow Handshake Count | The number of slow handshakes, which are initial connection attempts that took a long time to complete. | Average | Count |
| Aurora Volume Bytes Left Total | The total number of bytes left on the volume for storage. | Average | Bytes |
| Connection Attempts | The number of attempts to establish a connection to the Aurora database instance. | Average | Count |
| NumBinary Log Files | The number of binary log files currently in use by the Aurora database instance. | Average | Count |
| Storage Network Receive Throughput | The network throughput for data received by the storage layer. | Average | Bytes/Second |
| Storage Network Throughput | The overall network throughput of the storage layer. | Average | Bytes/Second |
| Storage Network Transmit Throughput | The network throughput for data transmitted by the storage layer. | Average | Bytes/Second |
| SumBinary Log Size | The total size of all binary log files currently in use. | Average | Bytes |
| Total IOPS | The total number of input/output operations per second (IOPS) for the Aurora database instance. | Average | Count |
| Aborted Clients | The number of aborted client connections to the Aurora database instance. | Average | Count |
| ACU Utilization | The utilization of Aurora capacity units (ACUs), which represent the amount of computational and memory resources used. | Average | Percentage |
| Temp Storage IOPS | The number of IOPS for temporary storage used by the Aurora database instance. | Average | Count |
| Temp Storage Throughput | The throughput for temporary storage used by the Aurora database instance. | Average | Bytes/Second |
Amazon Aurora Parallel Query metrics
| Attribute | Description | Statistics | Data type |
|---|---|---|---|
| Aurora Pq Request Attempted | The total number of attempts made to execute Aurora Parallel Query (PQ) requests. | Average | Count |
| Aurora Pq Request Failed | The total number of Aurora PQ requests that failed to execute successfully. | Average | Count |
| Aurora Pq Request In Progress | The current count of Aurora PQ requests that are actively being processed or are awaiting completion. | Average | Count |
| Aurora Pq Request Executed | The total number of Aurora PQ requests that have been successfully executed. | Average | Count |
| Aurora Pq Request Not Chosen | The number of Aurora PQ requests that were not selected for execution due to various reasons such as query complexity or system constraints. | Average | Count |
| Aurora Pq Request Not Chosen Below Min Rows | The count of Aurora PQ requests not chosen because they involve rows below a specified minimum threshold. | Average | Count |
| Aurora Pq Request Not Chosen Column Bit | The Aurora PQ requests not chosen due to columns with the BIT data type. | Average | Count |
| Aurora Pq Request Not Chosen Column Geometry | The Aurora PQ requests not chosen due to columns with the GEOMETRY data type. | Average | Count |
| Aurora Pq Request Not Chosen Column Lob | The Aurora PQ requests not chosen because they involve Large Object (LOB) columns. | Average | Count |
| Aurora Pq Request Not Chosen Column Virtual | The Aurora PQ requests not chosen due to columns with virtual attributes. | Average | Count |
| Aurora Pq Request Not Chosen Few Pages Outside Buffer Pool | The Aurora PQ requests not chosen because they access only a few pages outside the buffer pool. | Average | Count |
| Aurora Pq Request Not Chosen Full Text Index | The Aurora PQ requests not chosen due to their reliance on full text indexes. | Average | Count |
| Aurora Pq Request Not Chosen High Buffer Pool Pct | The Aurora PQ requests not chosen because they involve a high percentage of the buffer pool. | Average | Count |
| Aurora Pq Request Not Chosen Index Hint | The Aurora PQ requests not chosen due to the use of index hints. | Average | Count |
| Aurora Pq Request Not Chosen Innodb Table Format | The Aurora PQ requests not chosen due to InnoDB table format constraints. | Average | Count |
| Aurora Pq Request Not Chosen Instant Ddl | TheAurora PQ requests not chosen due to instant data definition language (DDL) operations. | Average | Count |
| Aurora Pq Request Not Chosen Long Trx | The Aurora PQ requests not chosen due to long running transactions. | Average | Count |
| Aurora Pq Request Not Chosen NoWhere Clause | The Aurora PQ requests not chosen due to the absence of a WHERE clause. | Average | Count |
| AuroraPq RequestNotChosenRangeScan | The Aurora PQ requests not chosen due to range scan constraints. | Average | Count |
| Aurora Pq Request Not Chosen Row Length Too Long | The Aurora PQ requests not chosen due to row length exceeding system defined limits. | Average | Count |
| Aurora Pq Request Not Chosen Small Table | The Aurora PQ requests not chosen because they involve small tables. | Average | Count |
| Aurora Pq Request Not Chosen Temporary Table | The Aurora PQ requests not chosen due to the use of temporary tables. | Average | Count |
| Aurora Pq Request Not Chosen Tx Isolation | The Aurora PQ requests not chosen due to transaction isolation level constraints. | Average | Count |
| Aurora Pq Request Not Chosen Unsupported Access | The Aurora PQ requests not chosen due to unsupported access methods. | Average | Count |
| Aurora Pq Request Not Chosen Unsupported Storage Type | The Aurora PQ requests not chosen due to unsupported storage types. | Average | Count |
| Aurora Pq Request Not Chosen Update Delete Stmts | The Aurora PQ requests not chosen due to the use of update or delete statements. | Average | Count |
| Aurora Pq Request Throttled Supported Amazon Aurora Forwarding Replica metrics | The Aurora PQ requests that were throttled due to system resource limitations or configured limits. | Average | Count |
Amazon Aurora Forwarding Replica metrics
| Attribute | Description | Statistics | Data type |
|---|---|---|---|
| Forwarding Replica DML Latency | The latency (response time) for data manipulation language (DML) operations (e.g., INSERT, UPDATE, DELETE) on forwarding replicas in Aurora. | Average | Milliseconds (ms) |
| Forwarding Replica DML Throughput | The rate of data manipulation language (DML) operations (e.g., INSERT, UPDATE, DELETE) processed by forwarding replicas in Aurora. | Average | Milliseconds (ms) |
| Forwarding Replica Open Sessions | The current count of open sessions (connections) to forwarding replicas in Aurora. | Average | Count |
| Forwarding Replica Read Wait Latency | The latency (response time) for read operations that are waiting for data from forwarding replicas in Aurora. | Average | Milliseconds (ms) |
| Forwarding Replica Read Wait Throughput | The rate of read operations that are waiting for data from forwarding replicas in Aurora. | Average | Count/second |
| Forwarding Replica Select Latency | The latency (response time) for SELECT queries executed on forwarding replicas in Aurora. | Average | Milliseconds (ms) |
| Forwarding Replica Select Throughput | The rate of SELECT queries executed on forwarding replicas in Aurora. | Average | Count/second |
| Forwarding Writer DML Latency | The latency (response time) for data manipulation language (DML) operations (e.g., INSERT, UPDATE, DELETE) on the forwarding writer node in Aurora. | Average | Milliseconds (ms) |
| Forwarding Writer DML Throughput | The rate of data manipulation language (DML) operations (e.g., INSERT, UPDATE, DELETE) processed by the forwarding writer node in Aurora. | Average | Count/second |
| Forwarding Writer Open Sessions |
The current number of active database connections (sessions) that are open on the forwarding writer instance. The forwarding writer handles write operations and forwards them to the primary instance, helping to offload some of the write load. |
Average | Count |
Configuration details
| Attribute | Description |
|---|---|
| Instance identifier | Shows the unique identifier of the DB instance. |
| Instance class | Shows the RDS DB instance class. |
| vCPUs | Displays the number of virtual cores for the DB instance type. |
| Memory | Displays the memory capacity of the RDS instance type. |
| Allocated storage space | Displays the allocated storage capacity for your instance type. |
| Creation time | Shows the time when the DB instance was created. |
| Engine name | Shows the name of the DB engine. |
| Engine version | Shows the default version of the specified Db engine. |
| Master username | Shows the RDS database master username. |
| Database name | Shows the name of the default database. |
| Region | The region where the DB instance is deployed. |
| Availability zone | The Availability zone where the replicas are deployed. |
| VPC ID | The ID of the Virtual Private Cloud where the DB instance is deployed. |
| Security groups | Displays the name of the security groups assigned to the DB instance. |
| Endpoint address | Shows the connection endpoint for the database. |
| Endpoint port | Shows the port number on which the database accepts connections. |
| Multiple deployment | Shows whether the DB instacne is part of a multi AZ deployment or not. |
| Preferred back up window | Displays the prefered back up windows configured during DB instance creation. |
| Latest restorable time | Shows the latest restorable time of the DB instance. |
| Back up retention period | Displays the backup retention period for the DB instance. |
| Preferred maintenance window | Displays the prefered maintenance window for the DB cluster. |
See how you can configure a threshold profile for your monitored RDS instances.
Forecast
Estimate future values of the following performance metrics and make informed decisions about adding capacity or scaling your AWS infrastructure.
- CPU Utilization
- Free Storage Space
- Freeable Memory
- Swap Usage
- Bin Log Disk Usage
- Burst Balance
- Disk Queue Depth
- Transaction Logs Disk Usage
- CPU Credit Usage
- CPU Credit Balance
- CPU Surplus Usage
- CPU Surplus Balance
- Aurora Bin Log
- Free Local Storage
- Volume Read IOPs
- Volume Write IOPs
- Memory Utilization
Monitor data
You can view your Amazon RDS monitor data on the following tabs:
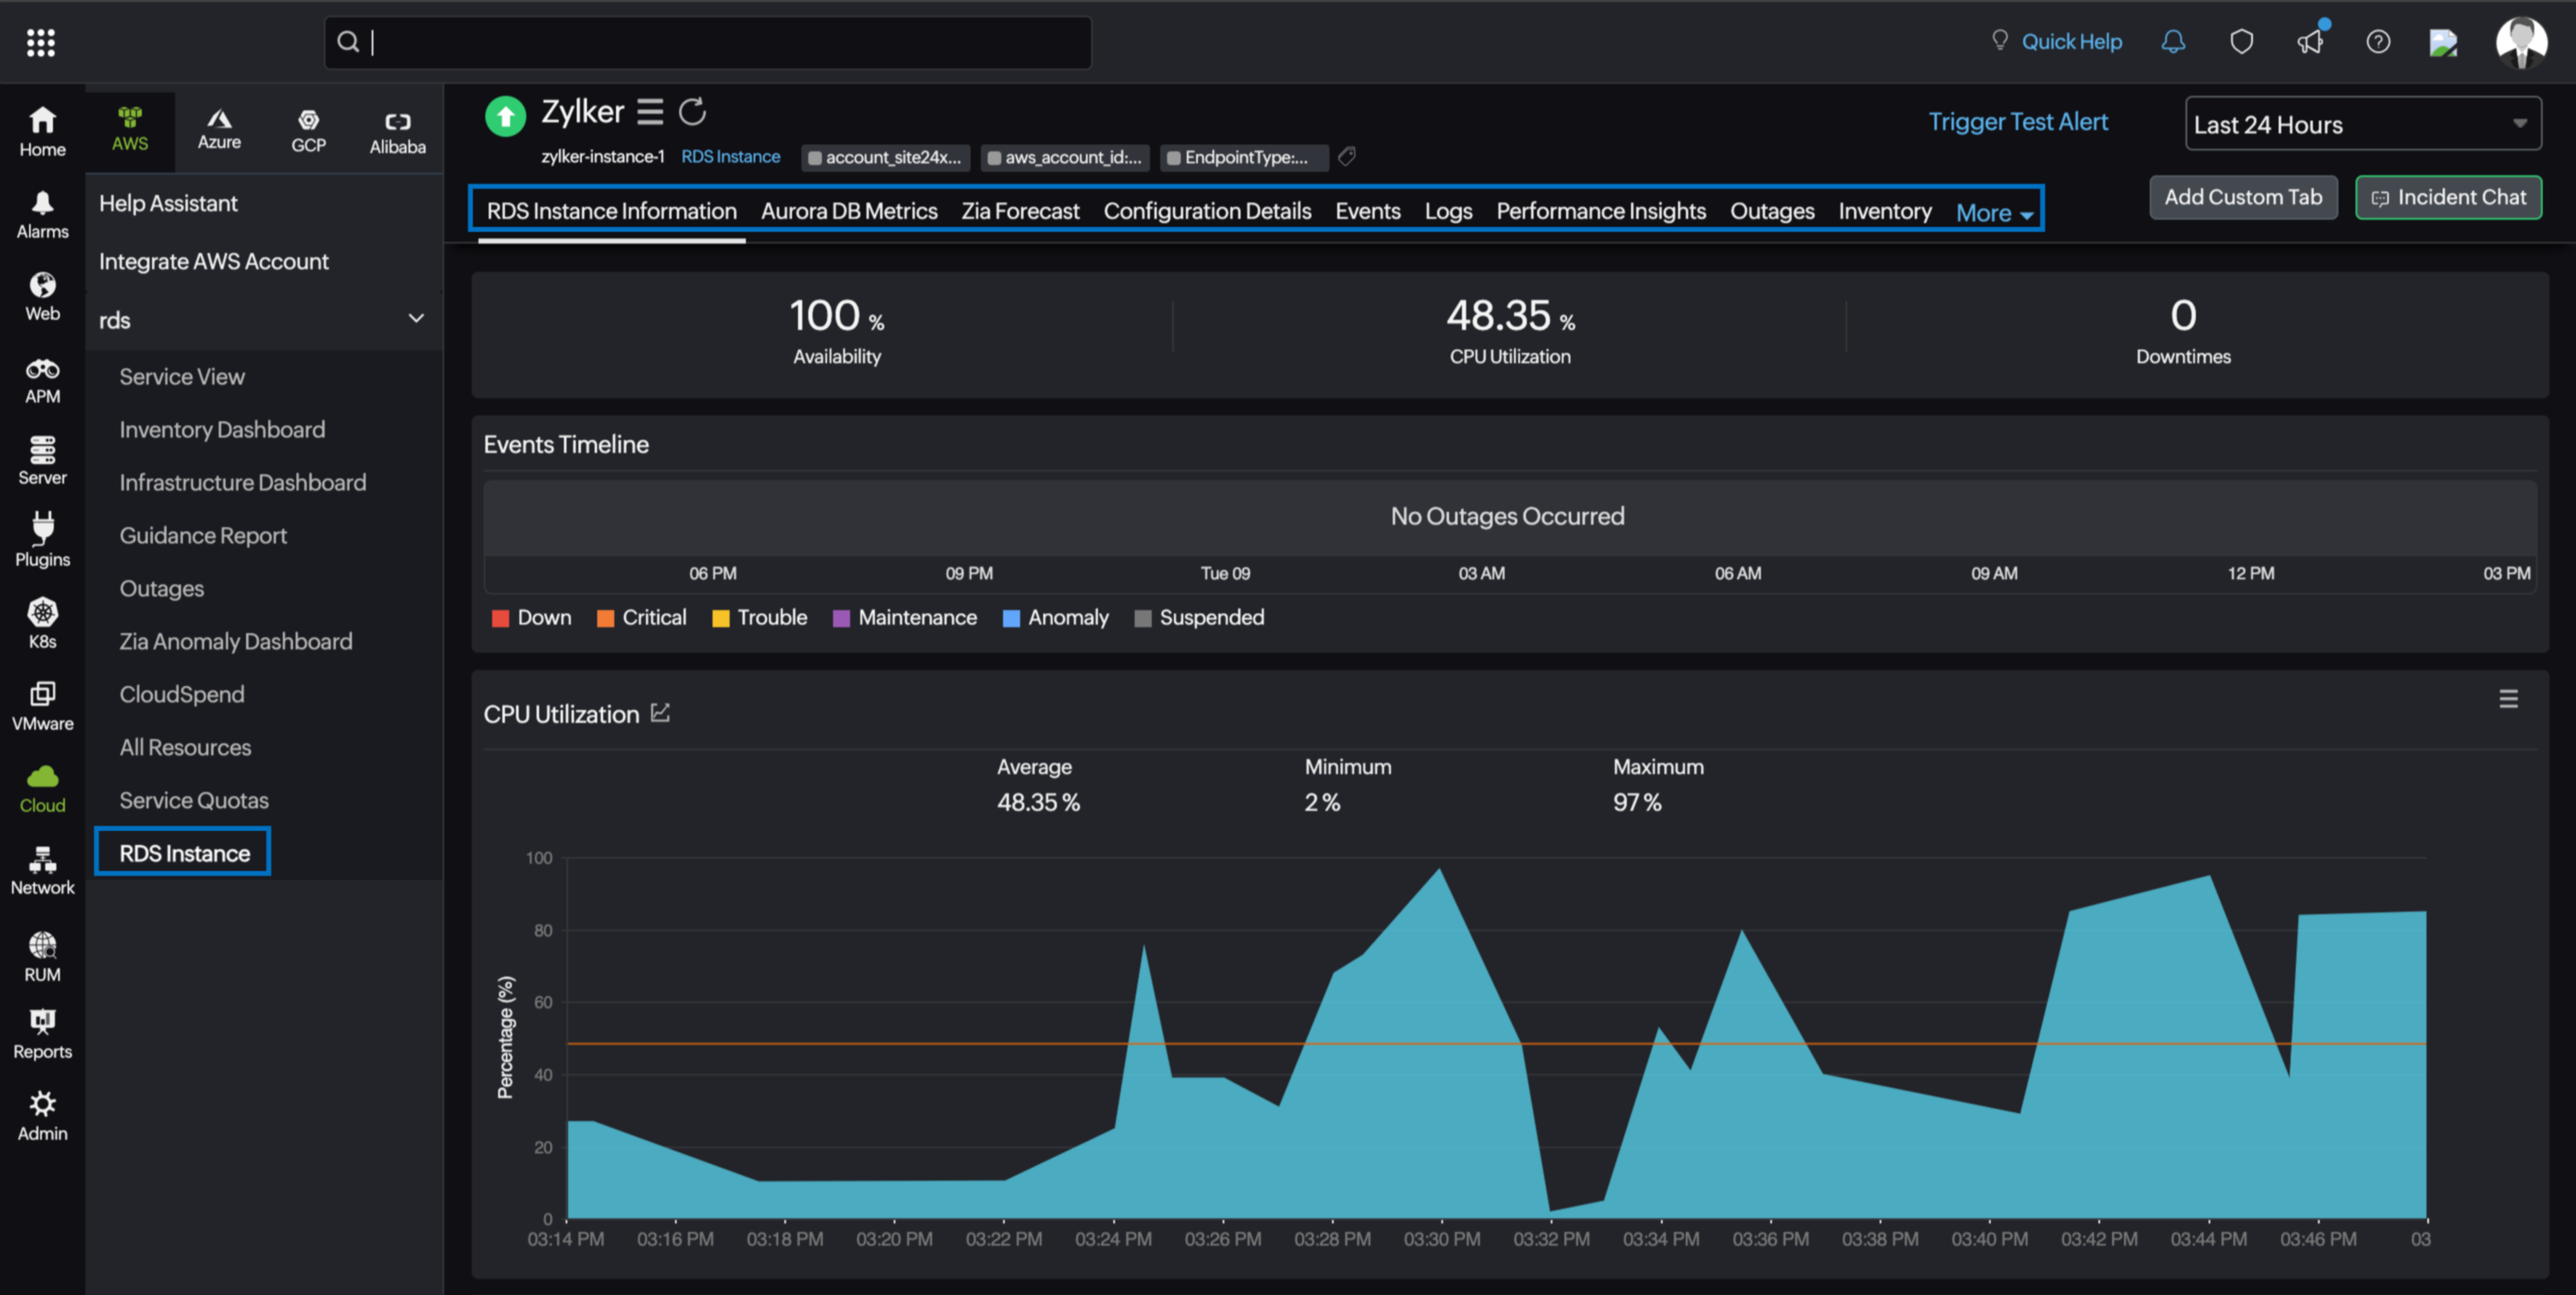
RDS Instance Information
The RDS Instance Information tab provides an overview of the Events Timeline and metrics in the form of charts.
Aurora DB metrics
View real-time performance metrics for Amazon RDS Aurora, such as Aurora Parallel Query Request, Forwarding Writer Performance, and Aurora capacity unit (ACU) metrics.
Configuration Details
The Configuration Details tab provides key details of your RDS instance, such as instance identifier, region, instance class, and creation time.
Events
The Events tab shows significant activities and changes for your RDS instances, such as backups, maintenance, and state changes.
Logs
The Logs tab displays error logs for monitoring and troubleshooting AWS RDS instances.
Performance Insights
The Performance Insights tab provides detailed performance metrics for Amazon RDS, including overall database load (DBLOAD), CPU-related load (DBLOADCPU), and non-CPU-related load (DBLOADNONCPU).
Outages
The Outages tab provides details on an outage's start time, end time, duration, and comments (if any).
Inventory
Obtain details like the Resource Name, Region, and Monitor Licensing Category on the Inventory tab. The Threshold and Availability Profile and the Notification Profile can be set according to the user and viewed on this tab.
Log Report
This tab provides a consolidated report of each RDS monitor's log status, which can be downloaded as a CSV file.