Amazon MSK monitoring
Amazon Managed Streaming for Apache Kafka (MSK) enables you to build and run applications that use Apache Kafka to process streaming data. Amazon MSK automates tasks such as hardware provisioning, software installation, cluster configuration, scaling, and monitoring, making it easier for developers and administrators to focus on building and managing their data streaming applications.
Overview
Integrating Amazon MSK with Site24x7 offers several benefits for managing and monitoring your Kafka infrastructure. Site24x7 provides real-time monitoring capabilities, allowing you to track the performance and health of your Amazon MSK Cluster, Serverless, Replicator, Connect, Broker, and Topic data continuously.
The integration also provides you with the following six monitors so that you can effectively monitor your Kafka environment:
- MSK Cluster: Monitors the broker instances and topics within your cluster.
- MSK Serverless: Gain real-time visibility into your MSK Topics.
- MSK Replicator: Ensures timely data replication between Kafka clusters by tracking metrics like replication latency, message lag, throughput, and failure count, enabling proactive optimization for seamless data synchronization and reliability.
- MSK Connect: Monitors the Kafka Connector performance and provides insights into critical metrics for proactive issue resolution and seamless data integration.
- MSK Broker: Monitors your broker instances and provides insights about metrics such as resource utilization, network connectivity, and disk usage.
- MSK Topic: Gain detailed insights into data ingestion rates, message throughput, and other metrics at each topic level.
Use case
Imagine managing an MSK cluster with numerous brokers and topics. Monitoring the health and performance of individual MSK brokers and MSK topics is crucial for minimizing the risk of service interruptions or downtime. However, this becomes particularly challenging when dealing with multiple brokers distributed across the cluster while monitoring each MSK broker and topic individually.
By integrating Amazon MSK with Site24x7, you can enhance your monitoring capabilities and gain valuable insights into crucial metrics and data at both the broker and topic levels. This integration facilitates a comprehensive understanding of the health and performance of each MSK broker instance, along with providing insights into the data ingestion rates and throughput of MSK topics. You can also identify which MSK broker instances are underutilized or overutilized, enabling you to take appropriate action to maintain high availability and reliability of your MSK clusters.
Benefits of the Site24x7-Amazon MSK integration
On integrating your Amazon MSK with Site24x7
- Obtain comprehensive monitoring of your Kafka environments and optimize your infrastructure performance and reliability.
- Gain insights about your monitor clusters, topics, brokers, connectors, replicators, and serverless components.
- Ensure replicator synchronization for consistent data replication across clusters.
- Achieve critical visibility into the data flow of all your topics and identify performance trends.
- Monitor every Kafka broker in your cluster individually, and proactively get notified in case of abnormal behavior.
Setup and configuration
- Log in to your Site24x7 account and create Site24x7 as an IAM user, or create a cross-account IAM role to enable access to your AWS resources for Site24x7.
- On the Integrate AWS Account page, select MSK from the Services to be discovered list.
Permissions
- kafka:ListClustersV2
- kafka:DescribeClusterV2
- kafka:ListNodes
- kafka:ListReplicators
- kafka:DescribeReplicator
- kafkaconnect:ListConnector
- kafkaconnect:DescribeConnector
- kafkaconnect:DescribeCustomPlugin
- kafkaconnect:DescribeWorkerConfiguration
Polling frequency
Site24x7 queries AWS service-level APIs per the set polling frequency (from once a minute to once a day) to collect metrics from the Amazon MSK monitor.
Supported metrics
The supported metrics for each MSK monitors are given below.
MSK Cluster
The supported metrics for MSK Cluster monitor are provided below:
| Metric name | Description | Statistics | Unit |
|---|---|---|---|
| Kafka DataLogs Disk Used | The disk space used for datalogs in percentage. | Maximum | Percentage |
| Active Controller Count | The number of controllers active at a given time. | Minimum | Count |
| Offline Partitions Count | The number of offline partitions. | Maximum | Count |
| Client Connection Count | The number of clients which are actively connected. | Maximum | Count |
| Zookeeper Request Latency Ms Mean | The mean latency for Apache ZooKeeper requests. | Average | Milliseconds |
| Global Partition Count | The total number of partitions in a cluster excluding the replicas. | Maximum | Count |
| Global Topic Count | The total number of topics in a cluster. | Maximum | Count |
| Number of Brokers in Up state | The number of Brokers in up status. | Sum | Count |
| Number of Brokers in Trouble state | The number of Brokers in trouble status. | Sum | Count |
| Number of Brokers in Critical state | The number of Brokers in critical status. | Sum | Count |
| Number of Brokers in Down state | The number of Brokers in down status. | Sum | Count |
| Number of Topics in Up state | The number of Topics in up status. | Sum | Count |
| Number of Topics in Down state | The number of Topics in down status. | Sum | Count |
| Number of Topics in Trouble state | The number of Topics in trouble status. | Sum | Count |
| Number of Topics in Critical state | The number of Topics in critical status. | Sum | Count |
MSK Serverless
The supported metrics for MSK Serverless monitor are provided below:
| Metric name | Description | Statistics | Unit |
| Number of Topics in Up state | The total number of Topics monitors in Up status. | Sum | Count |
| Number of Topics in Down state | The total number of Topics monitors in Down status. | Sum | Count |
| Number of Topics in Trouble state | The total number of Topics monitors in Trouble status. | Sum | Count |
| Number of Topics in Critical state | The total number of Topics monitors in Critical status. | Sum | Count |
MSK Replicator
The supported metrics for MSK Replicator monitor are provided below:
| Metric name | Description | Statistics | Unit |
|---|---|---|---|
| Replication Latency | The duration between record produce time at source and replicated to target. | Maximum | Milliseconds |
| Message Lag | Indicates the number of messages the replicator is behind the source cluster. | Maximum | Count |
| Replicator Throughput | The average number of bytes replicated per second. | Average | Bytes |
| Replicator Failure | The number of failures that the replicator is experiencing. | Sum | Count |
MSK Connect
The supported metrics for MSK Connect monitor are provided below:
| Metric name | Description | Statistics | Unit |
|---|---|---|---|
| Bytes In Per Sec | The total number of bytes received by the connector. | Average | Bytes |
| Bytes Out Per Sec | The total number of bytes delivered by the connector. | Average | Bytes |
| CPU Utilization | The percentage of CPU consumption by system and user. | Average | Percentage |
| Errored Task Count | The number of tasks that have errored out. | Sum | Count |
| Memory Utilization | The percentage of the total memory on a worker instance. | Maximum | Percentage |
| Rebalance Completed Total | The total number of rebalances completed by this connector. | Maximum | Count |
| Rebalance Time Average | The average time in milliseconds spent by the connector on rebalancing. | Average | Milliseconds |
| Rebalance Time Maximum | The maximum time in milliseconds spent by the connector on rebalancing. | Maximum | Milliseconds |
| Rebalance Time Since Last | The time in milliseconds since this connector completed the most recent rebalance. | Average | Milliseconds |
| Running Task Count | The running number of tasks in the connector. | Maximum | Count |
| Sink Record Read Rate | The average per-second number of records read from the Apache Kafka or Amazon MSK Cluster. | Average | Count |
| Sink Record Send Rate | The average per-second number of records that are output from the transformations and sent to the destination. | Average | Count |
| Source Record Poll Rate | The average per-second number of records produced or polled. | Average | Count |
| Source Record Write Rate | The average per-second number of records output from the transformations and written to the Apache Kafka or Amazon MSK Cluster. | Average | Count |
| Task Startup Attempts Total | The total number of task startups that the connector has attempted. | Sum | Count |
| Task Startup Success Percentage | The average percentage of successful task starts for the connector. | Average | Percentage |
| Worker Count | The number of workers that are running in the connector. | Maximum | Count |
MSK Broker
The supported metrics for MSK Broker monitor are provided below:
| Metric name | Description | Statistics | Unit |
|---|---|---|---|
| CPU Credit Balance | The number of earned CPU credit used by a broker. | Maximum | Count |
| Burst Balance | The credit balance available for the EBS Volume monitors in the cluster. | Sum | Count |
| Client Connection Count | The number of active authenticated client connections. | Maximum | Count |
| Connection Count | The number of active authenticated, unauthenticated, and inter-broker connections. | Maximum | Count |
| CPU Idle | The percentage of CPU idle time. | Average | Percentage |
| CPU IO Wait | The percentage of CPU idle time during a pending disk operation. | Average | Percentage |
| CPU System | The percentage of CPU that has kernel space. | Average | Percentage |
| CPU User | The percentage of CPU that has user space. | Average | Percentage |
| Kafka AppLogs Disk Used | The maximum disk space used for application logs. | Maximum | Percentage |
| Kafka DataLogs Disk Used | The maximum disk space used for data logs. | Maximum | Percentage |
| Leader Count | The number of leaders for the partitions without including the replicas. | Maximum | Count |
| Memory Buffered | The size in bytes of buffered memory for the broker. | Average | Bytes |
| Memory Cached | The size in bytes of cached memory for the broker. | Average | Bytes |
| Memory Free | The size in bytes of memory that is free and available for the broker. | Average | Bytes |
| Heap Memory After GC | The percentage of total heap memory in use after garbage collection. | Average | Percentage |
| Memory Used | The size in bytes of the memory that is in use for the broker. | Average | Bytes |
| Messages In Per Sec | The number of messages received per second. | Maximum | Count |
| Network Rx Dropped | The number of dropped receive packages. | Sum | Count |
| Network Rx Errors | The number of network receive errors for the broker. | Sum | Count |
| Network Rx Packets | The number of packets received by the broker. | Sum | Count |
| Network Tx Dropped | The number of dropped transmit packages. | Sum | Count |
| Network Tx Errors | The number of network transmit errors for the broker. | Sum | Count |
| Network Tx Packets | The number of packets transmitted by the broker. | Sum | Count |
| Offline Partitions Count | The total number of partitions that are offline in the cluster. | Maximum | Count |
| Partition Count | The number of partitions per broker, including replicas. | Maximum | Count |
| Produce Total Time Ms Mean | The mean produce time in milliseconds. | Average | Milliseconds |
| Request Bytes Mean | The mean number of request bytes for the broker. | Average | Bytes |
| Request Time | The average time in milliseconds spent in the broker network and I/O threads to process requests. | Average | Milliseconds |
| Root Disk Used | The percentage of the root disk used by the broker. | Maximum | Percentage |
| Swap Free | The size in bytes of swap memory that is available for the broker. | Average | Bytes |
| Swap Used | The size in bytes of swap memory that is in use for the broker. | Average | Bytes |
| Traffic Shaping | The number of packets shaped (dropped or queued) due to exceeding network allocations. | Maximum | Count |
| Under MinIsr Partition Count | The number of under minIsr partitions for the broker. | Maximum | Count |
| Under Replicated Partitions | The number of under-replicated partitions for the broker. | Maximum | Count |
| ZooKeeper Request Latency Ms Mean | The mean latency for Apache ZooKeeper requests from the broker. | Average | Milliseconds |
| ZooKeeper Session State | The connection status of the broker's ZooKeeper session which may be one of the following: NOT_CONNECTED: '0.0', ASSOCIATING: '0.1', CONNECTING: '0.5', CONNECTEDREADONLY: '0.8', CONNECTED: '1.0', CLOSED: '5.0', AUTH_FAILED: '10.0'. | Maximum | Count |
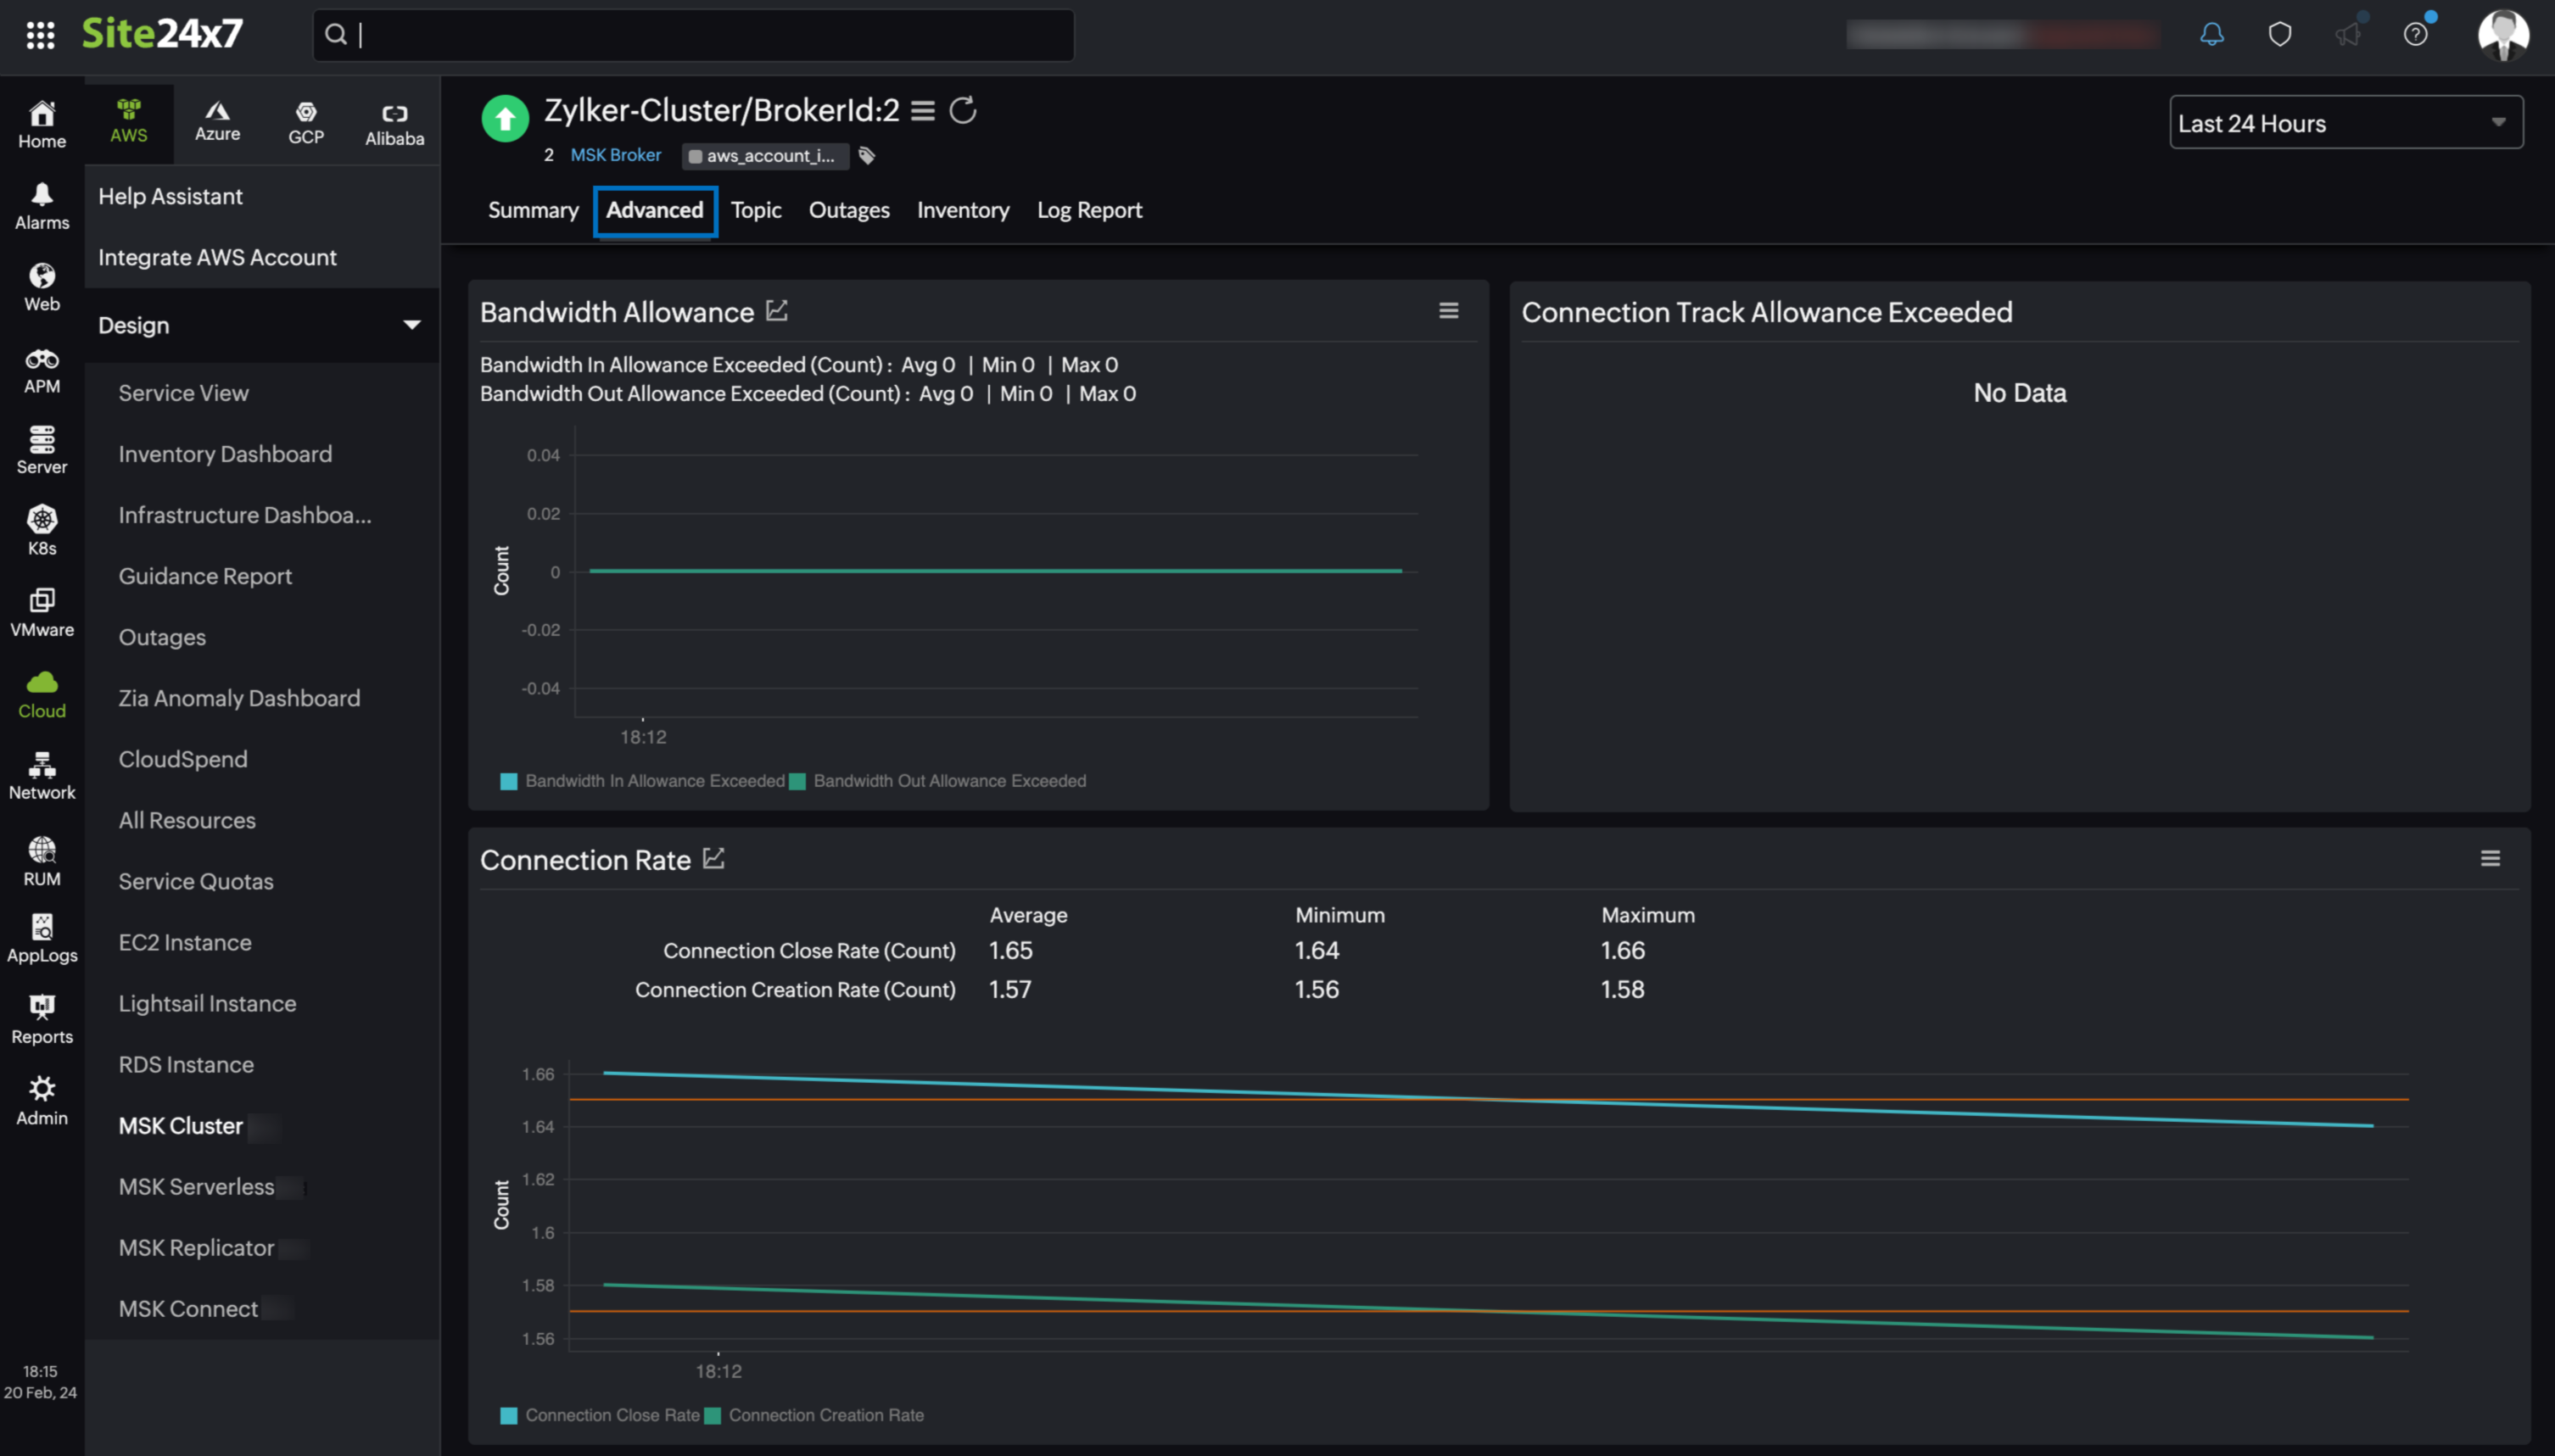
Per Broker
If your monitoring level is set to PER_BROKER in AWS, you get the metrics described in the following table in addition to all the DEFAULT level metrics. The PER_BROKER metrics are available under the Advanced tab.
The supported metrics for Per Broker monitor are provided below:
| Metric name | Description | Statistics | Unit |
|---|---|---|---|
| Bandwidth In Allowance Exceeded | The number of packets shaped because the inbound aggregate bandwidth exceeded the maximum for the broker. | Maximum | Count |
| Bandwidth Out Allowance Exceeded | The number of packets shaped because the outbound aggregate bandwidth exceeded the maximum for the broker. | Maximum | Count |
| Connection Track Allowance Exceeded | The number of packets shaped because the connection tracking exceeded the maximum for the broker. | Maximum | Count |
| Connection Close Rate | The number of connections closed per second per listener. | Sum | Count |
| Connection Creation Rate | The number of new connections established per second per listener. | Sum | Count |
| CPU Credit Usage | The number of CPU credits spent by the broker. | Sum | Count |
| Fetch Consumer Local Time Ms Mean | The mean time in milliseconds that the consumer request is processed at the leader. | Average | Milliseconds |
| Fetch Consumer Request Queue Time Ms Mean | The mean time in milliseconds that the consumer request waits in the request queue. | Average | Milliseconds |
| Fetch Consumer Response Queue Time Ms Mean | The mean time in milliseconds that the consumer request waits in the response queue. |
Average | Milliseconds |
| Fetch Consumer Response SendTime Ms Mean | The mean time in milliseconds for the consumer to send a response. |
Average | Milliseconds |
| Fetch Consumer TotalTime Ms Mean | The mean total time in milliseconds that consumers spend on fetching data from the broker. | Average | Milliseconds |
| Fetch Follower LocalTime Ms Mean | The mean time in milliseconds that the follower request is processed at the leader. | Average | Milliseconds |
| Fetch Follower Request Queue Time Ms Mean | The mean time in milliseconds that the follower request waits in the request queue. | Average | Milliseconds |
| Fetch Follower Response QueueTime Ms Mean | The mean time in milliseconds that the follower request waits in the response queue. | Average | Milliseconds |
| Fetch Follower Response SendTime Ms Mean | The mean time in milliseconds for the follower to send a response. | Average | Milliseconds |
| Fetch Follower TotalTime Ms Mean | The mean total time in milliseconds that followers spend on fetching data from the broker. | Average | Milliseconds |
| Fetch Message Conversions Per Sec | The number of fetch message conversions per second for the broker. | Average | Count |
| Fetch Throttle Byte Rate | The number of throttled bytes per second. | Average | Bytes |
| Fetch Throttle Queue Size | The number of messages in the throttle queue. | Average | Count |
| Fetch Throttle Time | The average fetch throttle time in milliseconds. | Average | Milliseconds |
| Network Processor Average Idle Percent | The average percentage of the time the network processors are idle. | Average | Percentage |
| PPS Allowance Exceeded | The number of packets shaped because the bidirectional PPS exceeded the maximum for the broker. | Maximum | Count |
| Produce LocalTime Ms Mean | The mean time in milliseconds that the request is processed at the leader. | Average | Count |
| Produce Message Conversions Per Sec | The number of produce message conversions per second for the broker. | Average | Count |
| Produce Message Conversions Time Ms Mean | The mean time in milliseconds spent on message format conversions. | Average | Milliseconds |
| Produce Request Queue Time Ms Mean | The mean time in milliseconds that request messages spend in the queue. | Average | Milliseconds |
| Produce Response Queue Time Ms Mean | The mean time in milliseconds that response messages spend in the queue. | Average | Milliseconds |
| Produce Response SendTime Ms Mean | The mean time in milliseconds spent on sending response messages. | Average | Milliseconds |
| Produce Throttle Byte Rate | The number of throttled bytes per second. | Maximum | Bytes |
| Produce Throttle Queue Size | The number of messages in the throttle queue. | Maximum | Count |
| Produce Throttle Time | The average produce throttle time in milliseconds. | Average | Milliseconds |
| Remote Fetch Bytes Per Sec | The total number of bytes transferred from tiered storage in response to consumer fetches. | Maximum | Bytes |
| Remote Copy Bytes Per Sec | The total number of bytes transferred to tiered storage, including data from log segments, indexes, and other auxiliary files. | Maximum | Bytes |
| Remote LogManager Tasks Average Idle Percent | The average percentage of time the remote log manager spent idle. | Average | Percentage |
| Remote LogReader Average Idle Percent | The average percentage of time the remote log reader spent idle. | Average | Percentage |
| Remote LogReader Task Queue Size | The number of tasks responsible for reads from tiered storage that are waiting to be scheduled. | Sum | Count |
| Remote Fetch Errors Per Sec | The total rate of errors in response to read requests that the specified broker sent to tiered storage to retrieve data in response to consumer fetches. | Average | Count |
| Remote Fetch Requests Per Sec | The total number of read requests that the specifies broker sent to tiered storage to retrieve data in response to consumer fetches. | Average | Count |
| Remote Copy Errors Per Sec | The total rate of errors in response to write requests that the specified broker sent to tiered storage to transfer data upstream. | Average | Count |
| Replication Bytes In Per Sec | The number of bytes per second received from other brokers. | Average | Bytes |
| Replication Bytes Out Per Sec | The number of bytes per second sent to other brokers. | Average | Bytes |
| Request Exempt From Throttle Time | The average time in milliseconds spent in the broker network and I/O threads to process requests that are exempt from throttling. | Average | Milliseconds |
| Request Handler Average Idle Percent | The average percentage of the time the request handler threads are idle. | Average | Percentage |
| Request Throttle Queue Size | The number of messages in the throttle queue. | Average | Count |
| Request Throttle Time | The average request throttle time in milliseconds. | Average | Milliseconds |
| TCP Connections | Shows number of incoming and outgoing TCP segments with the Synchronization (SYN) flag set. | Sum | Count |
| Remote Copy Lag Bytes | The total number of bytes of the data that is eligible for tiering on the broker but has not been transferred to tiered storage yet. | Sum | Bytes |
| Traffic Bytes | Shows network traffic in overall bytes between clients (producers and consumers) and brokers. | Maximum | Bytes |
| Volume Queue Length | The number of read and write operation requests waiting to be completed in a specified time period. | Maximum | Count |
| Volume Read Bytes | The number of bytes read in a specified time period. | Sum | Bytes |
| Volume Read Ops | The number of read operations in a specified time period. | Sum | Count |
| Volume Total ReadTime | The total number of seconds spent by all read operations that completed in a specified time period. | Sum | Seconds |
| Volume Total WriteTime | The total number of seconds spent by all write operations that completed in a specified time period. | Sum | Seconds |
| VolumeWriteBytes | The number of bytes written in a specified time period. | Sum | Bytes |
| Volume Write Ops | The number of write operations in a specified time period. | Sum | Count |
MSK Topic
The supported metrics for MSK Topic monitor are provided below:
| Metric name | Description | Statistics | Unit |
|---|---|---|---|
| Bytes In Per Sec | The number of bytes per second received from clients. | Average | Bytes |
| Bytes Out Per Sec | The number of bytes per second sent to clients. | Average | Bytes |
| Fetch Message Conversions Per Sec | The number of fetch message conversions. | Average | Count |
| Messages In Per Sec | The number of incoming messages per second for the topic. | Average | Count |
| Produce Message Conversions Per Sec | The number of produce message conversions per second. | Average | Count |
| Remote Fetch Bytes Per Sec | The number of bytes transferred from tiered storage in response to consumer fetches for the specified topic and broker. | Average | Bytes |
| Remote Copy Bytes Per Sec | The number of bytes transferred to tiered storage, for the specified topic and broker. | Average | Bytes |
| Remote Fetch Errors Per Sec | The rate of errors in response to read requests that the specified broker sends to tiered storage to retrieve data in response to consumer fetches on the specified topic. | Maximum | Count |
| Remote Fetch Requests Per Sec | The number of read requests that the specified broker sends to tiered storage to retrieve data in response to consumer fetches on the specified topic. | Maximum | Count |
| Remote Copy Errors Per Sec | The rate of errors in response to write requests that the specified broker sends to tiered storage to transfer data upstream. | Maximum | Count |
| Total Max Offset Lag | The maximum offset lag across all partitions in a topic. | Maximum | Count |
| Total Estimated Max Time Lag |
The estimated time it would take for the consumer to catch up to the latest message, considering the biggest gap (MaxOffsetLag). If this number is high, it means there is a significant delay before messages are read, indicating that the consumer is lagging behind and may need adjustments to keep up with the message production rate. |
Maximum | Milliseconds |
| Total Sum Offset Lag | The aggregated offset lag for all the partitions in a topic. | Sum | Count |
| Total Rolling Estimated Time Lag Max | The highest estimated time lag averaged over a rolling time window. This provides a stable view of the maximum delay in message consumption over a period of time, helping you understand if there are consistent delays in message processing. | Maximum | Milliseconds |
Threshold configuration
To configure thresholds for Amazon MSK:
- Log in to your Site24x7 account and navigate to Admin > Configuration Profiles > Threshold and Availability.
- Click Add Threshold Profile.
- Select the applicable monitor type from the Monitor Type drop-down menu and provide an appropriate name in the Display Name field. The applicable monitor types are MSK Cluster, MSK Serverless, MSK Replicator, MSK Connect, MSK Broker, and MSK Topic.
- The supported metrics are displayed in the Threshold Configuration section. You can set threshold values for all the metrics mentioned above.
- Click Save.
You can manage all the alerts to ensure that the notifications are sent through the parent monitor with the status propagation feature.
Licensing
- MSK Cluster: Each MSK Cluster monitor is considered a basic monitor.
- MSK Serverless: The MSK Serverless monitor is free.
- MSK Replicator: Each MSK Replicator monitor is considered a basic monitor.
- MSK Connect: Each MSK Connect monitor is considered a basic monitor.
- MSK Broker: Each MSK Broker monitor is considered a basic monitor.
- MSK Topic: Each MSK Topic monitor is considered a basic monitor.
Viewing Amazon MSK data
To monitor your Amazon MSK, log in to your Site24x7 account and navigate to Cloud > AWS > Amazon MSK.
Amazon MSK monitor data
The monitor data for each Amazon MSK monitor is given below.
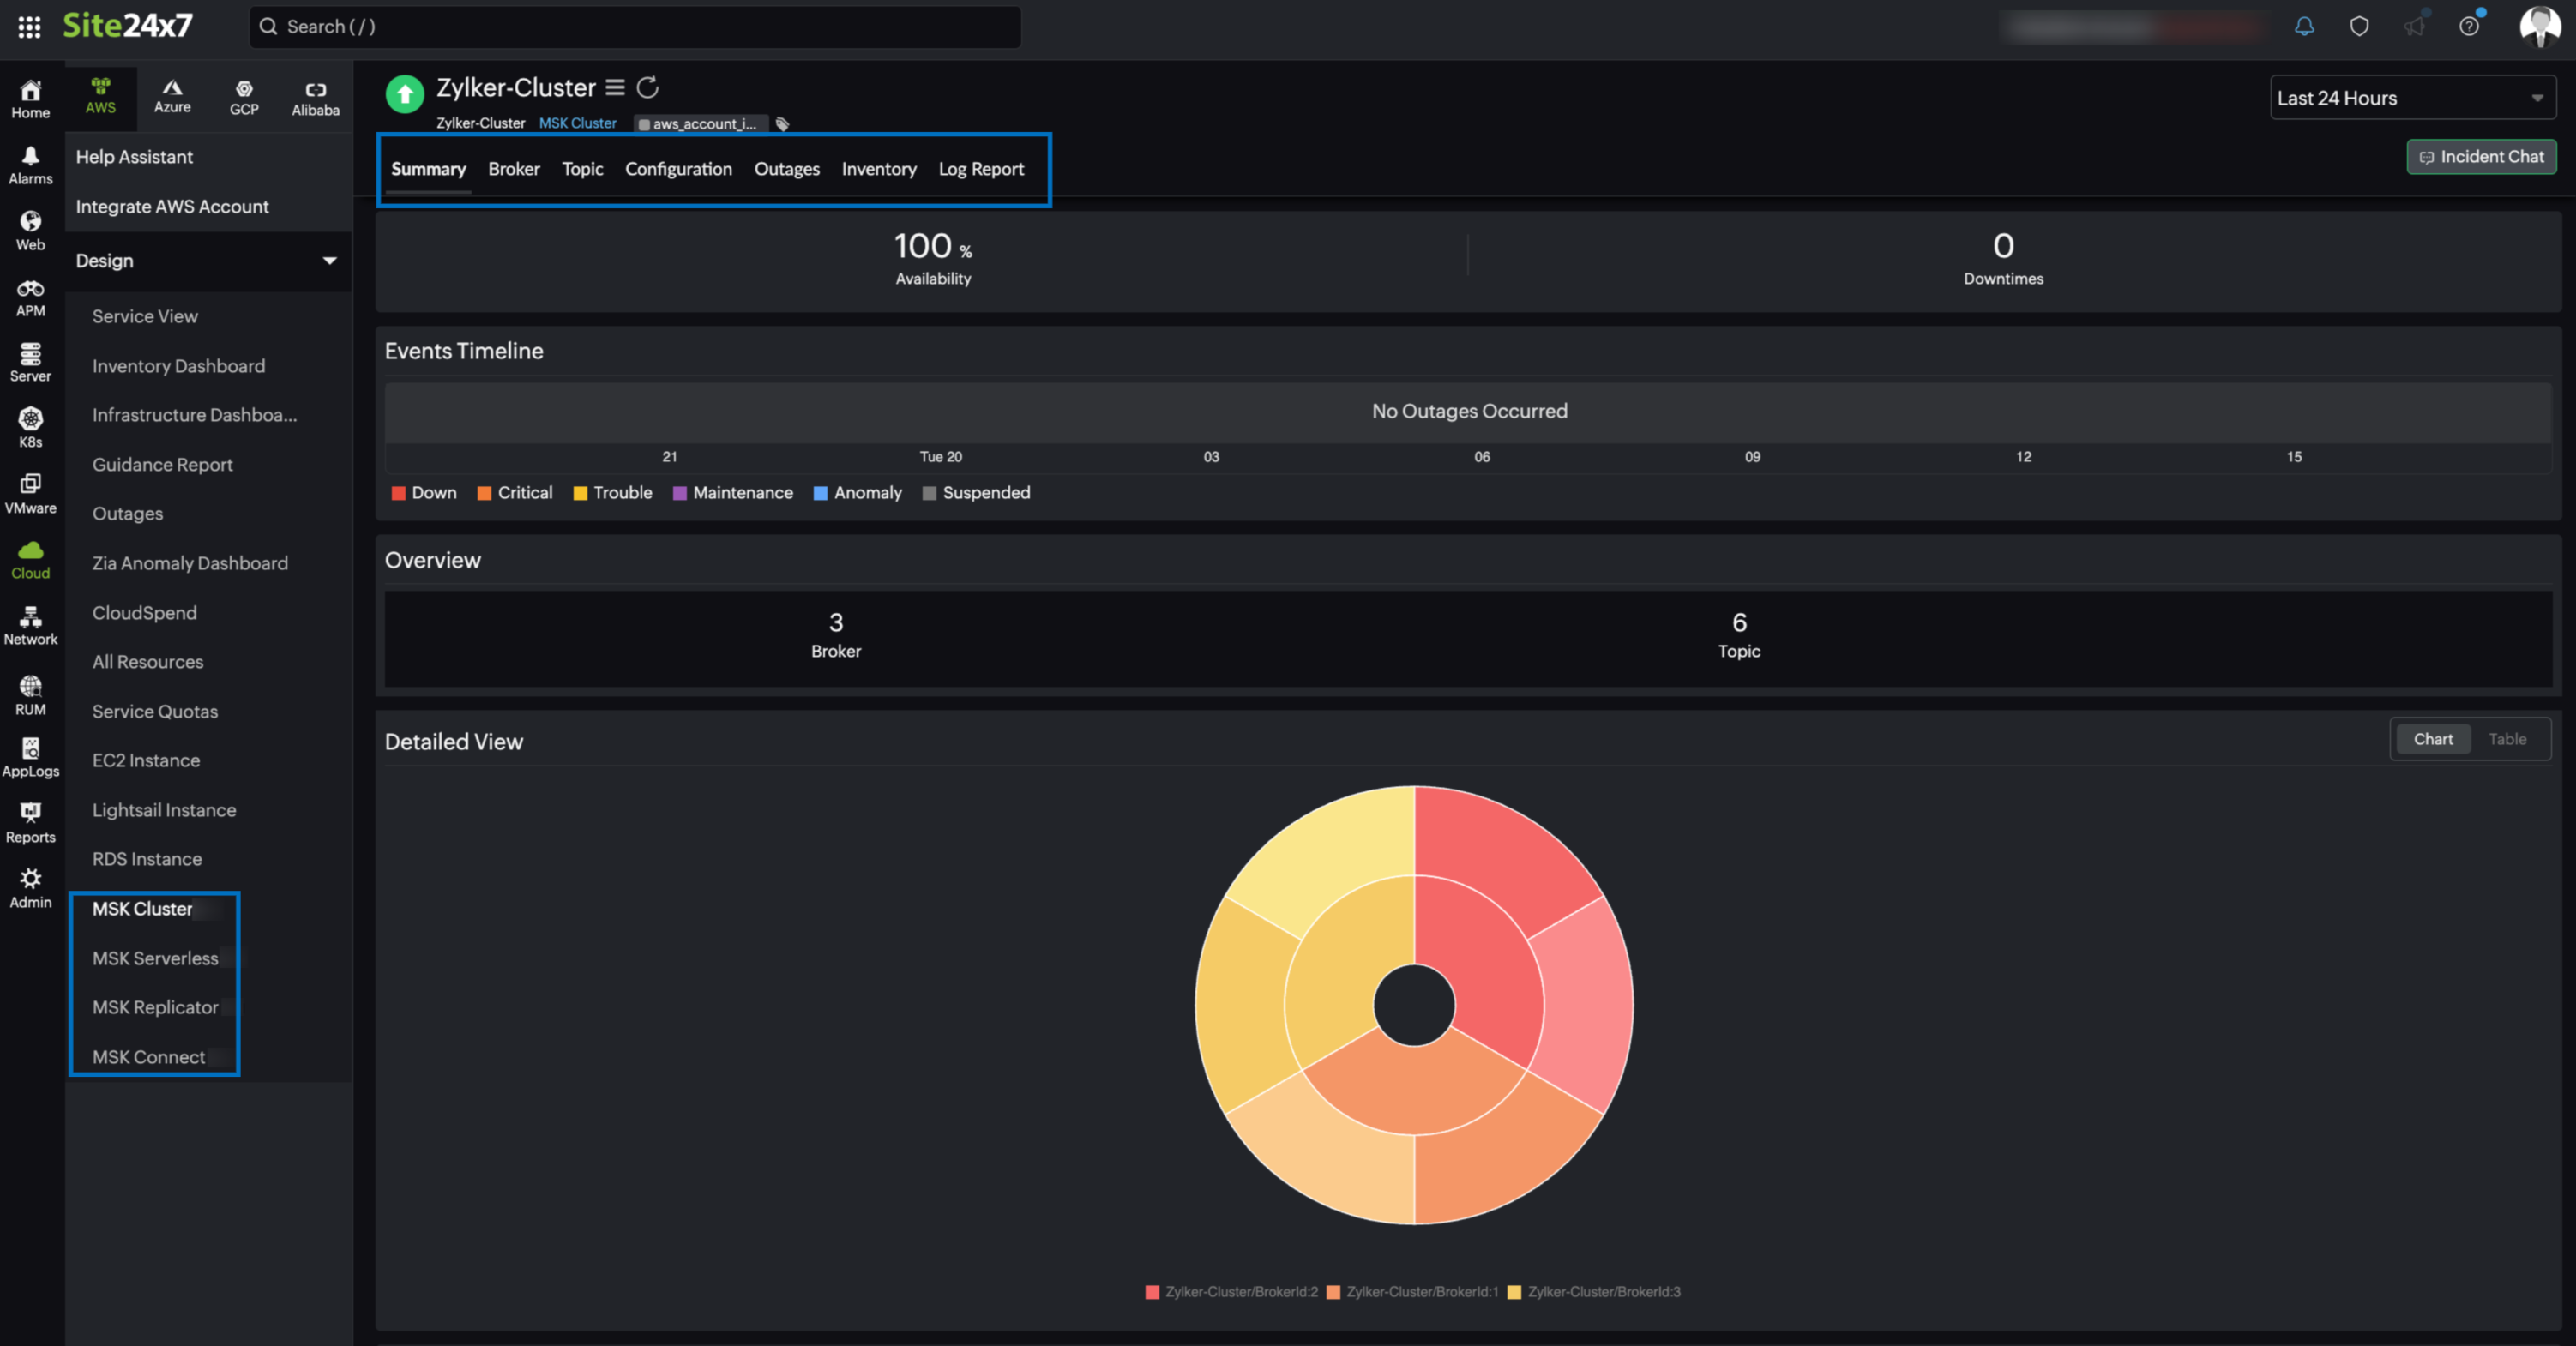
MSK Cluster
You can view your MSK Cluster data on the following tabs.
Summary
The Summary tab provides an overview of the events timeline and metrics in the form of charts.
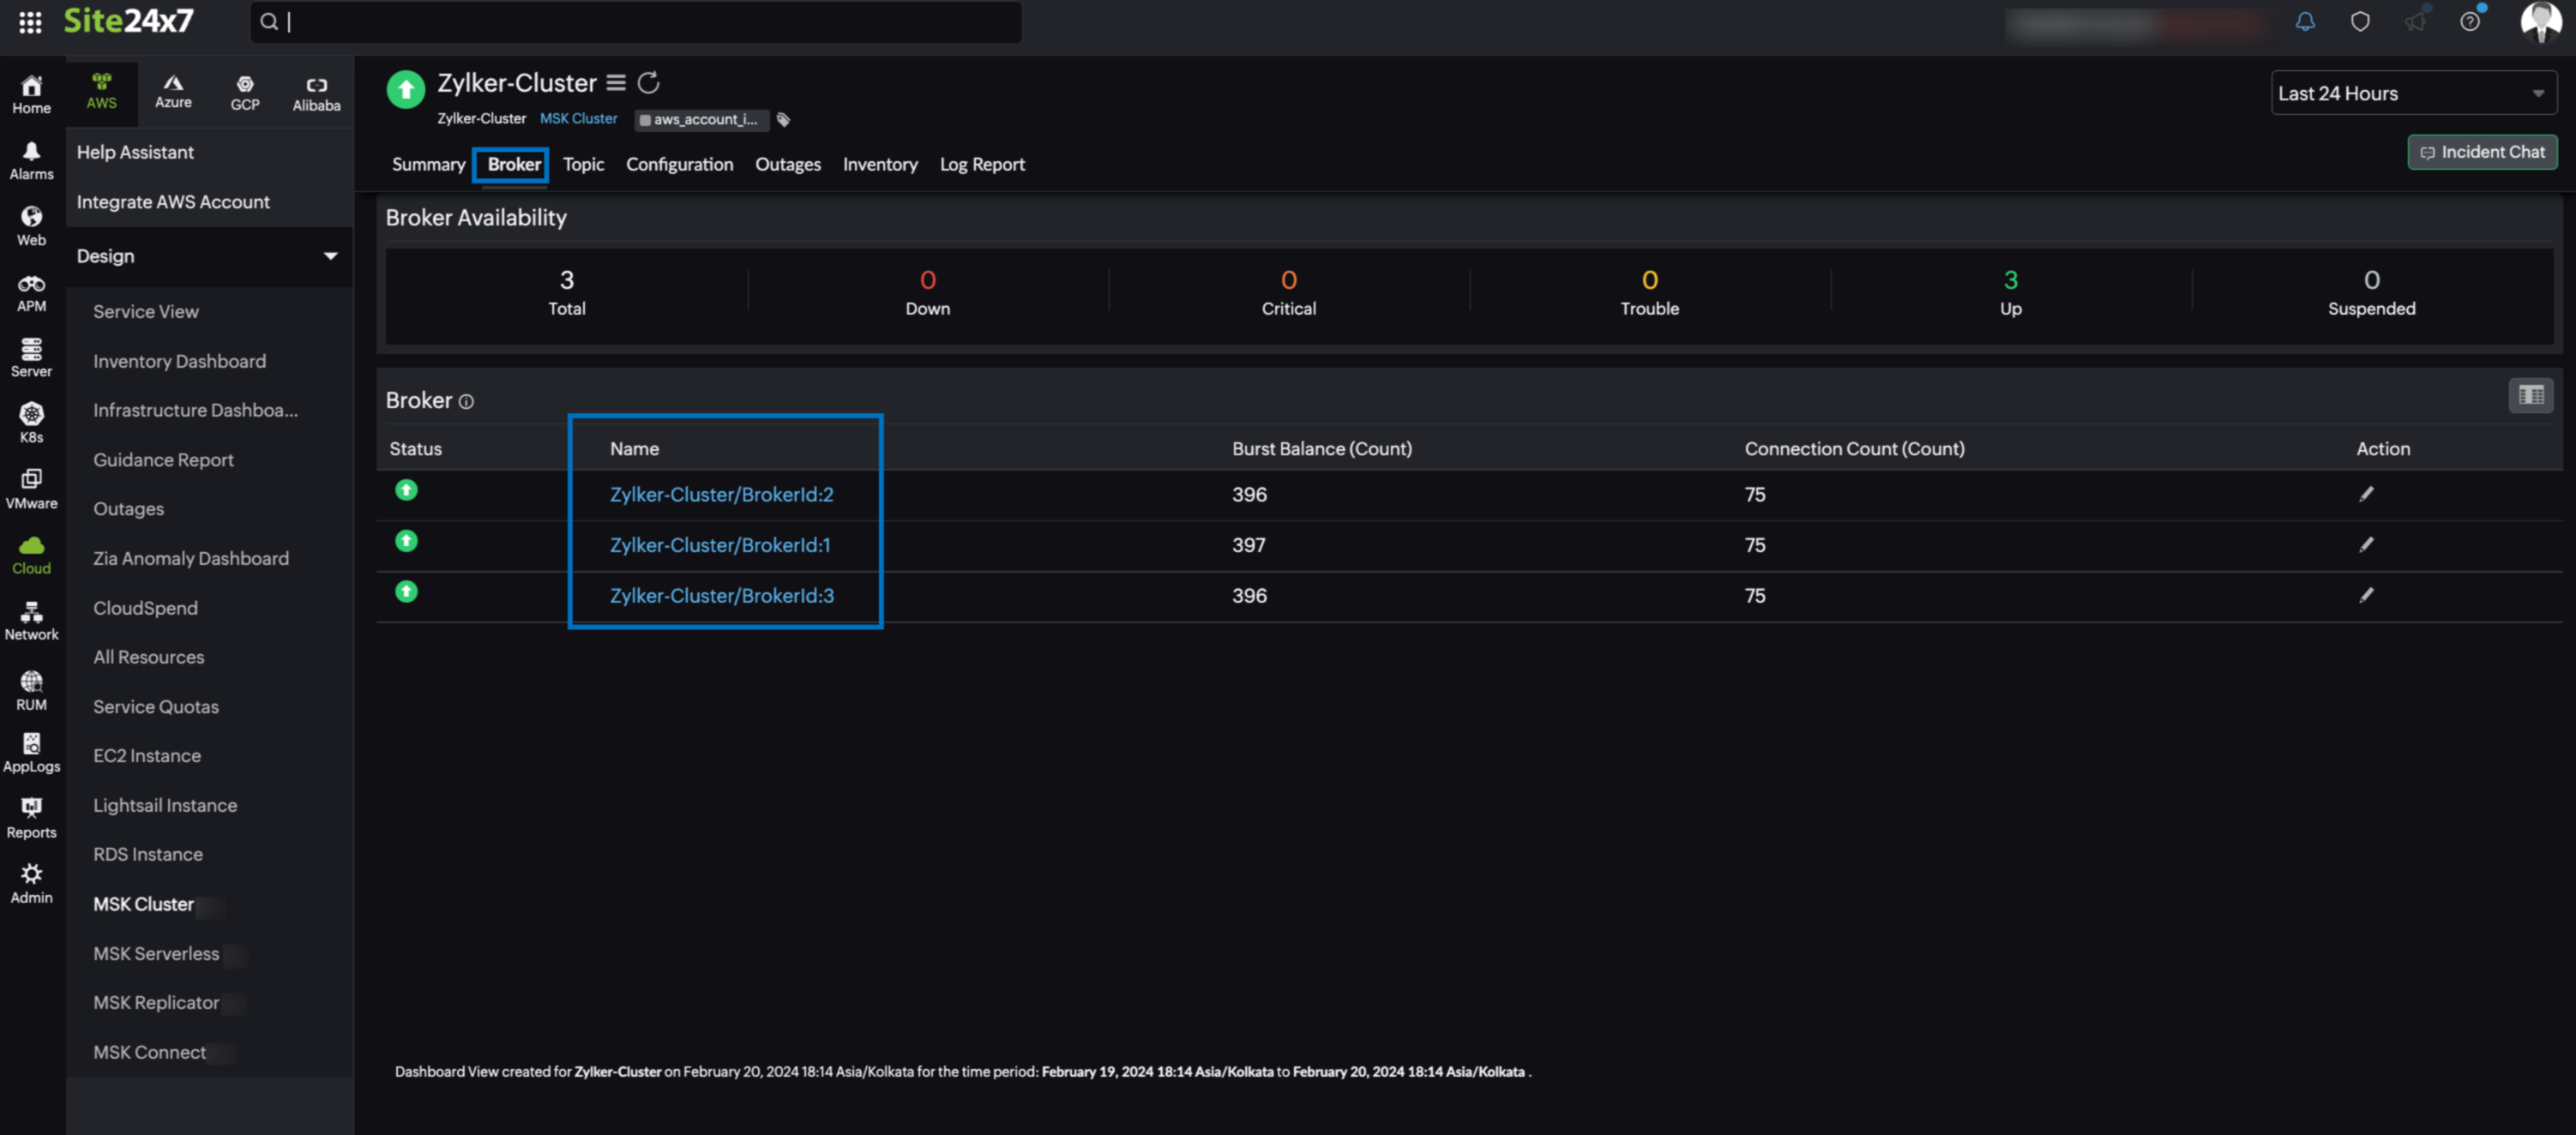
Broker
You can view the Broker Availability along with the Broker monitors associated with your cluster in this tab. Click the applicable Broker monitor from the Broker list to view the monitor details.
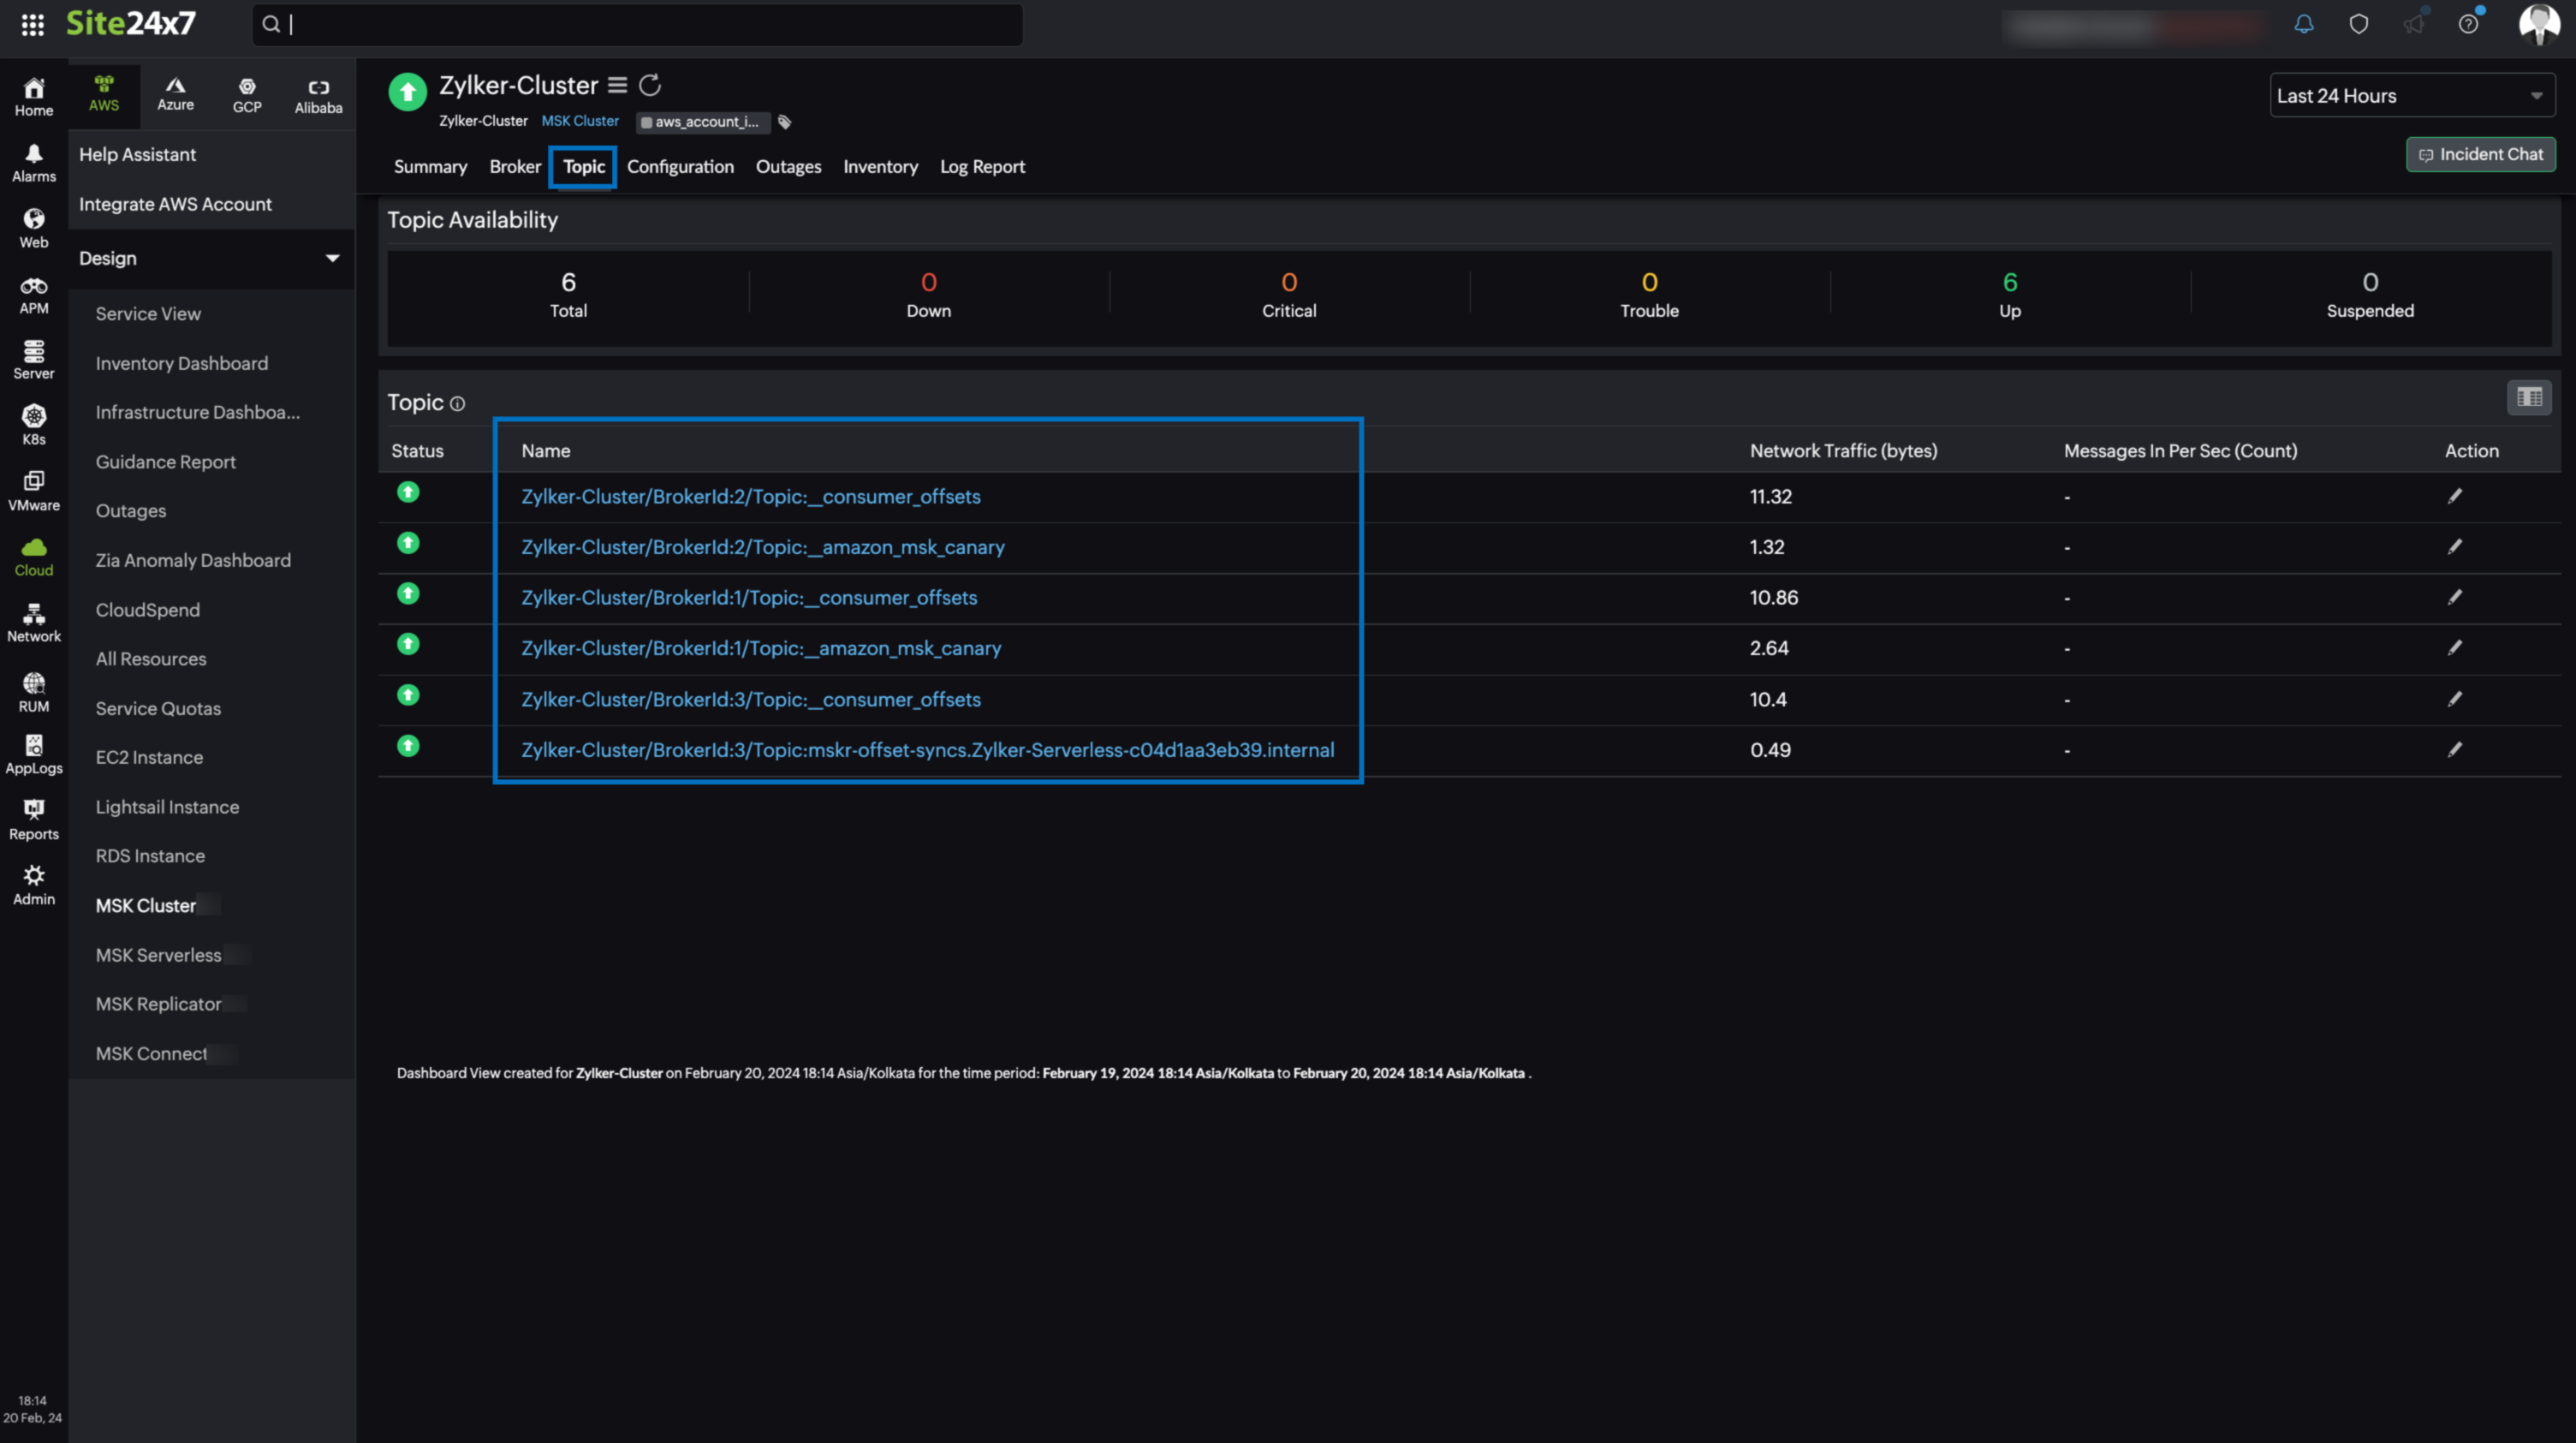
Topic
The Topic tab displays the Topic Availability and Topic instances associated with your cluster. Click the applicable Topic instance from the Topic list to view the monitor details.
Configuration
The Configuration tab summarizes essential details of your MSK cluster, such as Cluster ARN, Cluster Name, Current State, and Number of Brokers.
Outages
The Outages tab provides details on an outage's start time, end time, duration, and comments (if any).
Inventory
Obtain details like Cluster Name, Region, and Monitor Licensing Category from the Inventory tab. Set and view the Threshold and Availability Profile and the Notification Profile according to the user in this tab.
Log Report
This tab offers a consolidated report of the MSK Cluster monitor's log status, which can be downloaded as a CSV file.
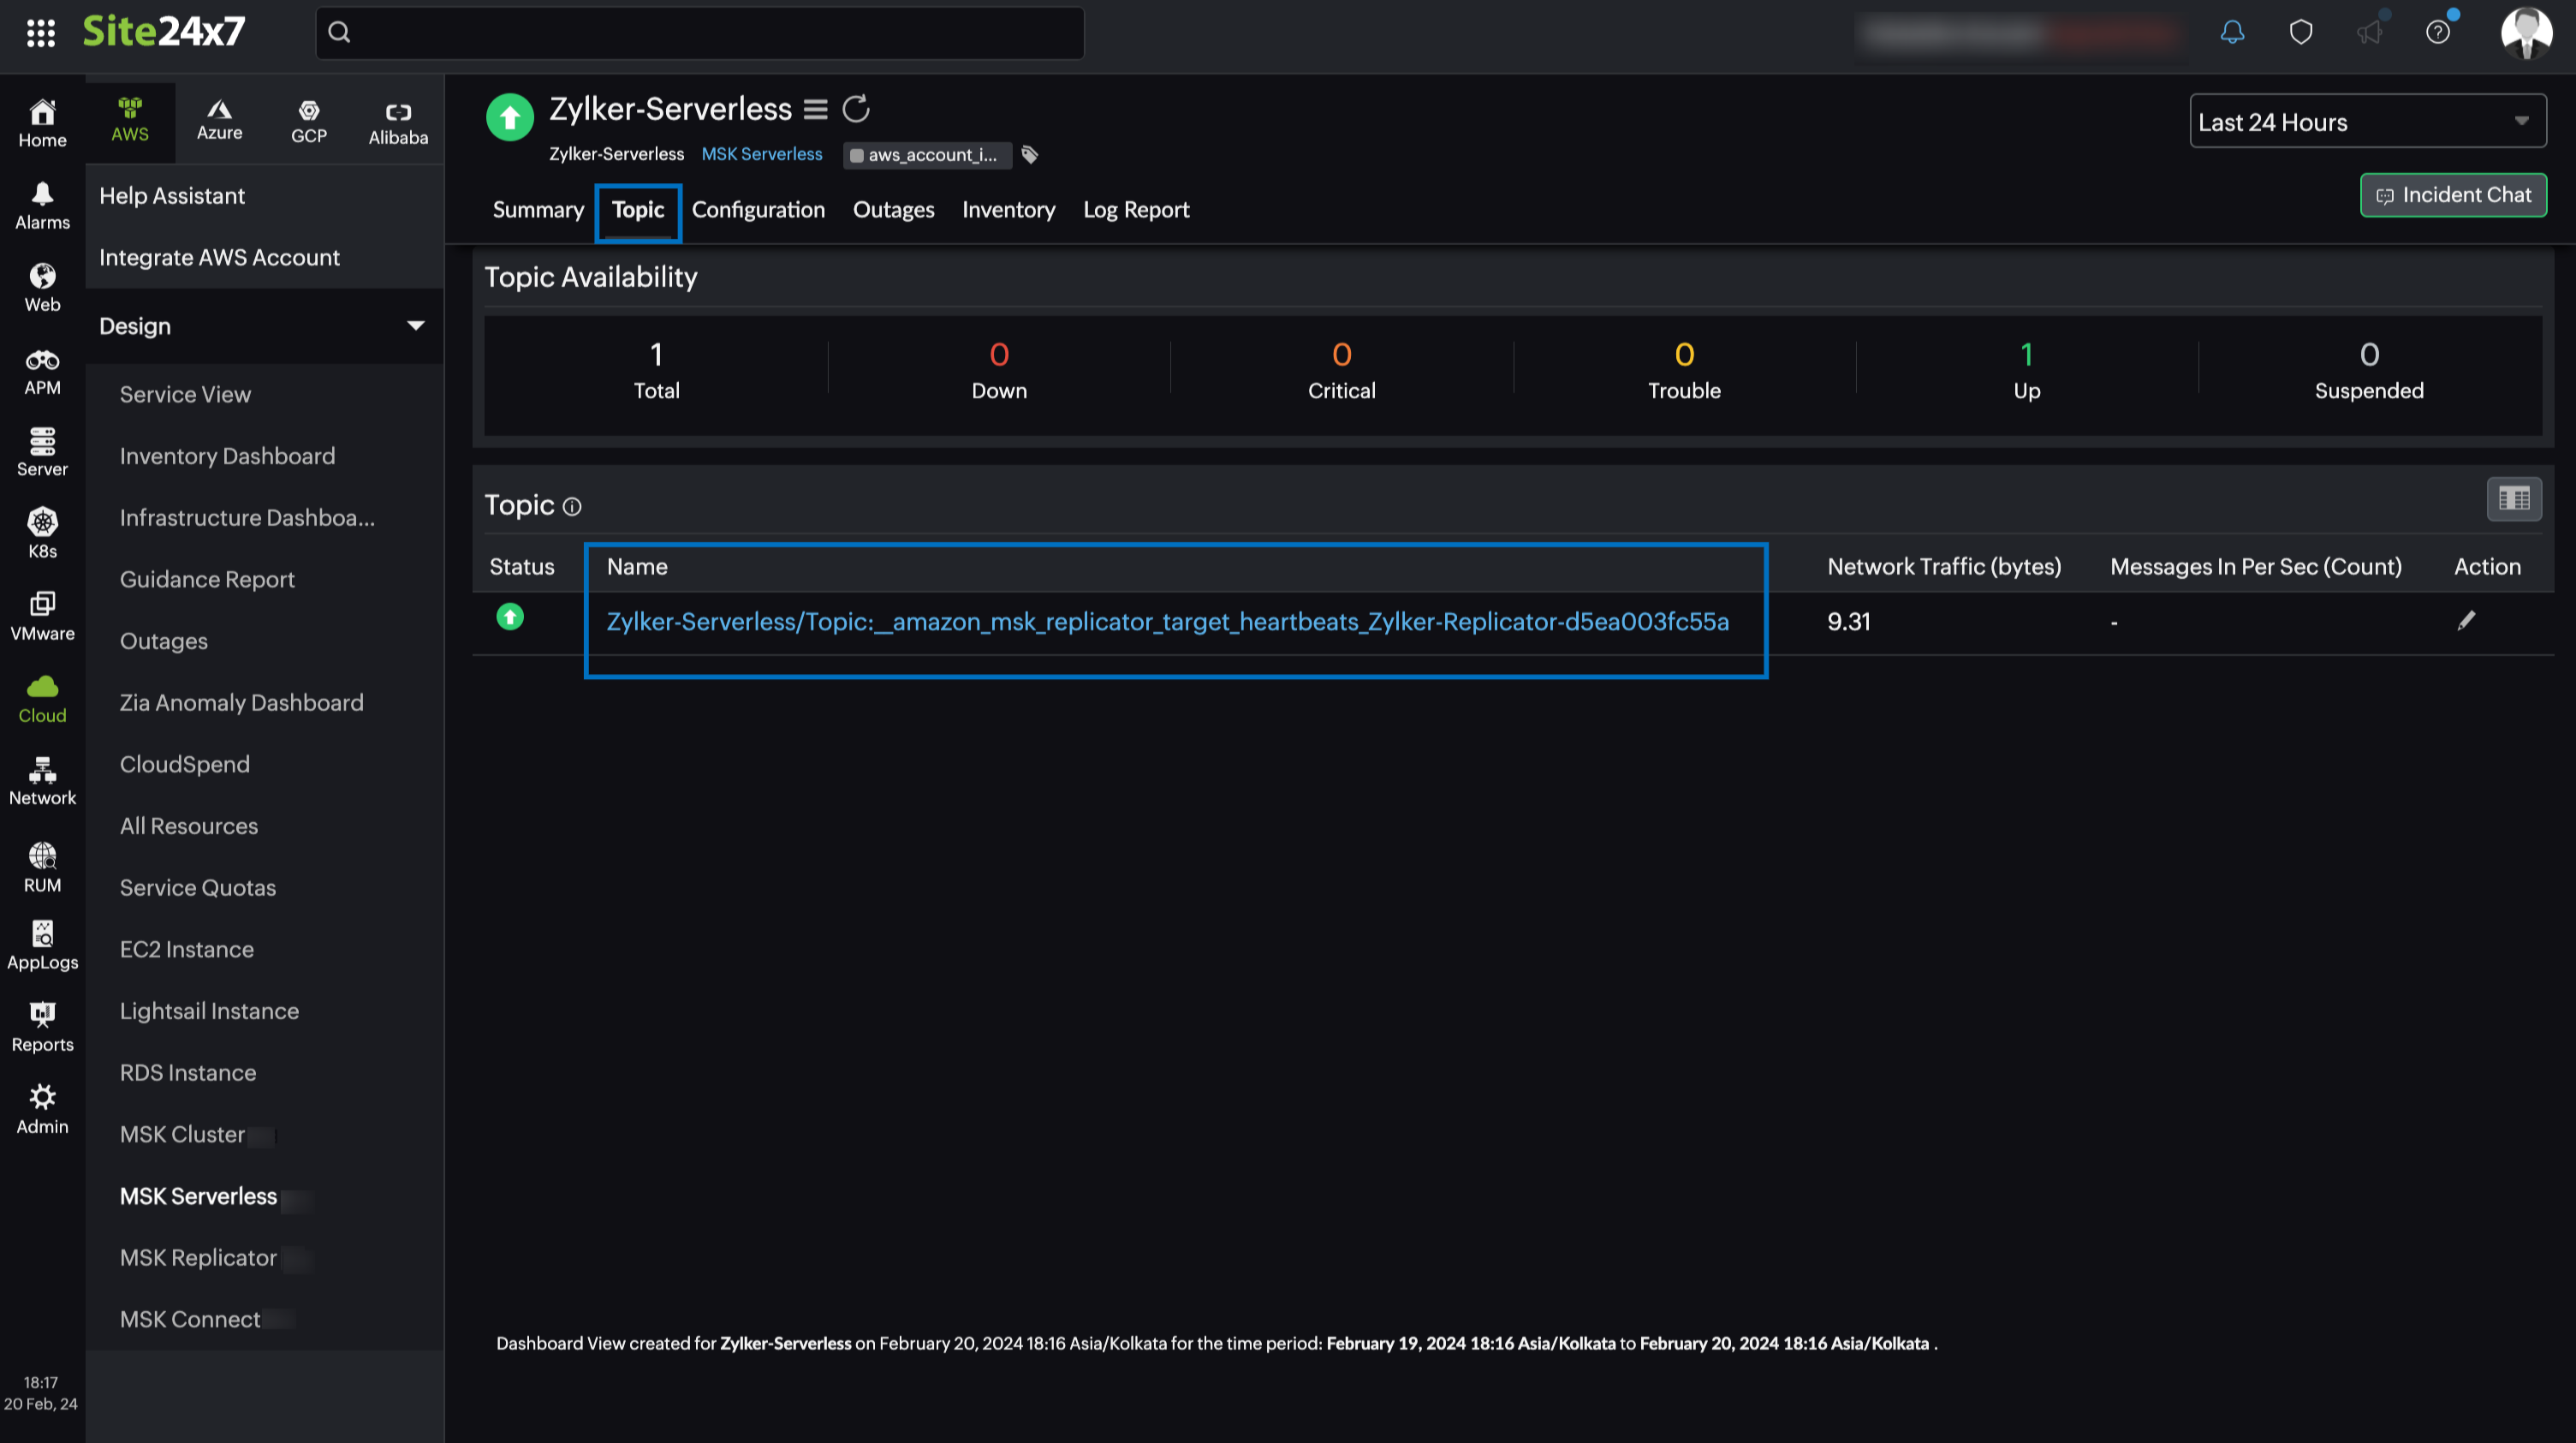
MSK Serverless
You can view your MSK Serverless data on the following tabs.
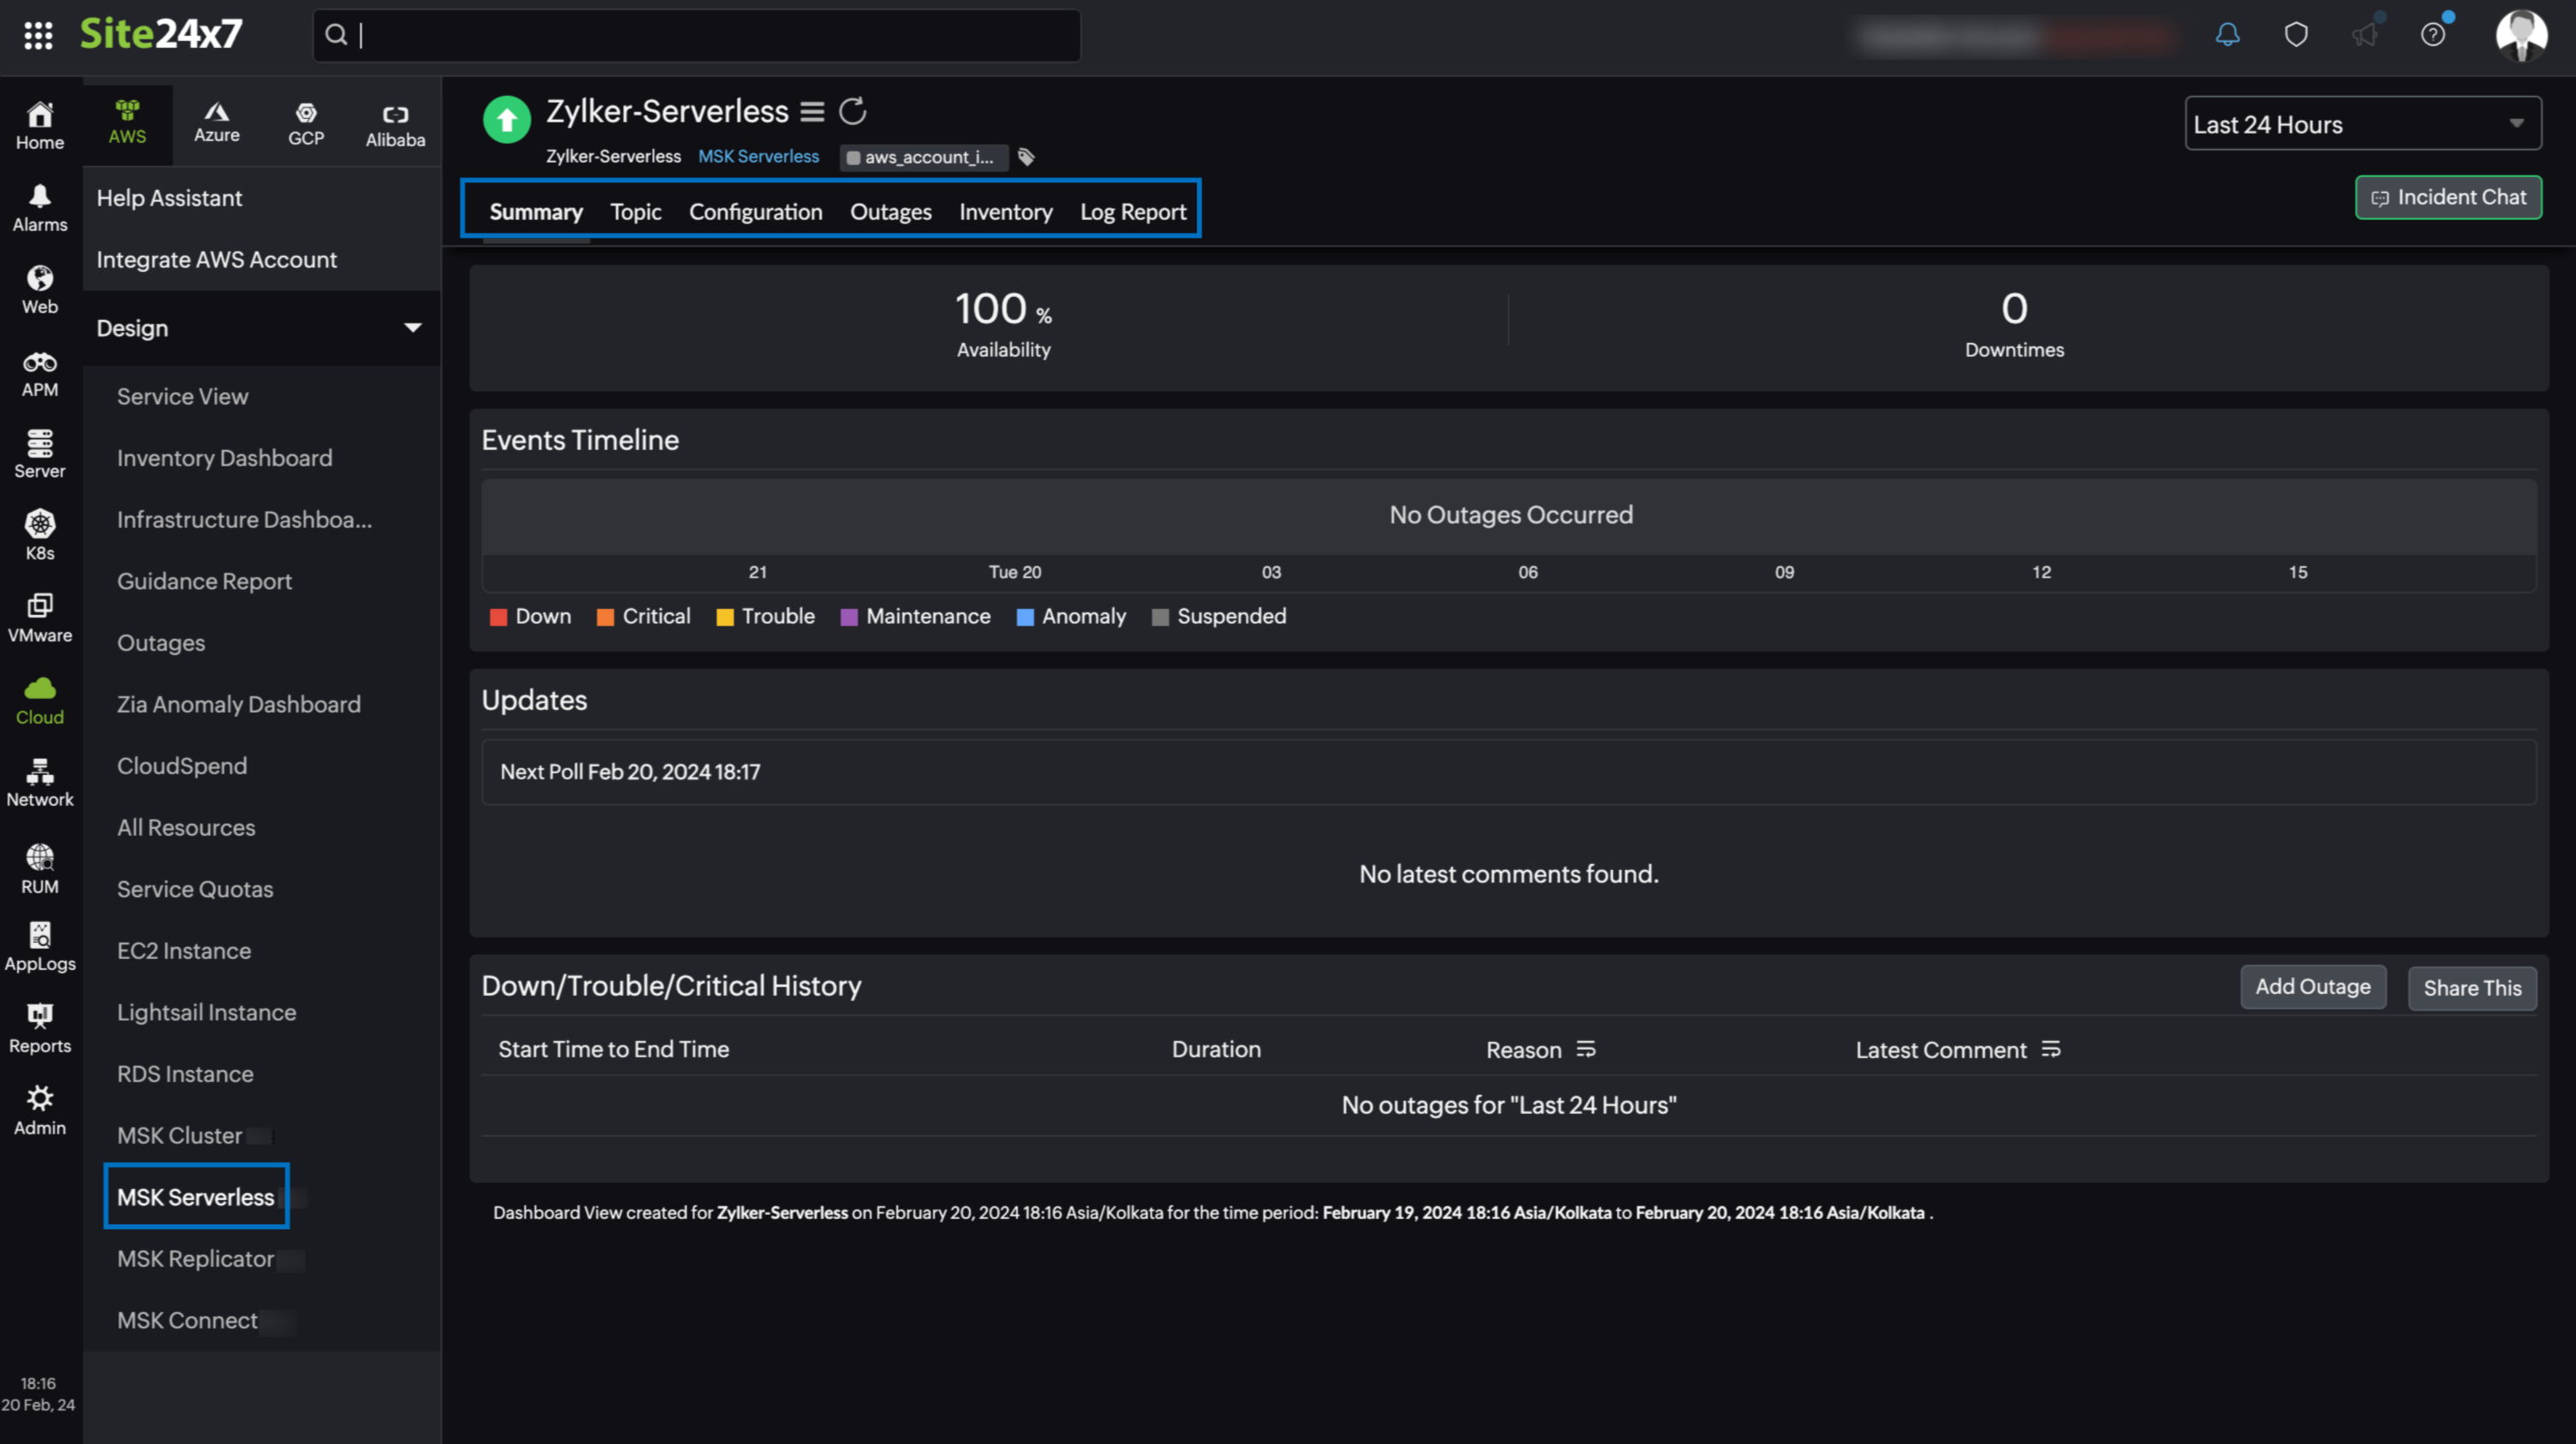
Summary
The Summary tab provides an overview of the events timeline and metrics in the form of charts.
Topic
The Topic tab displays the Topic Availability and Topic instances associated with your cluster. Click the applicable Topic instance from the Topic list to view the monitor details.
Configuration
The Configuration tab summarizes essential details of your MSK Serverless, such as Cluster ARN, Cluster Name, Current State, and Created Date.
Outages
The Outages tab provides details on an outage's start time, end time, duration, and comments (if any).
Inventory
Obtain details like Cluster Name, Region, and Monitor Licensing Category from the Inventory tab. Set and view the Threshold and Availability Profile and the Notification Profile according to the user in this tab.
Log Report
This tab offers a consolidated report of the MSK Serverless monitor's log status, which can be downloaded as a CSV file.
MSK Replicator
You can view your MSK Replicator data under the following tabs.
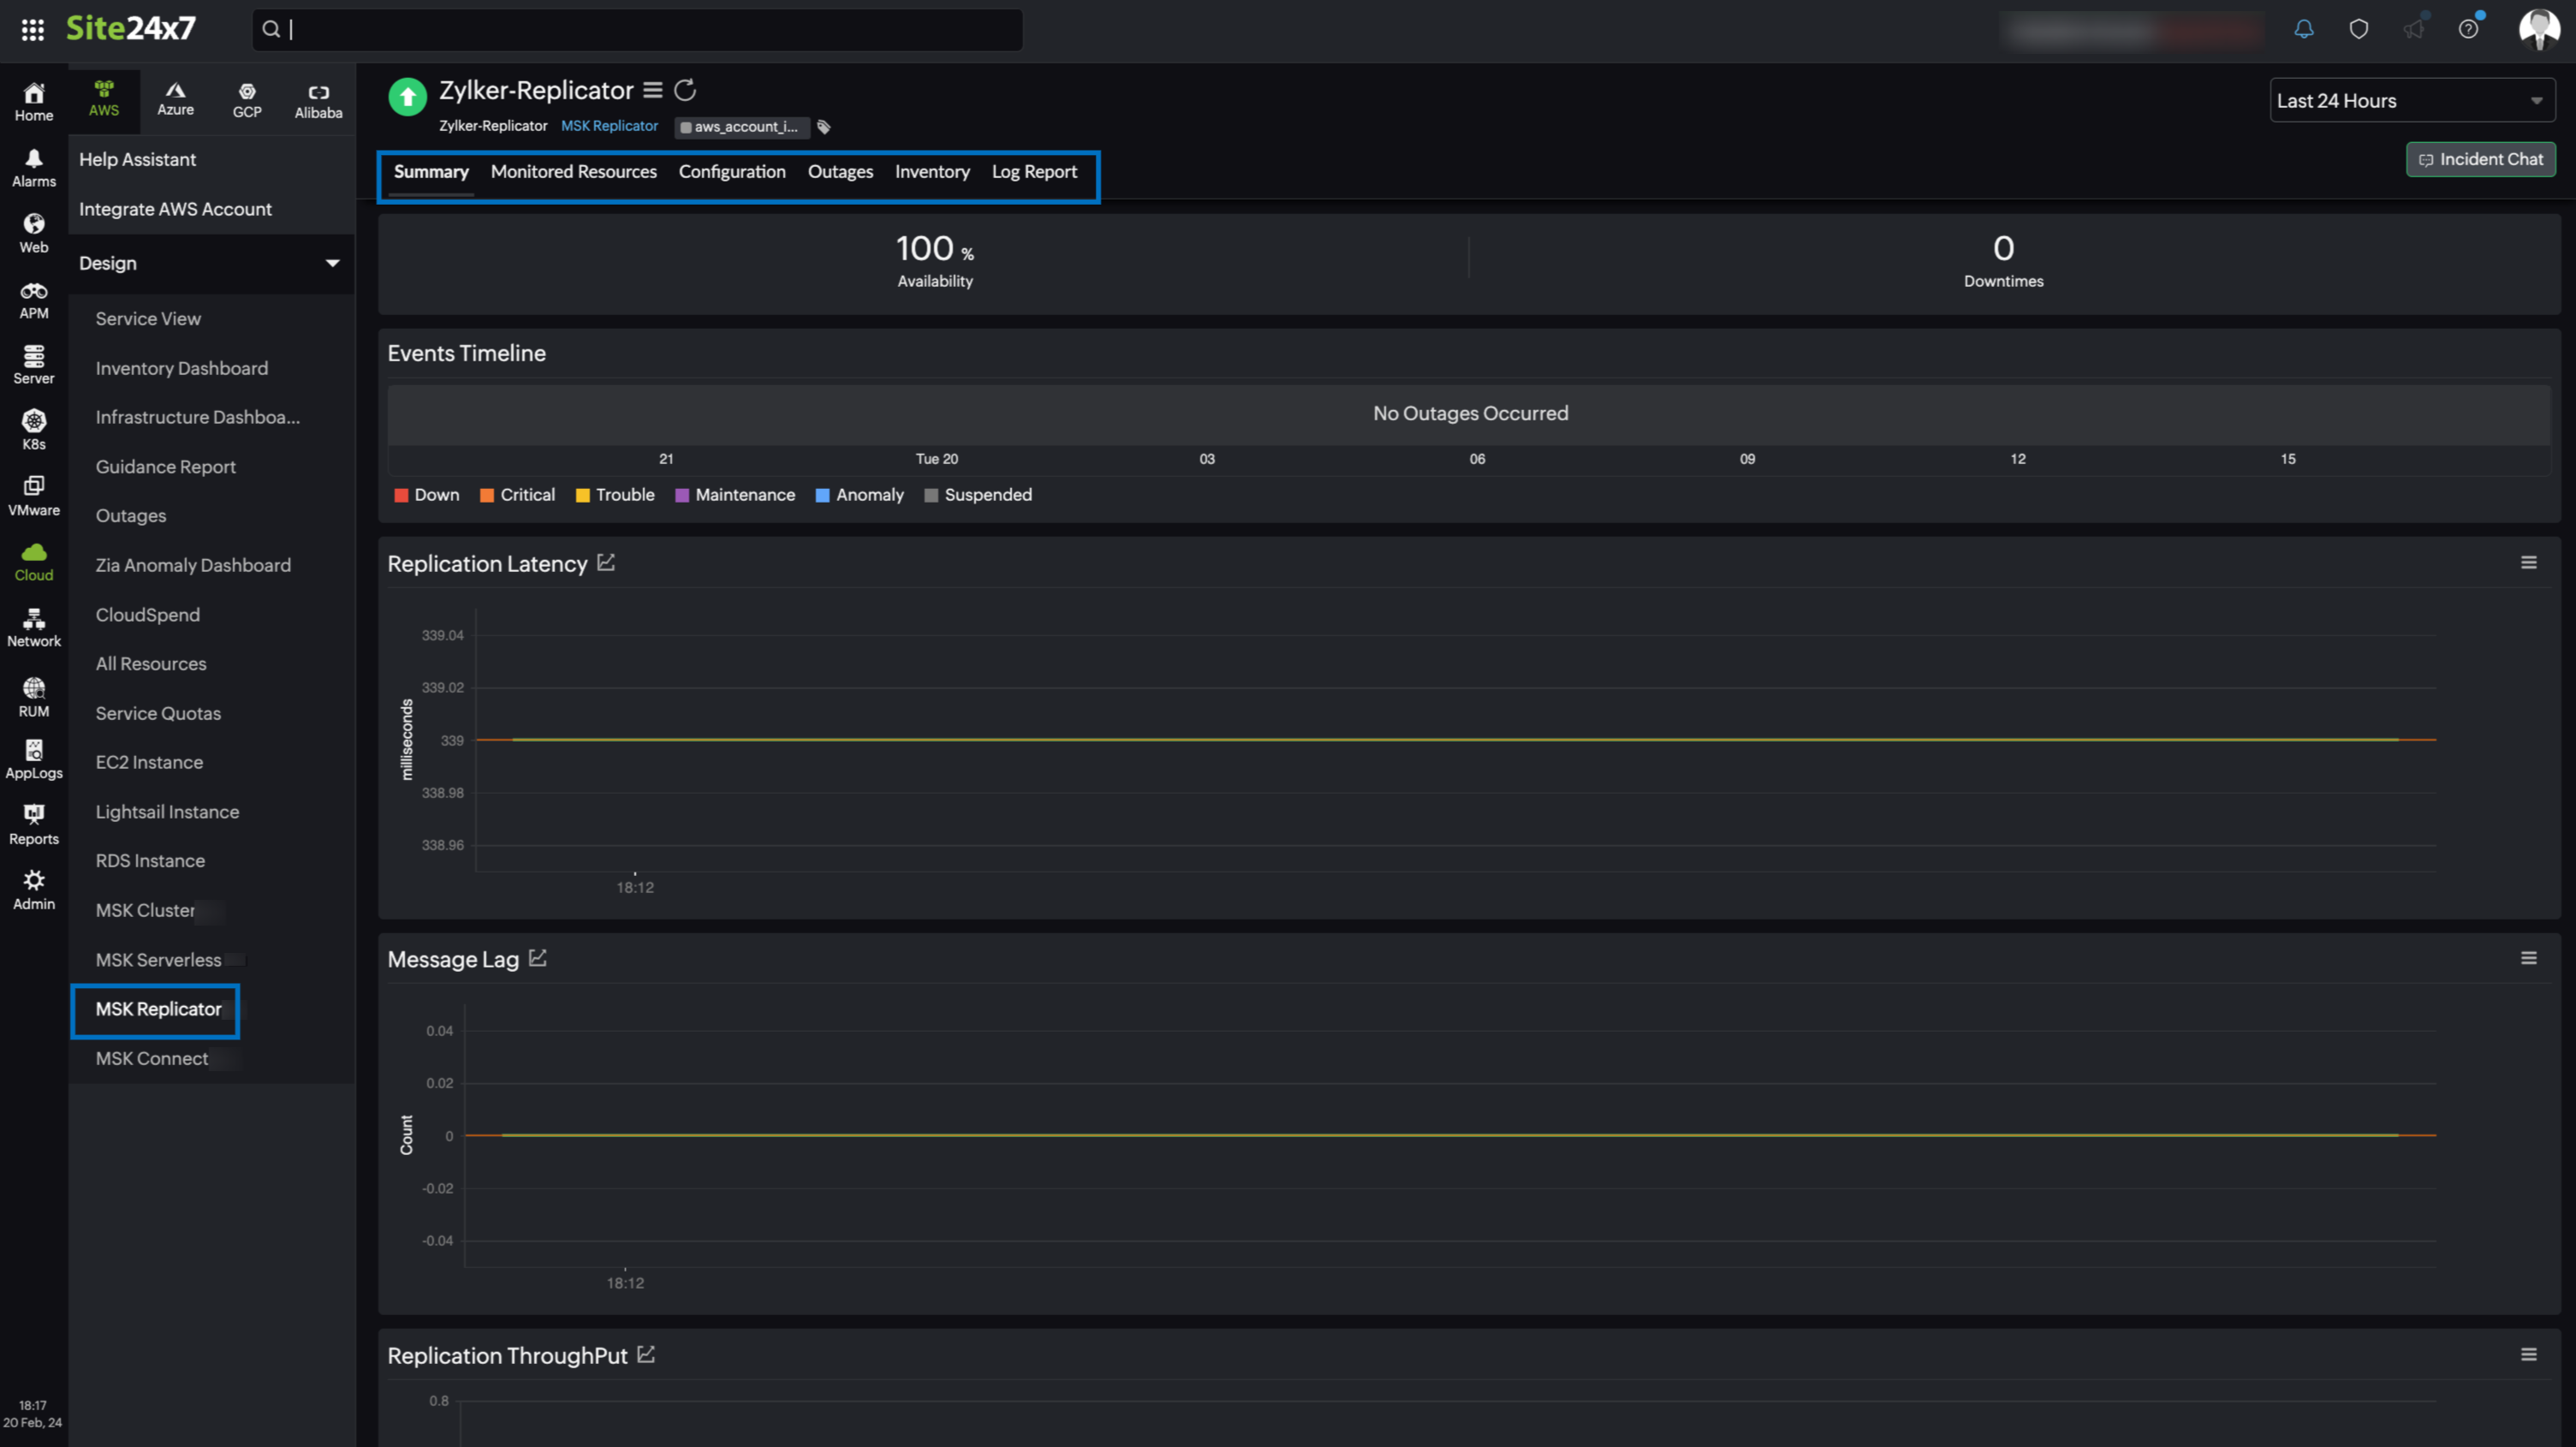
Summary
The Summary tab provides an overview of the events timeline and metrics in the form of charts.
Monitored Resources
The Monitored Resources tab in the MSK Replicator monitor provides the monitored resource details of the MSK clusters represented by the MSK Replicator monitor. Click the monitor display name to view the MSK monitor details.
Configuration
The Configuration tab summarizes essential details of your MSK Replicator, such as Replicator Name, Replicator ARN, Replicator State, and Replicator Version.
Outages
The Outages tab provides details on an outage's start time, end time, duration, and comments (if any).
Inventory
Obtain details like Replicator ID, Region, and Monitor Licensing Category from the Inventory tab. Set and view the Threshold and Availability Profile and the Notification Profile according to the user in this tab.
Log Report
This tab offers a consolidated report of the MSK Replicator monitor's log status, which can be downloaded as a CSV file.
MSK Connect
You can view your MSK Connect data on the following tabs.
Summary
The Summary tab provides an overview of the events timeline and metrics in the form of charts.
Outages
The Outages tab provides details on an outage's start time, end time, duration, and comments (if any).
Configuration
The Configuration tab summarizes essential details of your MSK cluster such as Connect Name, Connect ARN, Service Role ARN, and Current Version.
Inventory
Obtain details like Connect Name, Region, and Monitor Licensing Category from the Inventory tab. Set and view the Threshold and Availability Profile and the Notification Profile according to the user in this tab.
Log Report
This tab offers a consolidated report of the MSK Connect monitor's log status, which can be downloaded as a CSV file.
MSK Broker
You can view your MSK Broker data on the following tabs.
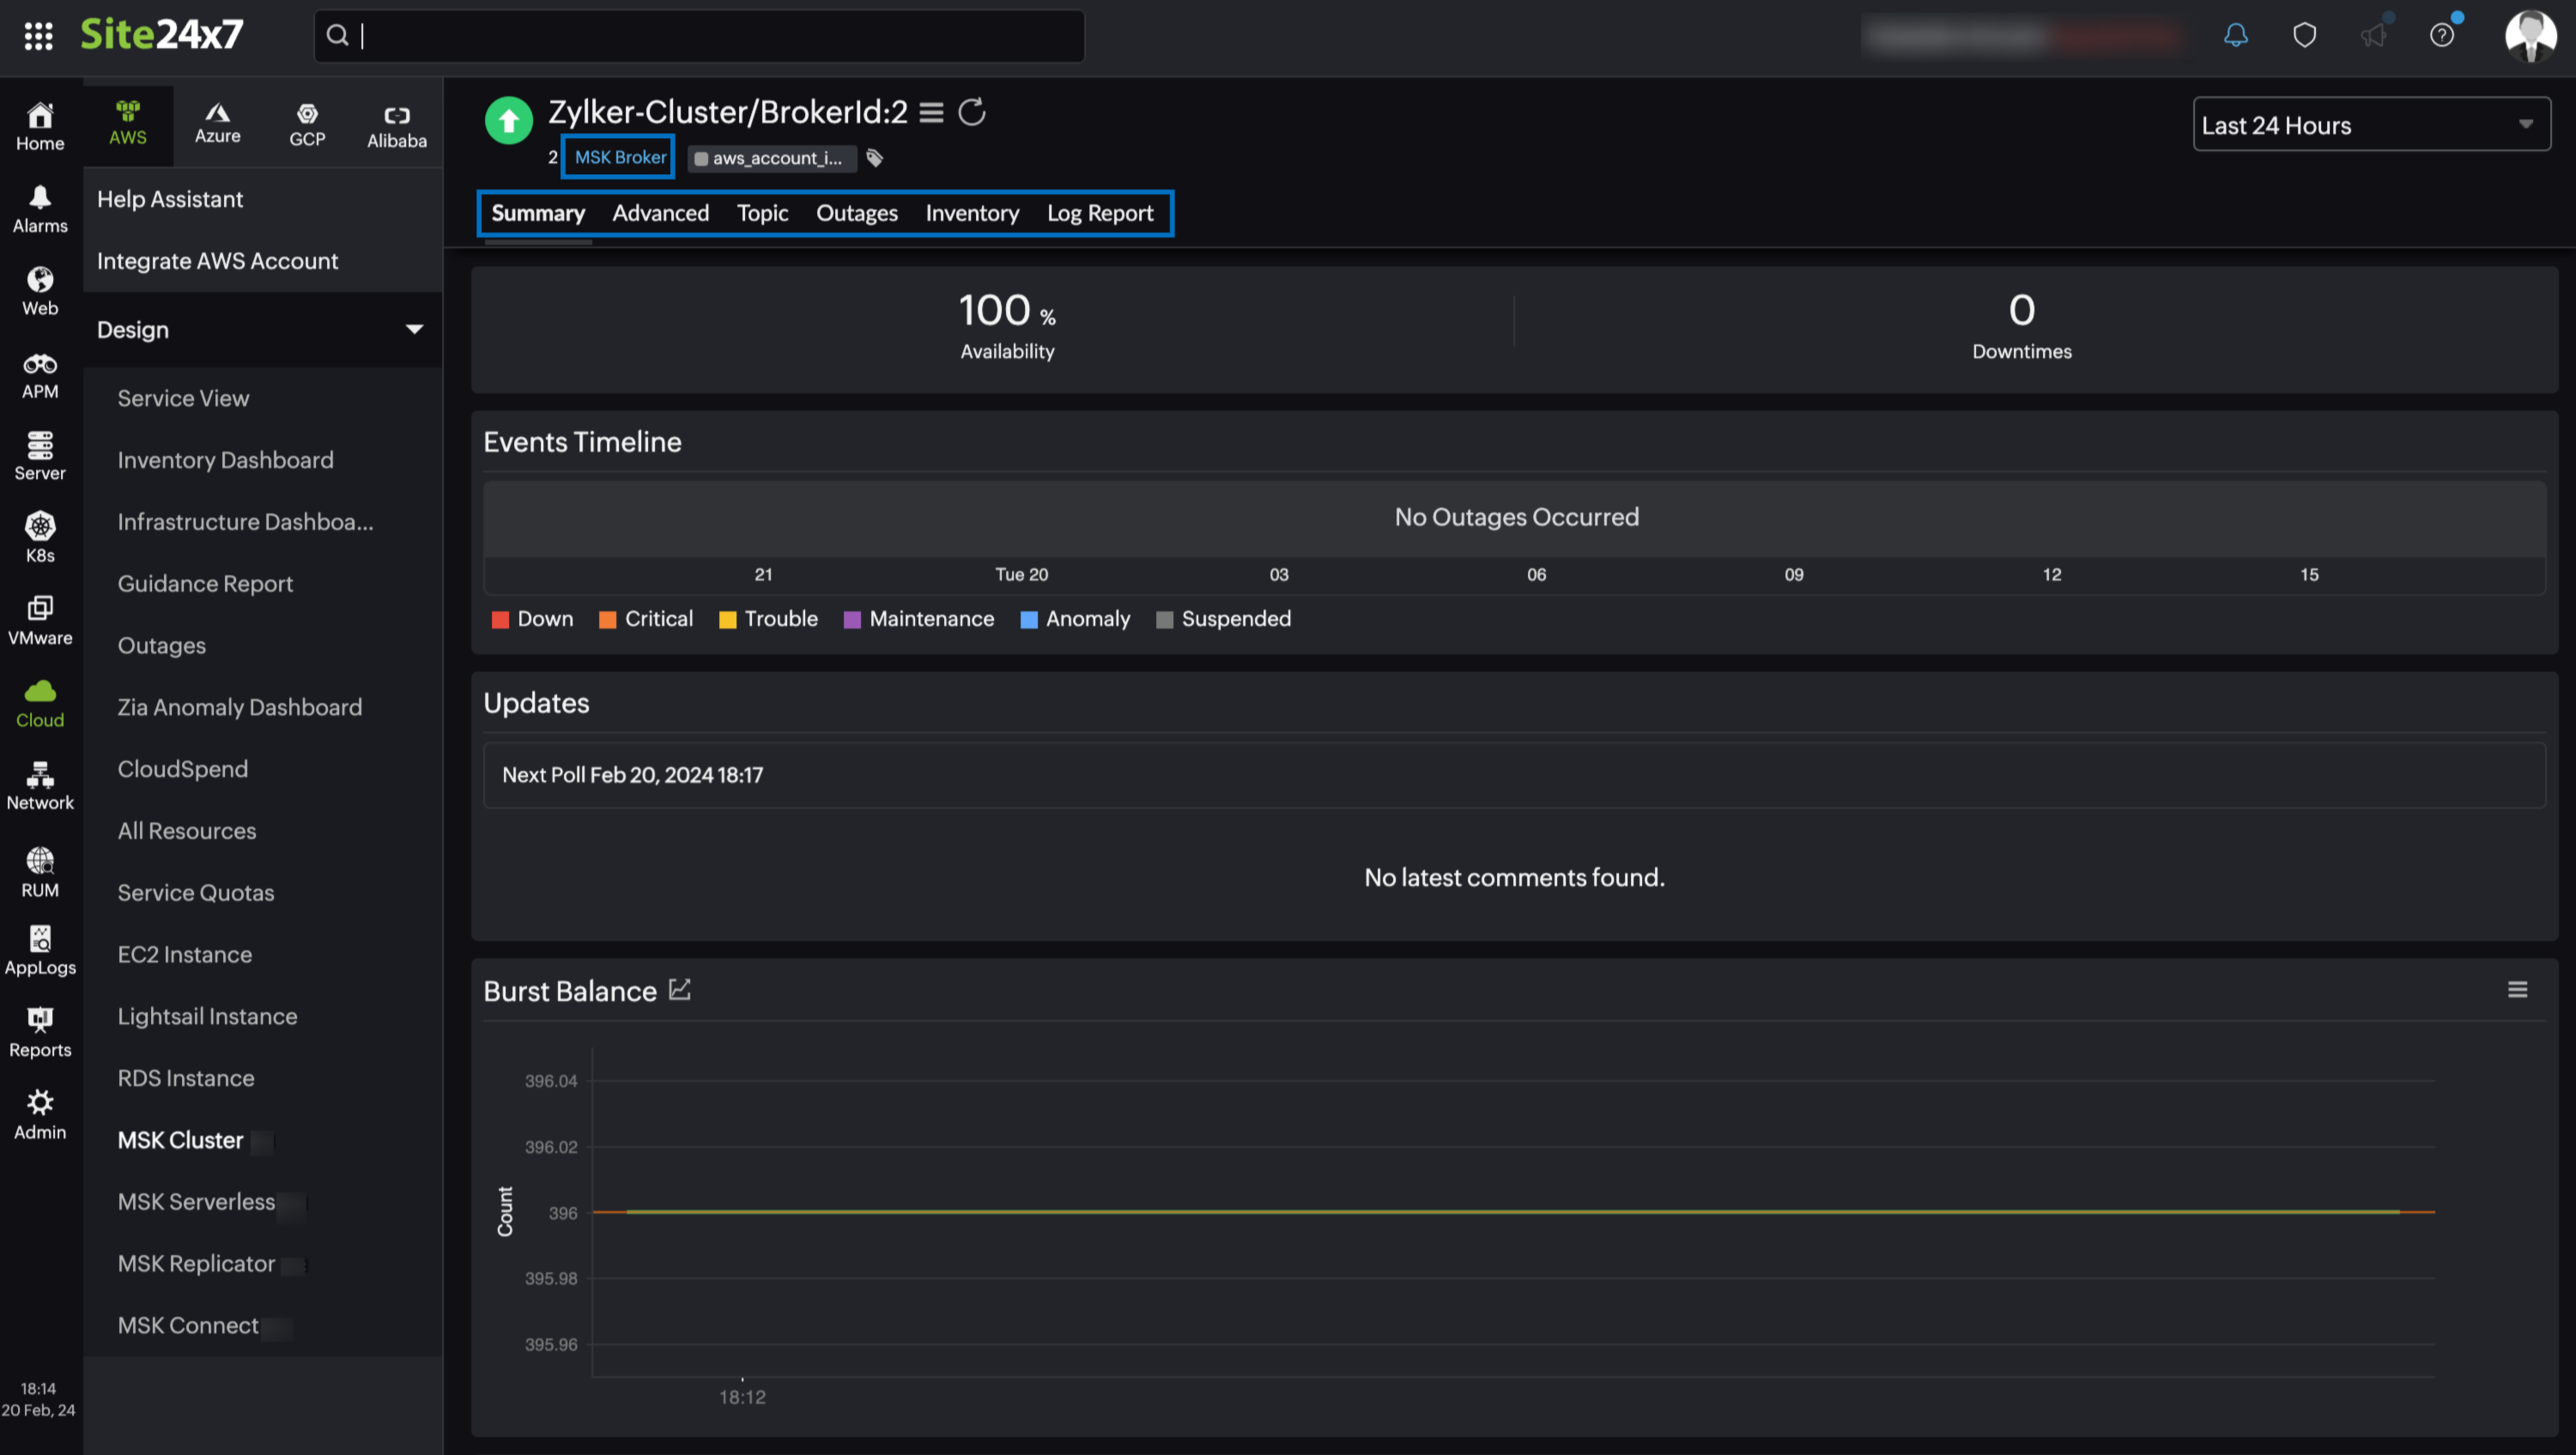
Summary
The Summary tab provides an overview of the events timeline and metrics in the form of charts.
Advanced
Site24x7 offers an advanced metrics tab for MSK Broker. The Advanced tab provides crucial insights into various metrics such as Network Traffic, CPU Utilization, Request Handling, and Replication, and more. This tab enables users to effectively monitor and optimize the performance of your MSK Broker.
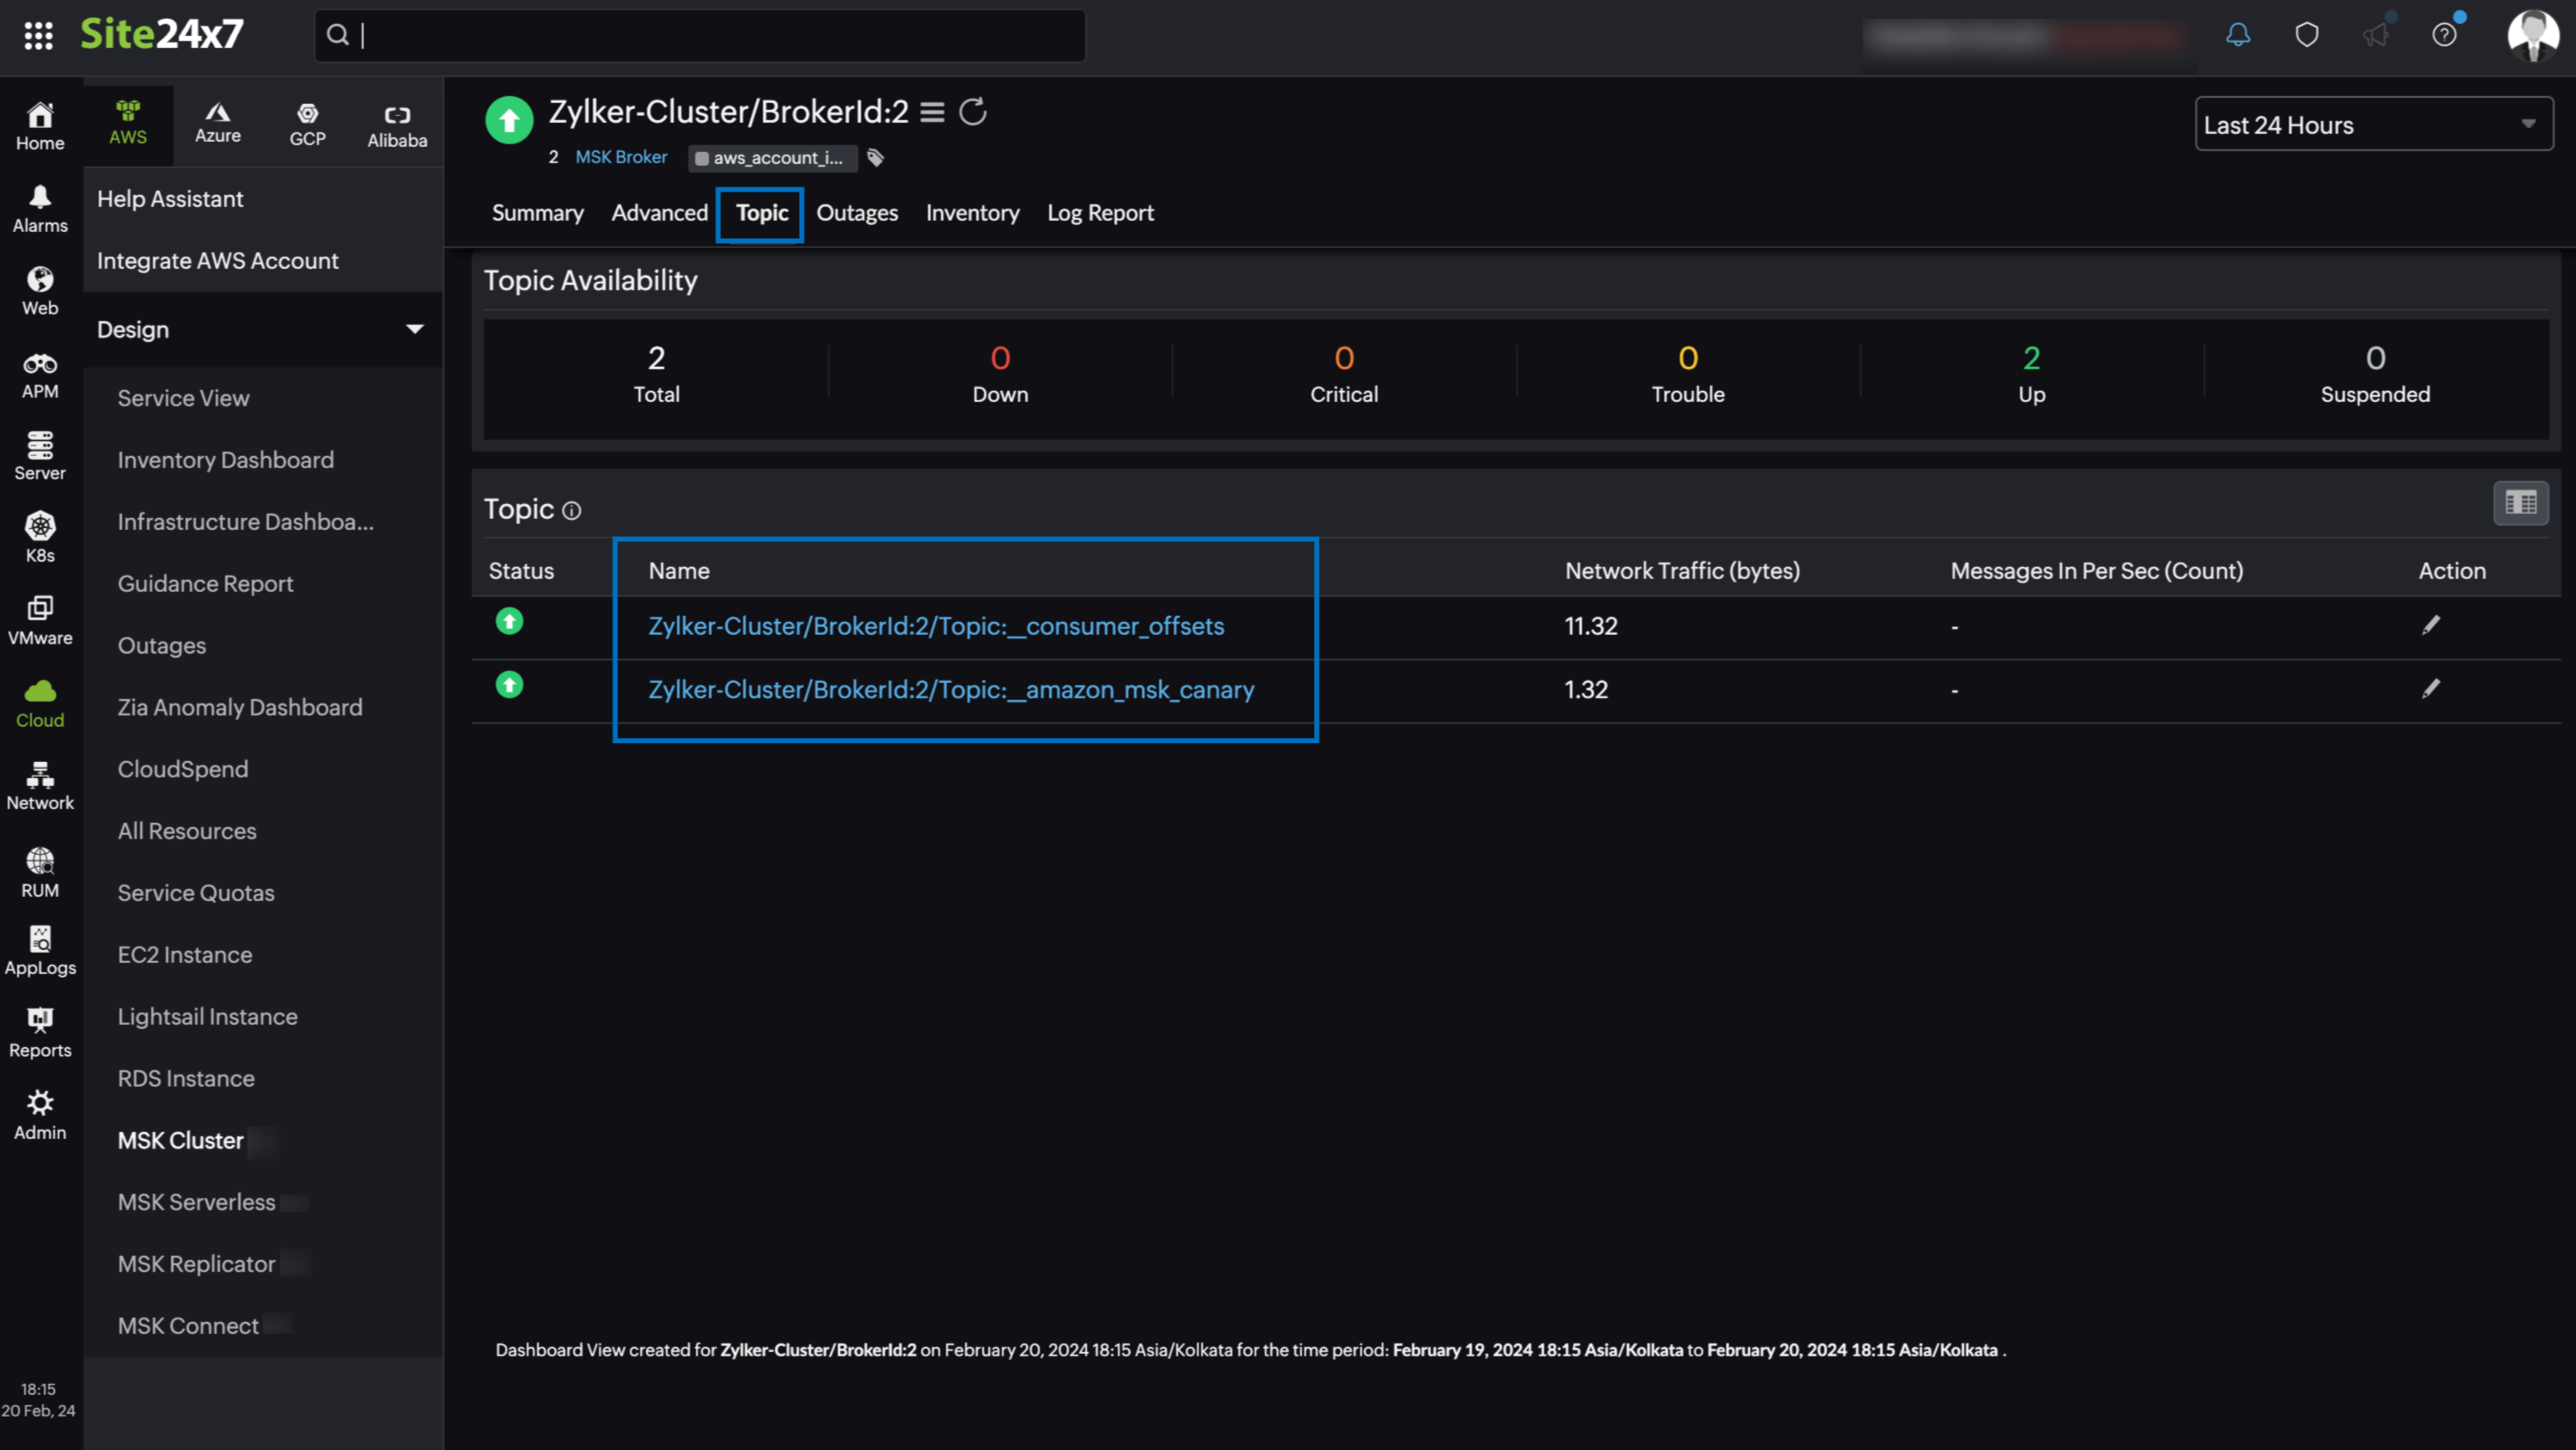
Topic
The Topic tab displays the Topic Availability and Topic instances associated with your cluster. Click the applicable Topic instance from the Topic list to view the monitor details.
Outages
The Outages tab provides details on an outage's start time, end time, duration, and comments (if any).
Inventory
Obtain details like Cluster Name, Broker ID, Region, and Monitor Licensing Category from the Inventory tab. Set and view the Threshold and Availability Profile and the Notification Profile in this tab.
Log Report
This tab offers a consolidated report of the MSK Broker monitor's log status, which can be downloaded as a CSV file.
MSK Topic
You can view your MSK Topic data on the following tabs.
Summary
The Summary tab offers a comprehensive overview of the events timeline and metrics, presenting insightful charts that shed light on the performance and behavior of MSK broker instances and topics within your Kafka environment.
Outages
The Outages tab provides details on an outage's start time, end time, duration, and comments (if any).
Inventory
Obtain details like Broker ID, Topic Name, Region, and Monitor Licensing Category from the Inventory tab. Set and view the Threshold and Availability Profile and the Notification Profile according to the user in this tab.
Log Report
This tab offers a consolidated report of the MSK Topic monitor's log status, which can be downloaded as a CSV file.
-
On this page
- Overview
- Use case
- Benefits of the Site24x7-Amazon MSK integration
- Setup and configuration
- Permissions
- Polling frequency
- Supported metrics
- MSK Cluster
- MSK Serverless
- MSK Replicator
- MSK Connect
- MSK Broker
- MSK Topic
- Threshold configuration
- Licensing
- Viewing Amazon MSK data
- Amazon MSK monitor data
- MSK Cluster
- MSK Serverless
- MSK Replicator
- MSK Connect
- MSK Broker
- MSK Topic