AWS Glue monitoring
AWS Glue is a serverless data integration service that makes it easy for analytics users to discover, prepare, move, and integrate data from multiple sources.
Overview
Site24x7 provides real-time monitoring capabilities, enabling you to track the performance and health of your Amazon Glue monitors. The integration provides you with the following two monitors:
Glue Job: Monitors your Extract, Transform, and Load (ETL) jobs and performance.
Glue Crawler: Provides critical insights about your crawler runs and crawler data source.
Use case
Consider that you have an AWS Glue service in which you scheduled or triggered glue jobs manually or in workflows. The job run might fail, time out, encounter an error, or end up in a waiting status causing unexpected issues.
By integrating your AWS Glue with Site24x7, you'll receive notifications for waiting, failed, timed-out, or errored job runs, enabling you to address issues and prevent recurring failures.
Benefits of the Site24x7-AWS Glue integration
Integrate your AWS Glue with Site24x7 to:
- Obtain critical insights about your ETL jobs and performance.
- Track the process of table addition, deletion and updation.
- Monitor your job runs, crawler runs, and crawler data source.
- Set thresholds for metrics and receive alerts (Down, Critical, Trouble) for threshold breaches.
- Schedule IT automation to start a job run or crawler run at any time.
Setup and configuration
- Log in to your Site24x7 account and create Site24x7 as an IAM user, or create a cross-account IAM role to enable access to your AWS resources for Site24x7.
- On the Integrate AWS Account page, select AWS Glue from the Services to be discovered list.
Permissions
Ensure that Site24x7 receives the following permissions to monitor Glue Job and Glue Crawler:
- glue:ListJobs
- glue:ListCrawlers
- glue:GetTriggers
- glue:GetJobRuns
- glue:ListCrawls
- glue:GetJobRun
- glue:GetCrawler
- glue:GetJob
- glue:GetTags
- glue:GetClassifier
- glue:GetConnection
- glue:GetCrawlerMetrics
- glue:GetCrawlers
- glue:GetJobs
- glue:GetClassifiers
Polling frequency
Site24x7 queries AWS service-level APIs per the set polling frequency (from once a minute to once a day) to collect metrics from the Glue Job and Glue Crawler monitors.
Supported metrics
The supported metrics for each AWS Glue monitor are given below.
Glue Job
The supported metrics for the Glue Job monitor are provided below:
| Metric name | Description | Statistics | Unit |
|---|---|---|---|
| Total Runs | The total number of job runs. | Sum | Count |
| Completed Runs | The number of completed job runs. | Sum | Count |
| Failed Runs | The number of failed job runs. | Sum | Count |
| Canceled Runs | The number of canceled job runs. | Sum | Count |
| Error Runs | The number of error job runs. | Sum | Count |
| Timeout Runs | The number of timeout job runs. | Sum | Count |
| Waiting Runs | The number of job runs in waiting status. | Sum | Count |
| Completed Runs Percentage | The percentage of completed job runs. | Average | Percentage |
| Failed Runs Percentage | The percentage of failed job runs. | Average | Percentage |
| Canceled Runs Percentage | The percentage of canceled job runs. | Average | Percentage |
| Error Runs Percentage | The percentage of error job runs. | Average | Percentage |
| Timeout Runs Percentage | The percentage of timeout job runs. | Average | Percentage |
| Waiting Runs Percentage | The percentage of job runs in waiting status. | Average | Percentage |
The metrics for Spark, Spark Streaming, and Python Shell job types shown below will be monitored only if the Advanced properties > Job metrics option in the Job details tab, is enabled in the AWS Glue console.
| Metric name | Description | Statistics | Unit |
|---|---|---|---|
| CPU Load Usage | The fraction of CPU system load used by the driver. | Average | Percentage |
| Bytes Read | The number of bytes read from all data sources by all completed Spark tasks running in all executors. | Sum | Bytes |
| Records Read | The number of records read from all data sources. | Sum | Count |
| Read From S3 | The number of bytes read from Amazon S3 by all executors. | Sum | Bytes |
| Write into S3 | The number of bytes written to Amazon S3 by all executors. | Sum | Bytes |
| Shuffle Bytes Read | The number of bytes read by all executors to shuffle data between them. | Sum | Bytes |
| Shuffle Bytes Written | The number of bytes written by all executors to shuffle data between them. | Sum | Bytes |
| Memory Used by Driver | The number of memory bytes used by the Java Virtual Machine (JVM) heap for the driver. | Average | Bytes |
| Memory Used by Executor | The number of memory bytes used by the JVM heap for all executors. | Average | Bytes |
| Disk Used | The number of megabytes of disk space used across all executors. | Average | Megabytes |
| ETL Elapsed Time | The ETL elapsed time in milliseconds (does not include the job bootstrap times). | Sum | Milliseconds |
| Completed Tasks | The number of completed tasks in the job. | Sum | Count |
| Failed Tasks | The number of failed tasks in the job. | Sum | Count |
| Killed Tasks | The number of tasks killed in the job. | Sum | Count |
| Completed Stages | The number of completed stages in the job. | Sum | Count |
The metrics shown below are for the Spark Streaming job type only. These will be monitored only if the Advanced properties > Job metrics option in the Job details tab, is enabled in the AWS Glue console.
| Metric name | Description | Statistics | Unit |
|---|---|---|---|
| Records Received in Streaming Batch | The number of records that are received in a micro-batch | Sum | Count |
| Batch Processing Time | The batch processing time metric helps you determine if the cluster is underprovisioned or overprovisioned. | Sum | Milliseconds |
| Input Records Per Second | The rate at which input records are received. | Sum | Count |
| Processing Records Per Second | The rate at which records are being processed. | Sum | Count |
| All Executors | Number of actively running job executors | Average | Count |
| Maximum Executors | Number of maximum (actively running and pending) job executors needed to satisfy the current load. | Average | Count |
The Glue Observability metrics below for Spark, Spark Streaming, and Python Shell job types will be monitored, only if the Advanced properties > Job observability metrics option in the Job details tab, is enabled in the AWS Glue console.
| Metric name | Description | Statistics | Unit |
|---|---|---|---|
| Job Skewness | The weighted average of the job stage skewness. | Average | Count |
| Worker Utilization | The percentage of the allocated workers who are actually used. | Average | Percentage |
| Driver Disk Used | The percentage of disk space used by the driver. | Average | Percentage |
| Executor Disk Used | The percentage of disk space used by the executor. | Average | Percentage |
Glue Crawler
The supported metrics for the Glue Crawler monitor are provided below:
| Metric name | Description | Statistics | Unit |
|---|---|---|---|
| Tables Created | The number of tables created. | Average | Count |
| Tables Updated | The number of tables updated. | Average | Count |
| Tables Deleted | The number of tables deleted. | Average | Count |
| Time Left Seconds | The estimated time left to complete a running crawl. | Sum | Seconds |
| Last Runtime Seconds | The duration of the most recent crawler run. | Sum | Seconds |
| Median Runtime Seconds | The median runtime duration of all crawler runs. | Sum | Seconds |
| Total Runs | The total number of crawler runs. | Sum | Count |
| Completed Runs | The number of completed crawler runs. | Sum | Count |
| Failed Runs | The number of failed crawler runs. | Sum | Count |
| Canceled Runs | The number of canceled crawler runs. | Sum | Count |
| Completed Runs Percentage | The percentage of completed crawler runs. | Average | Percentage |
| Failed Runs Percentage | The percentage of failed crawler runs. | Average | Percentage |
| Canceled Runs Percentage | The percentage of canceled crawler runs. | Average | Percentage |
Threshold configuration
To configure thresholds for AWS Glue monitors:
- Log in to your Site24x7 account and navigate to Admin > Configuration Profiles > Threshold and Availability.
- Click Add Threshold Profile.
- Select the applicable monitor type from theMonitor Type drop-down menu and provide an appropriate name in the Display Name field. The applicable monitor types are Glue Job and Glue Crawler.
- The supported metrics are displayed in theThreshold Configuration section. You can set threshold values for all the metrics mentioned above.
- Click Save.
Licensing
- Glue Job: Each Glue Job monitor is considered a basic monitor.
- Glue Crawler: Each Glue Crawler monitor is considered a basic monitor.
IT Automation
You can add automations to perform Glue Job and Glue Crawler runs. Go to Admin > IT Automation Templates (+) > Add Automation Templates. Once automations are added, you can schedule them to be executed one after the other.
Viewing AWS Glue data
To view AWS Glue Job data:
- From the Site24x7 console, navigate to Cloud > AWS > Glue Job.
To view AWS Glue Crawler data:
- From the Site24x7 console, navigate to Cloud > AWS > Glue Crawler.
AWS Glue monitor data
The monitor data for each AWS Glue monitor is given below.
Glue Job monitor data
You can view your Glue Job data on the following tabs.
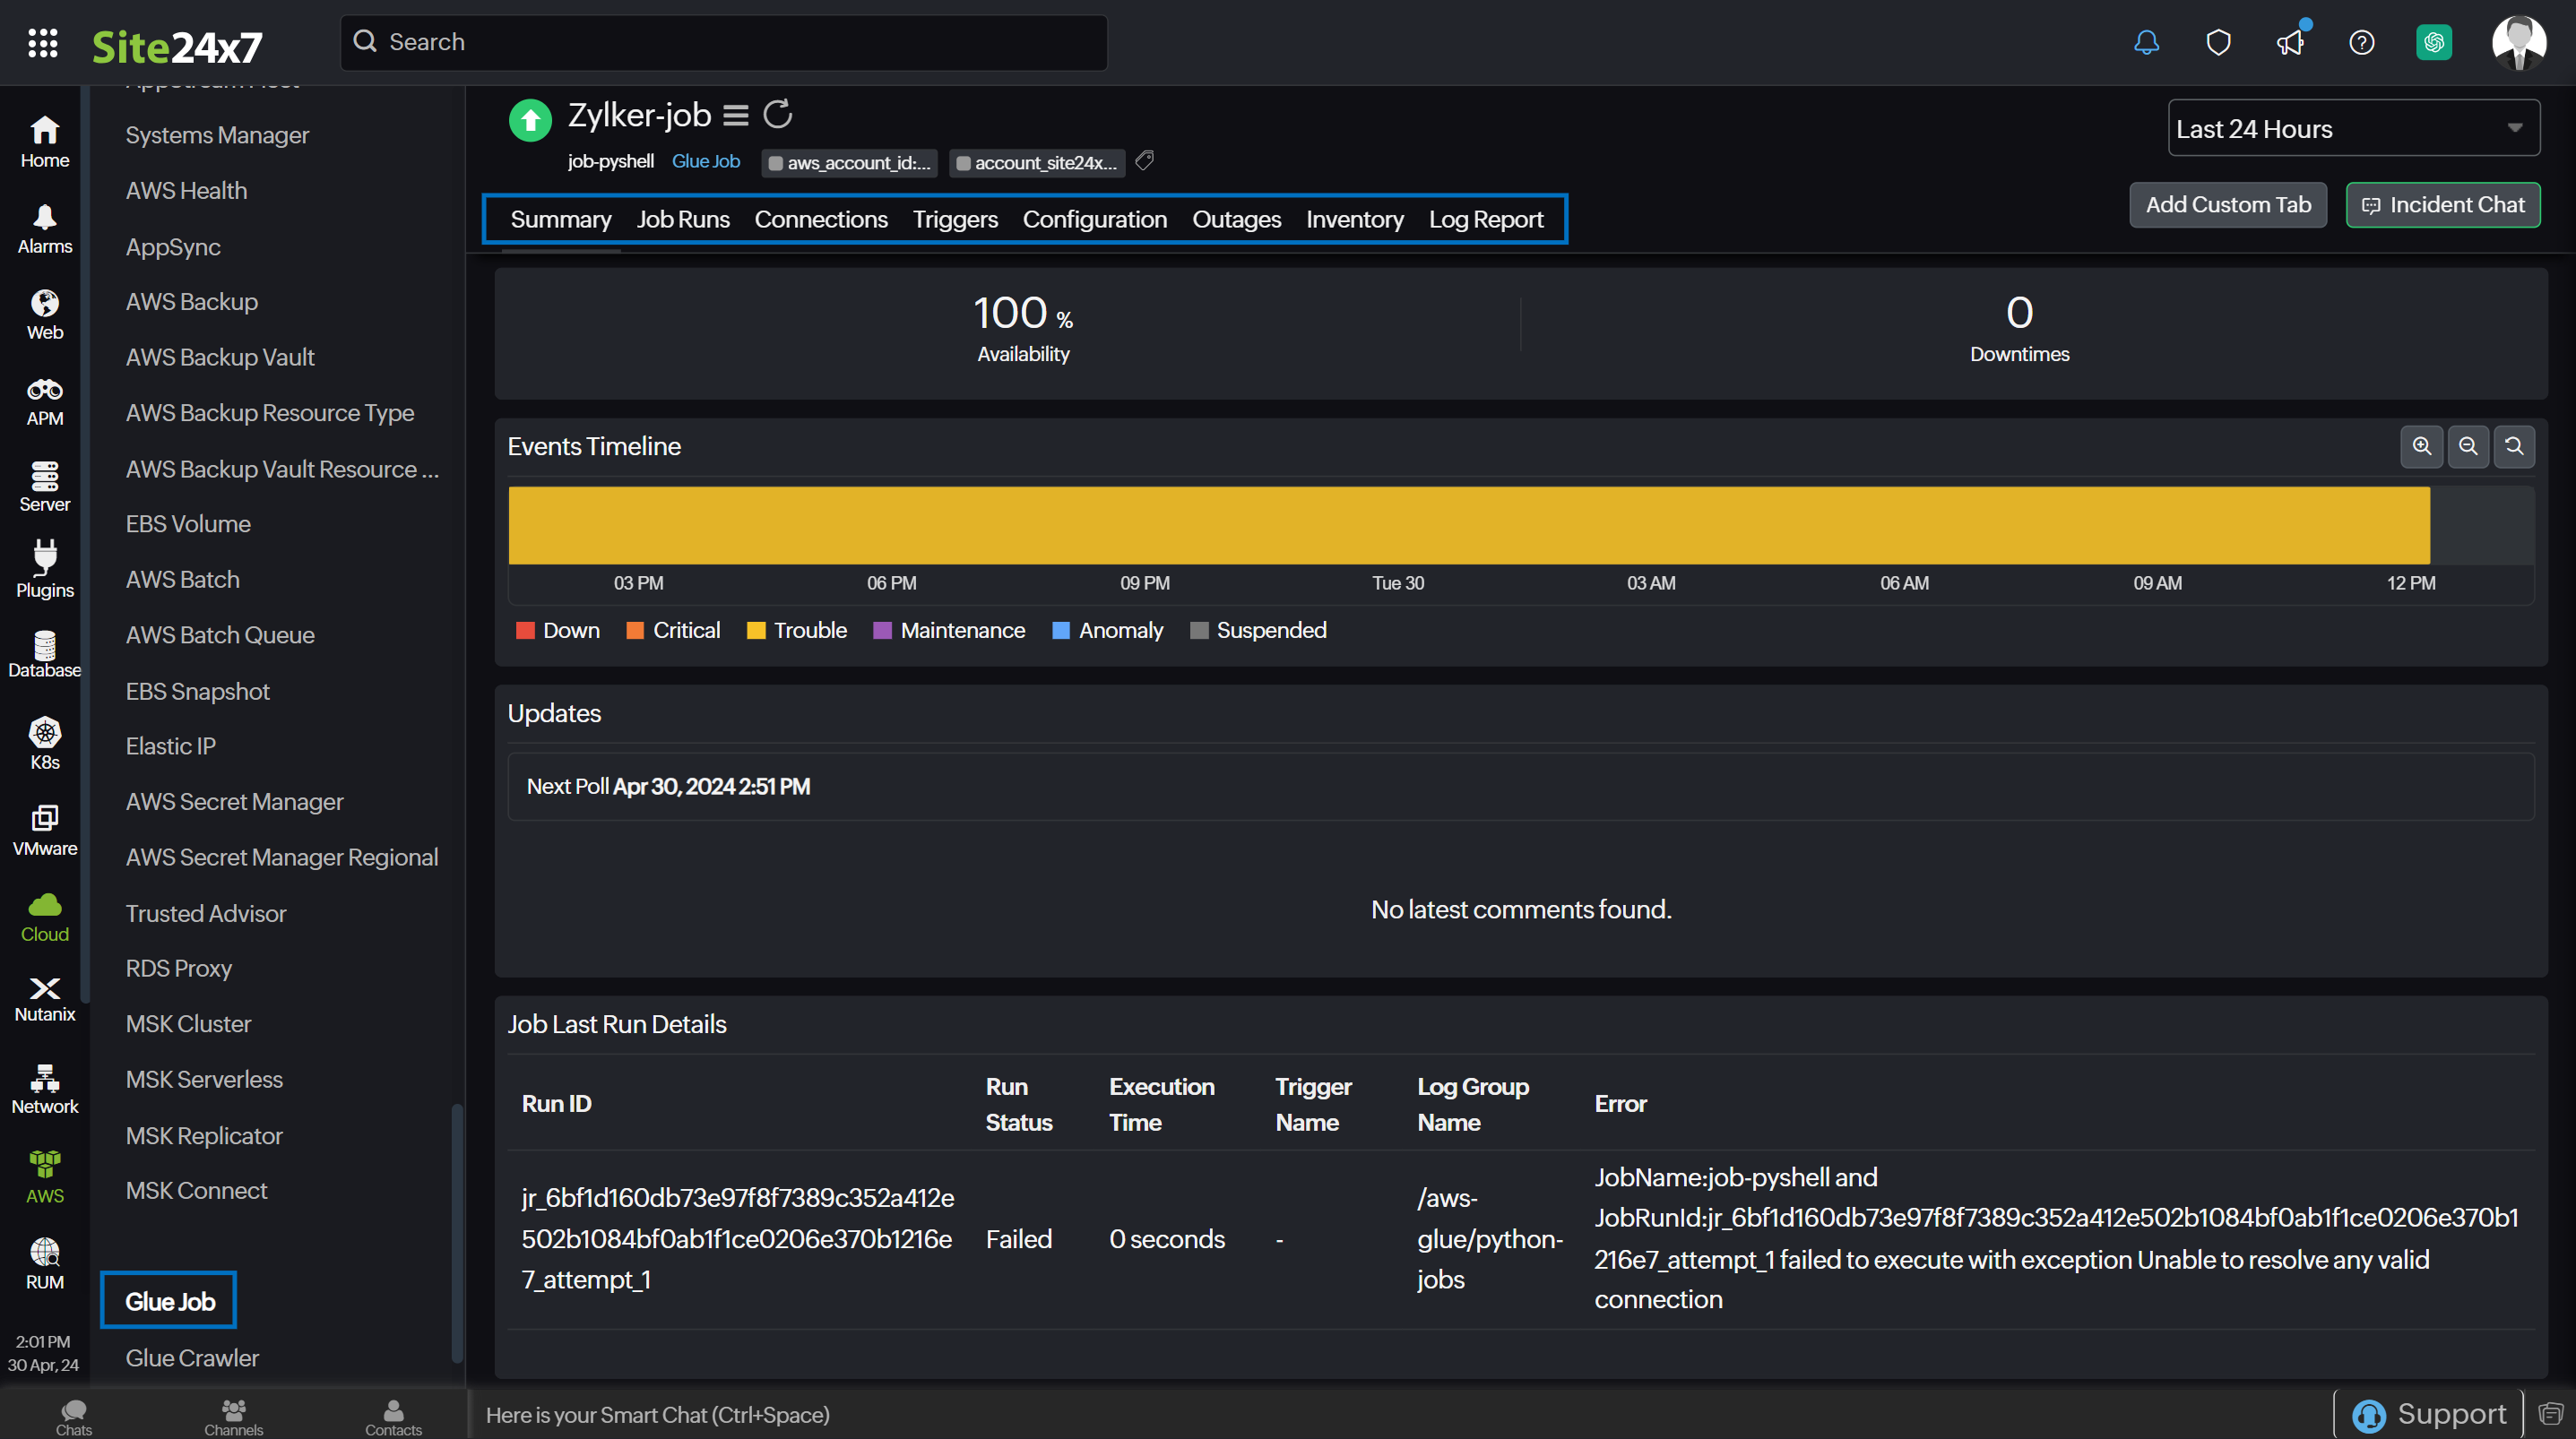
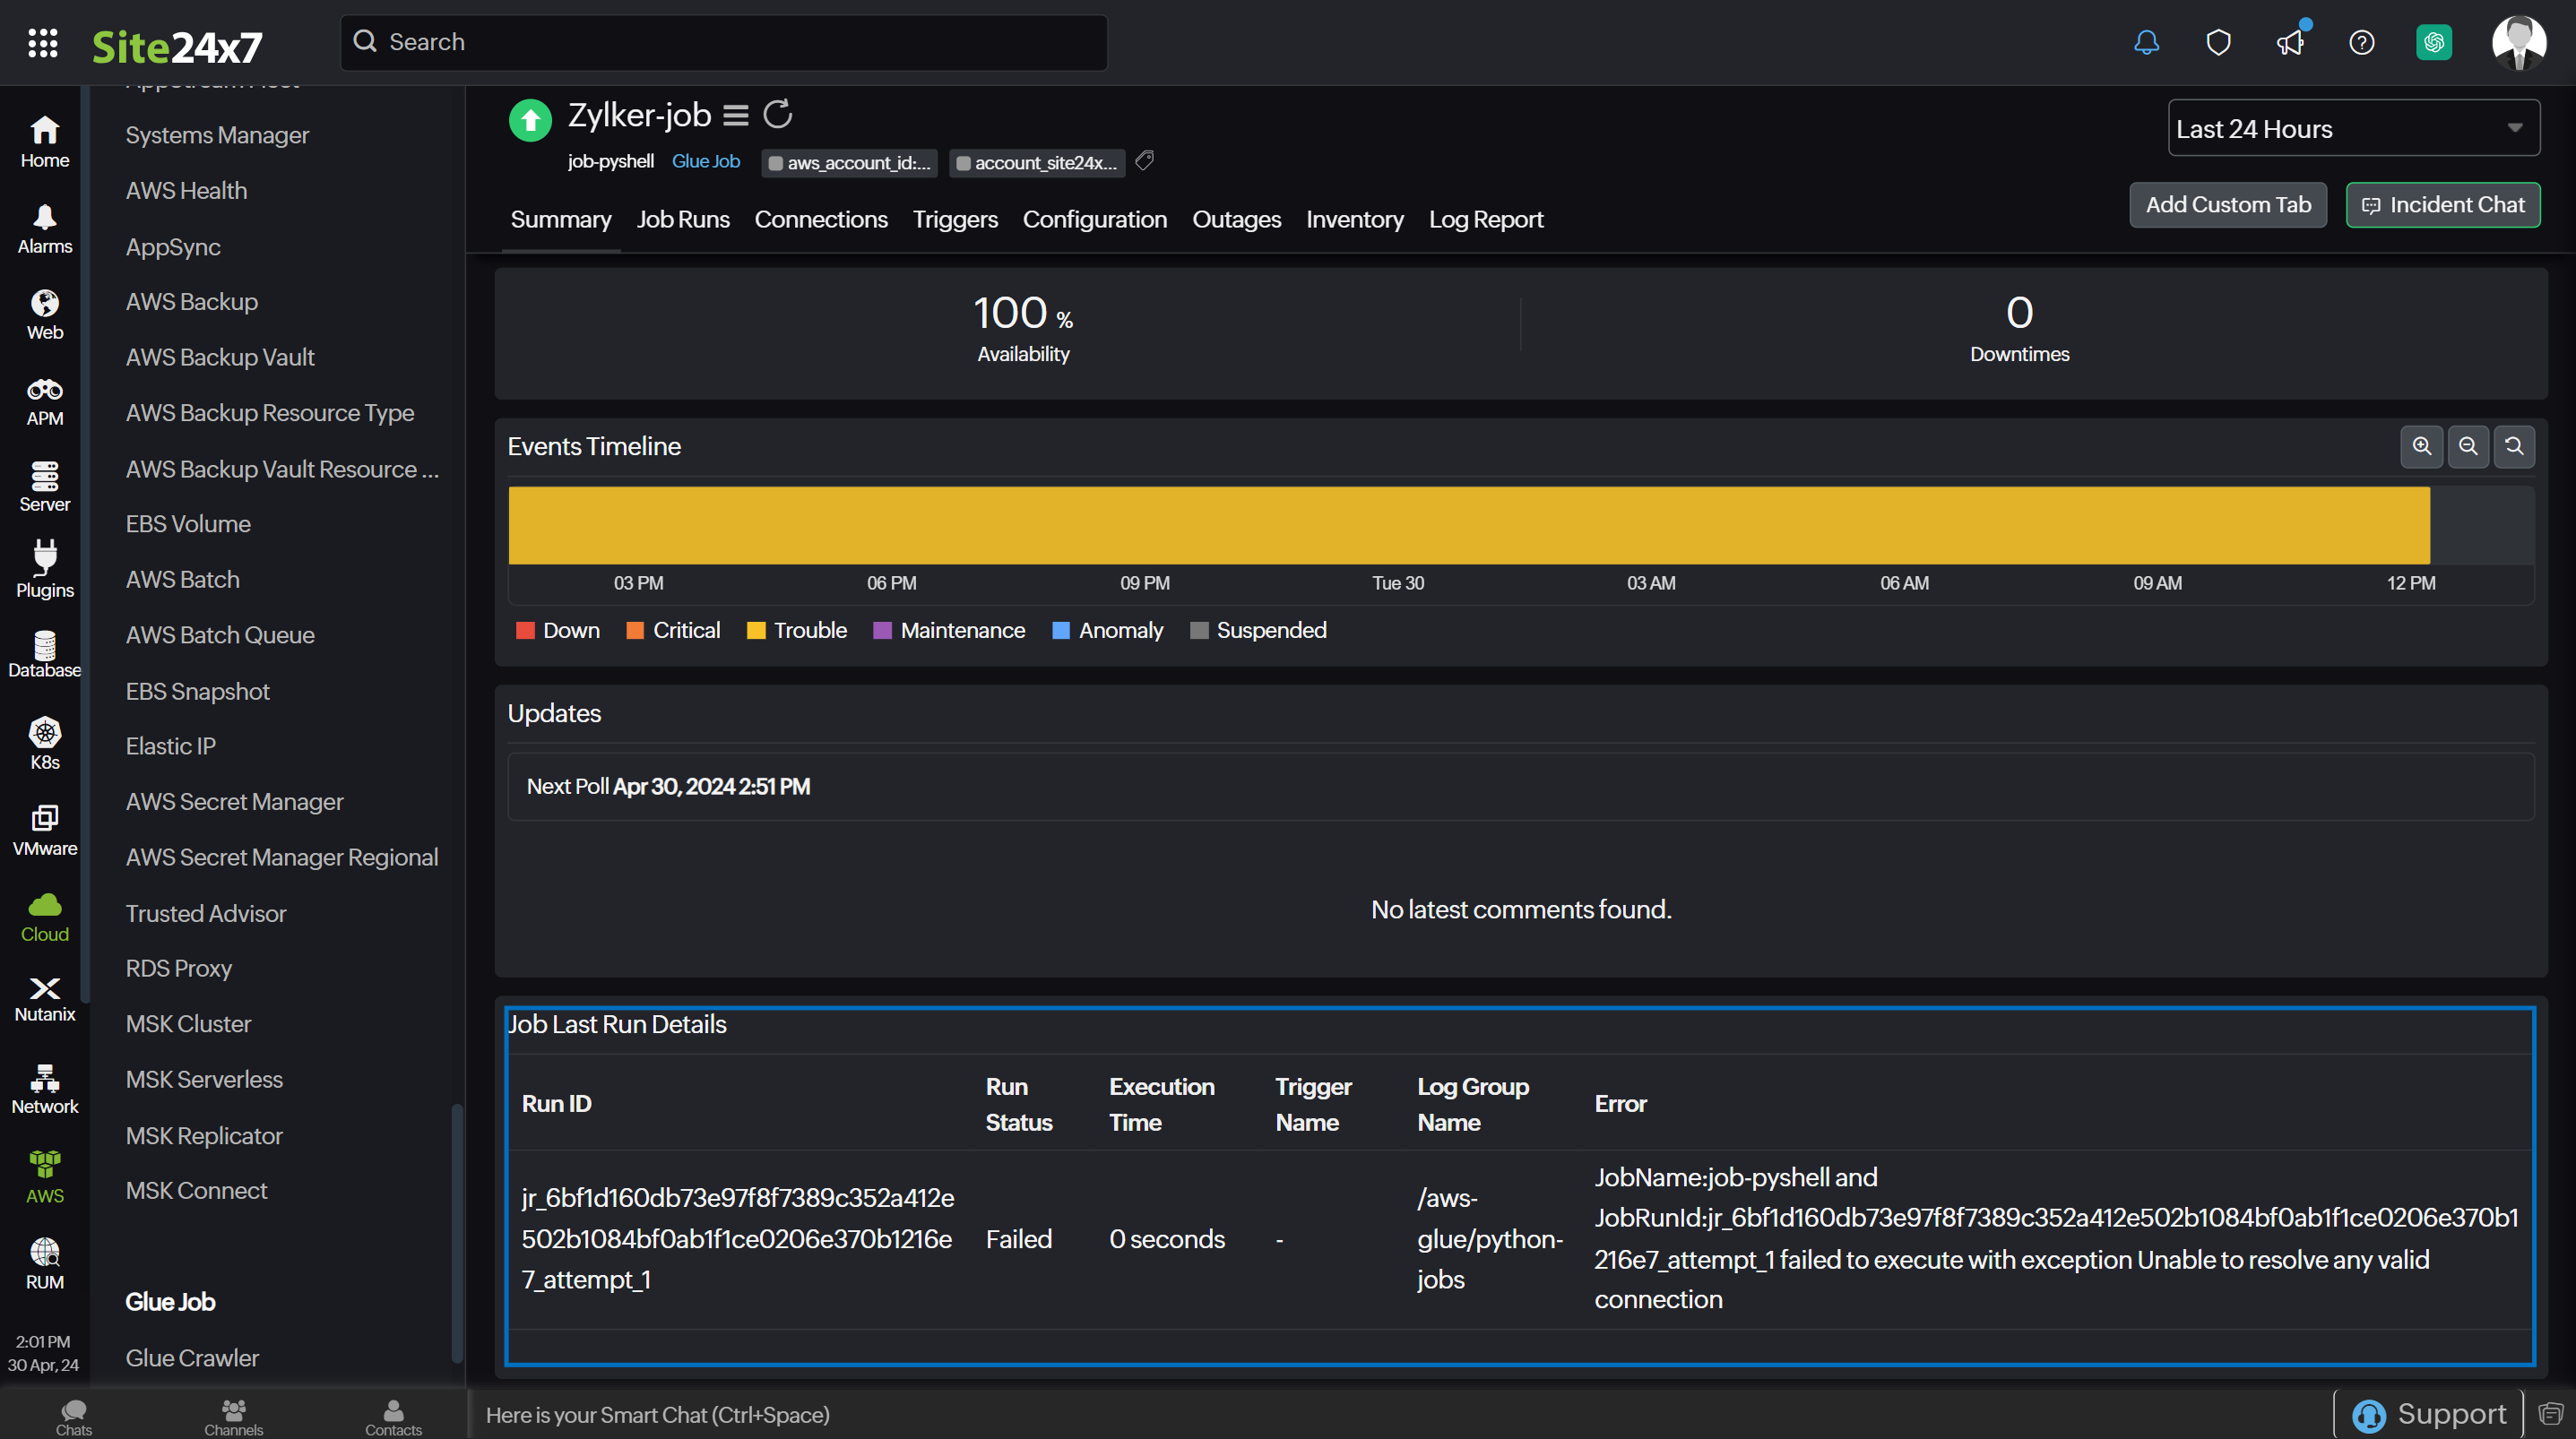
Summary
The Summary tab provides a comprehensive overview of the events timeline and metrics in the form of charts. You can view the Glue Job performance details as well the last job run details in this tab.
Job Runs
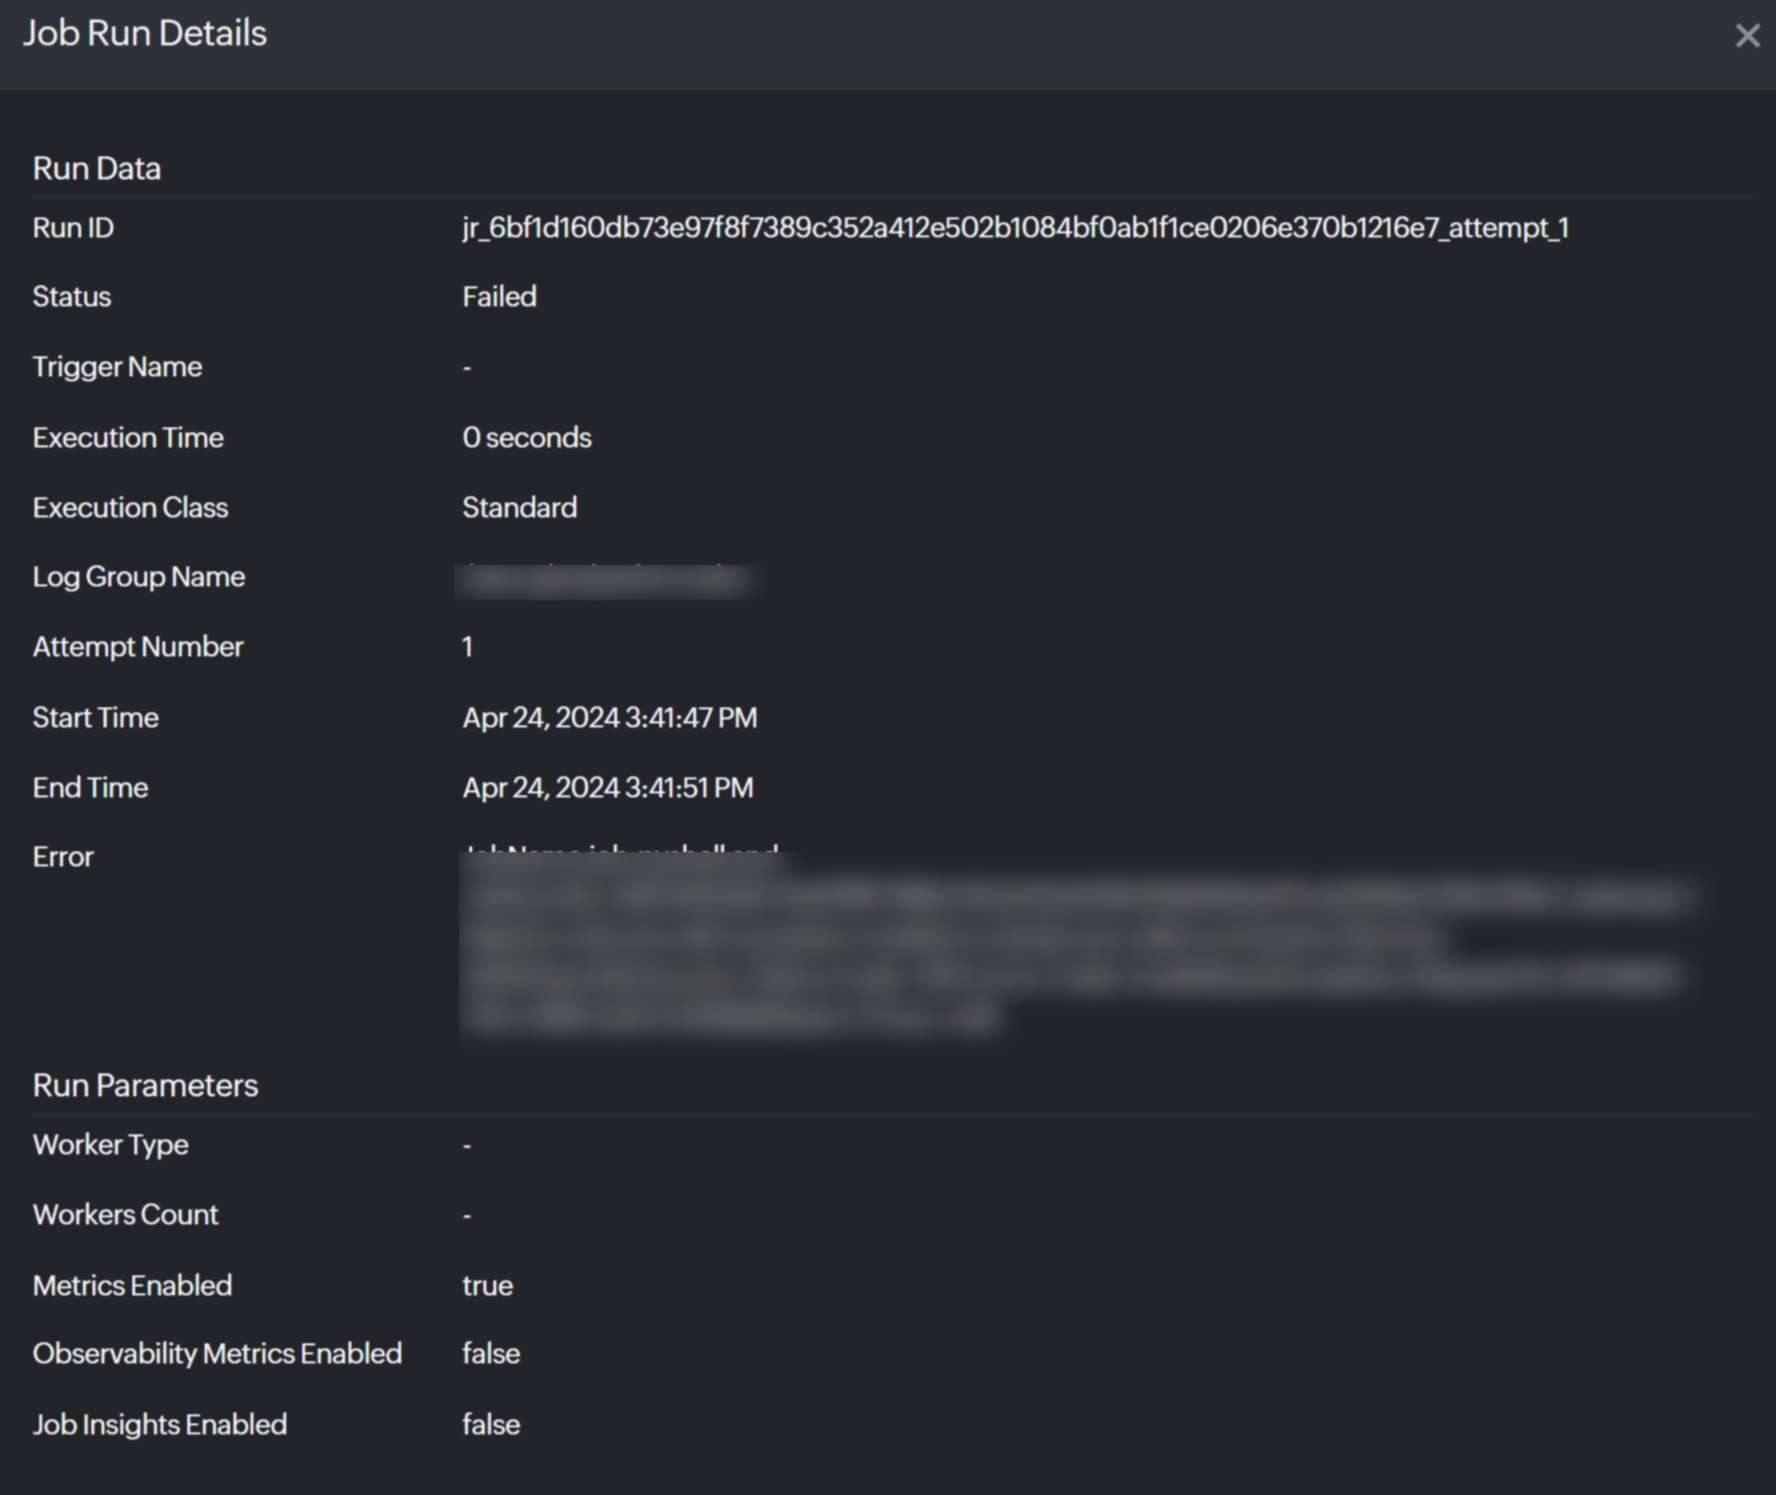
The Job Runs tab provides details of all the job runs.
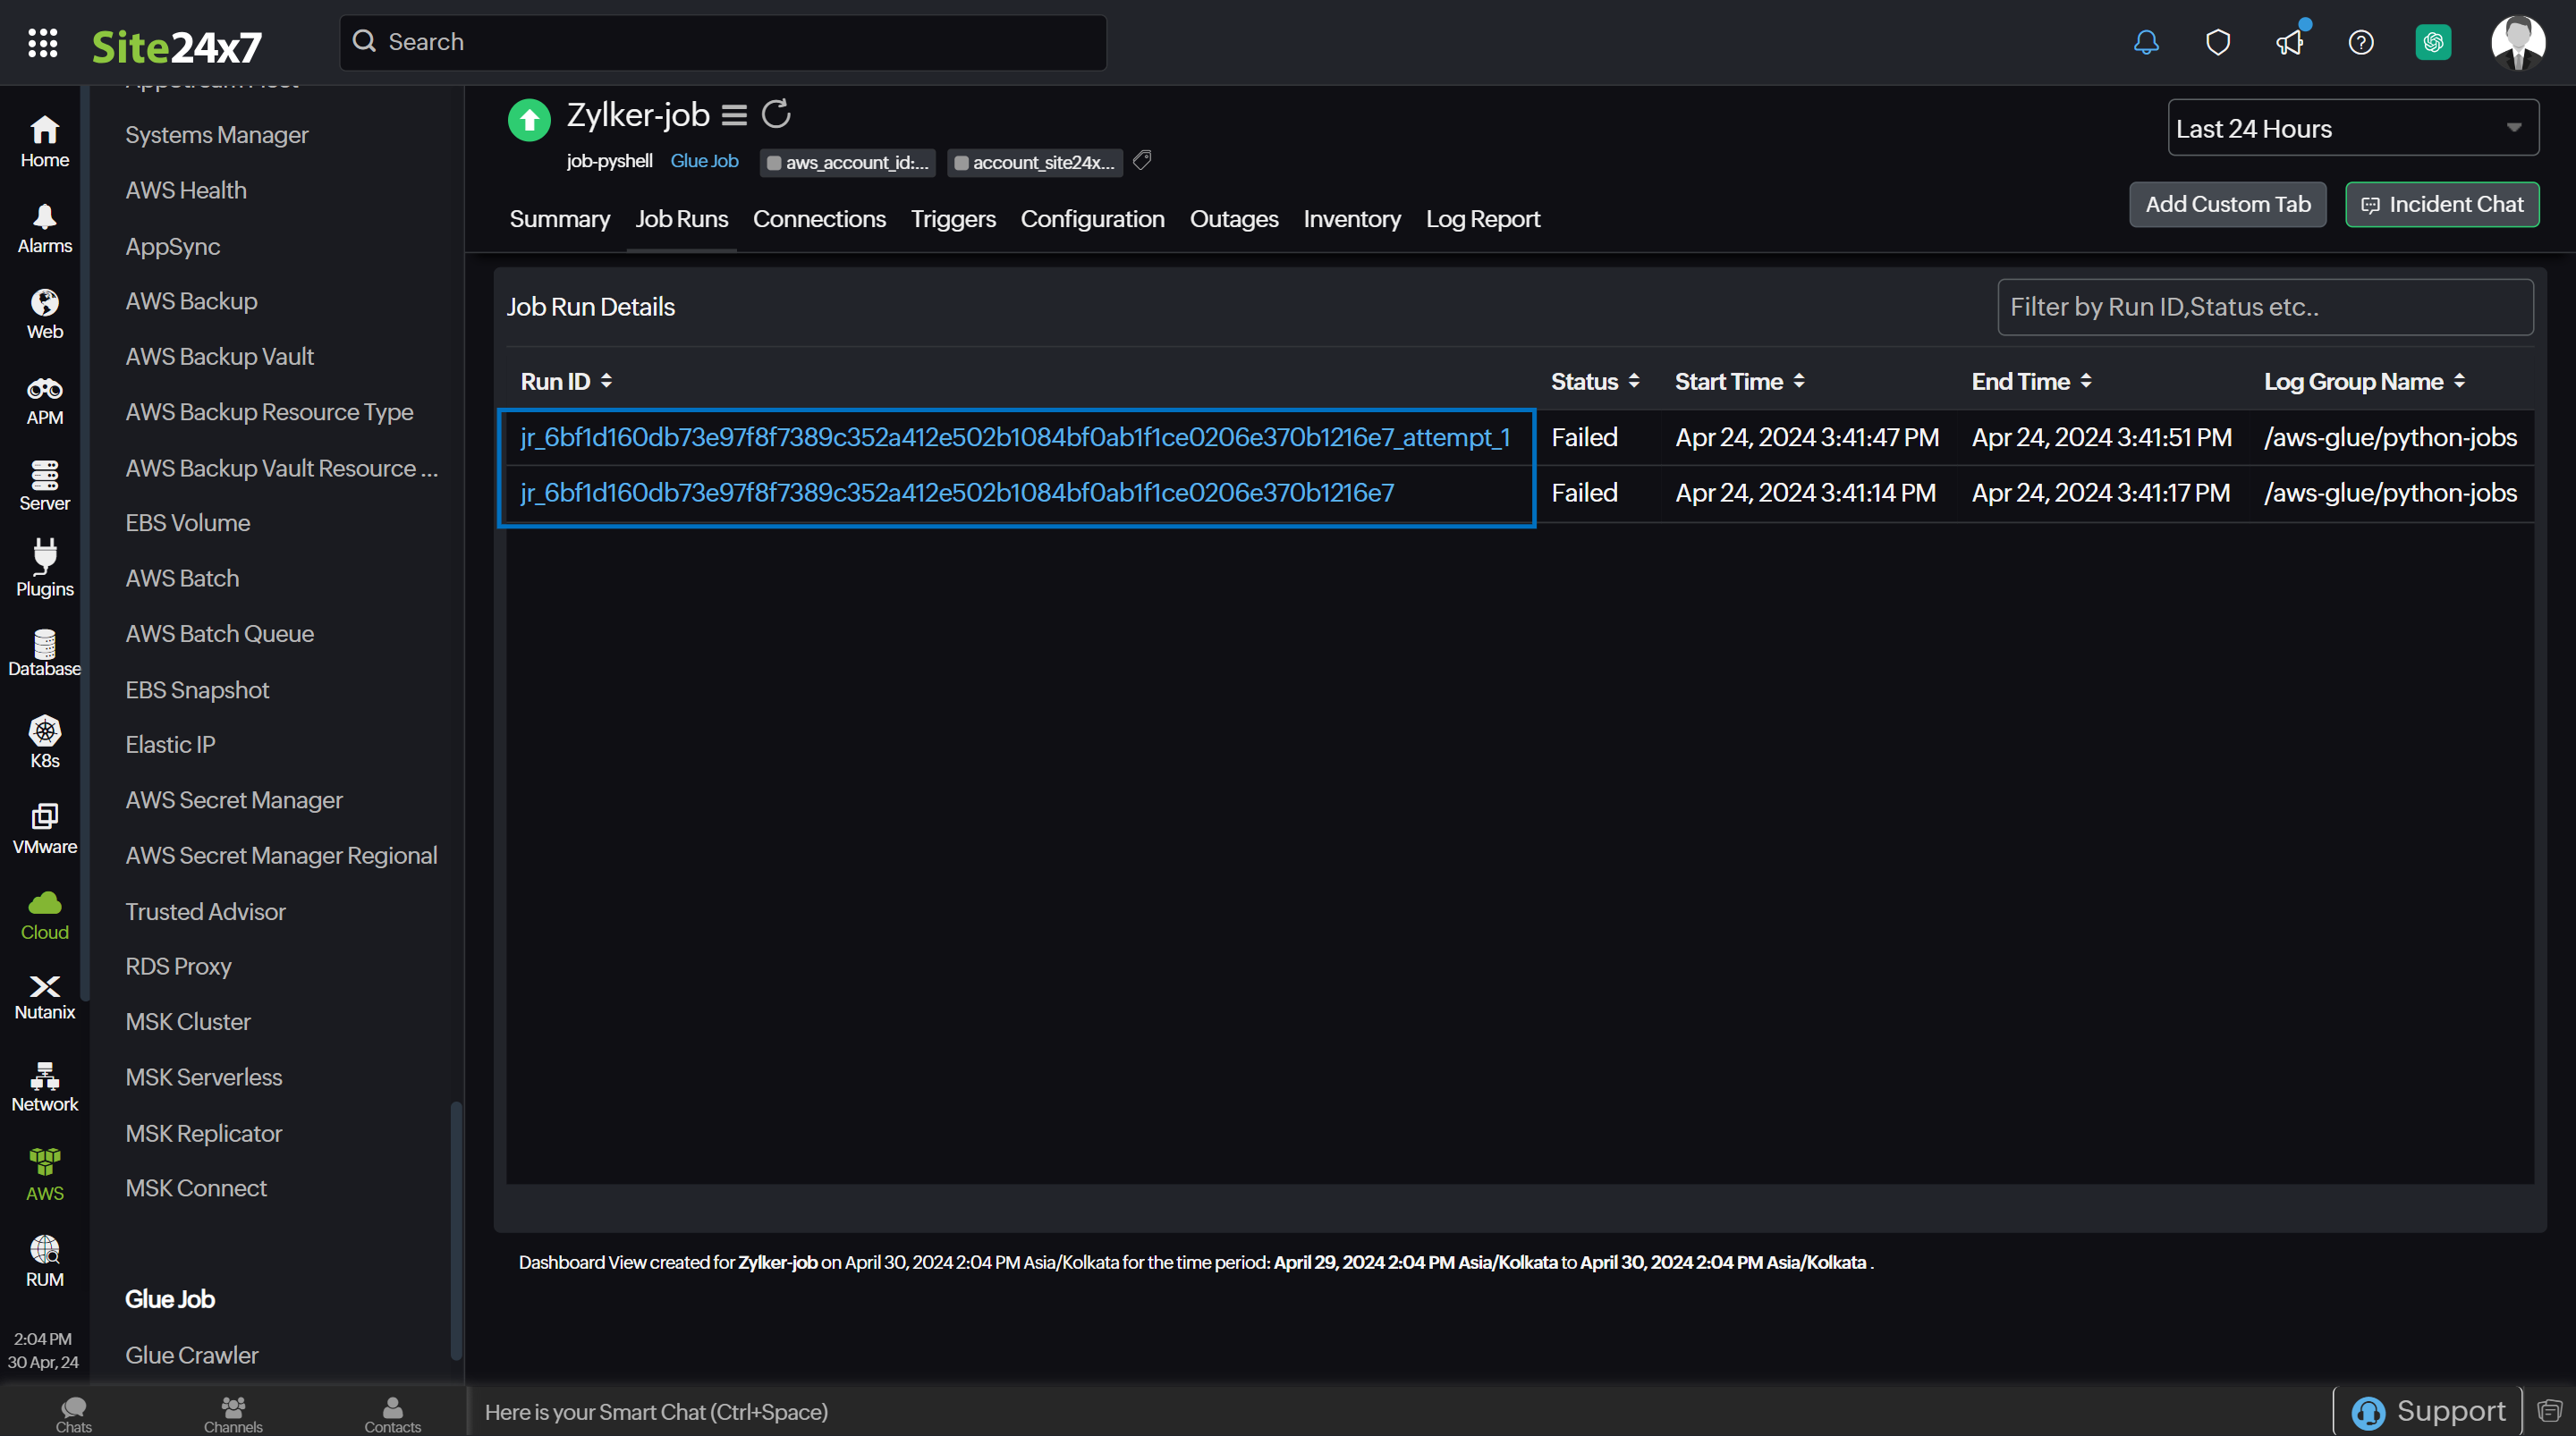
You can filter the job run details by Run ID, Status, Start Time, End Time, and Log Group Name. Click the applicable Run ID hyperlink to obtain a detailed overview of the job run from the Job Run Details page.
Connections
View all connections for a job in the Connections tab.You can filter the connection details with options such as Connection Name, Type, and Creation Time.
Triggers
The Triggers tab provides glue trigger details such as Trigger Name, Type, and Creation Time, which triggered the job.
Configuration
The Configuration tab summarizes information regarding your Glue Job monitor, including its name, type, creation date, and script location. The Source Details section provides data of remote sources where a job gets stored, such as with a Repository Provider, Repository Name, and Branch Name.
Outages
The Outages tab provides details on an outage's start time, end time, duration, and comments (if any).
Inventory
Obtain details like Job Name, Region, and Monitor Licensing Category from the Inventory tab. Set and view the Threshold and Availability Profile and the Notification Profile according to the user in this tab.
Log Report
This tab provides a consolidated report of the Glue Job monitor's log status, which can be downloaded as a CSV file.
Glue Crawler monitor data
You can view your Glue Crawler data on the following tabs.
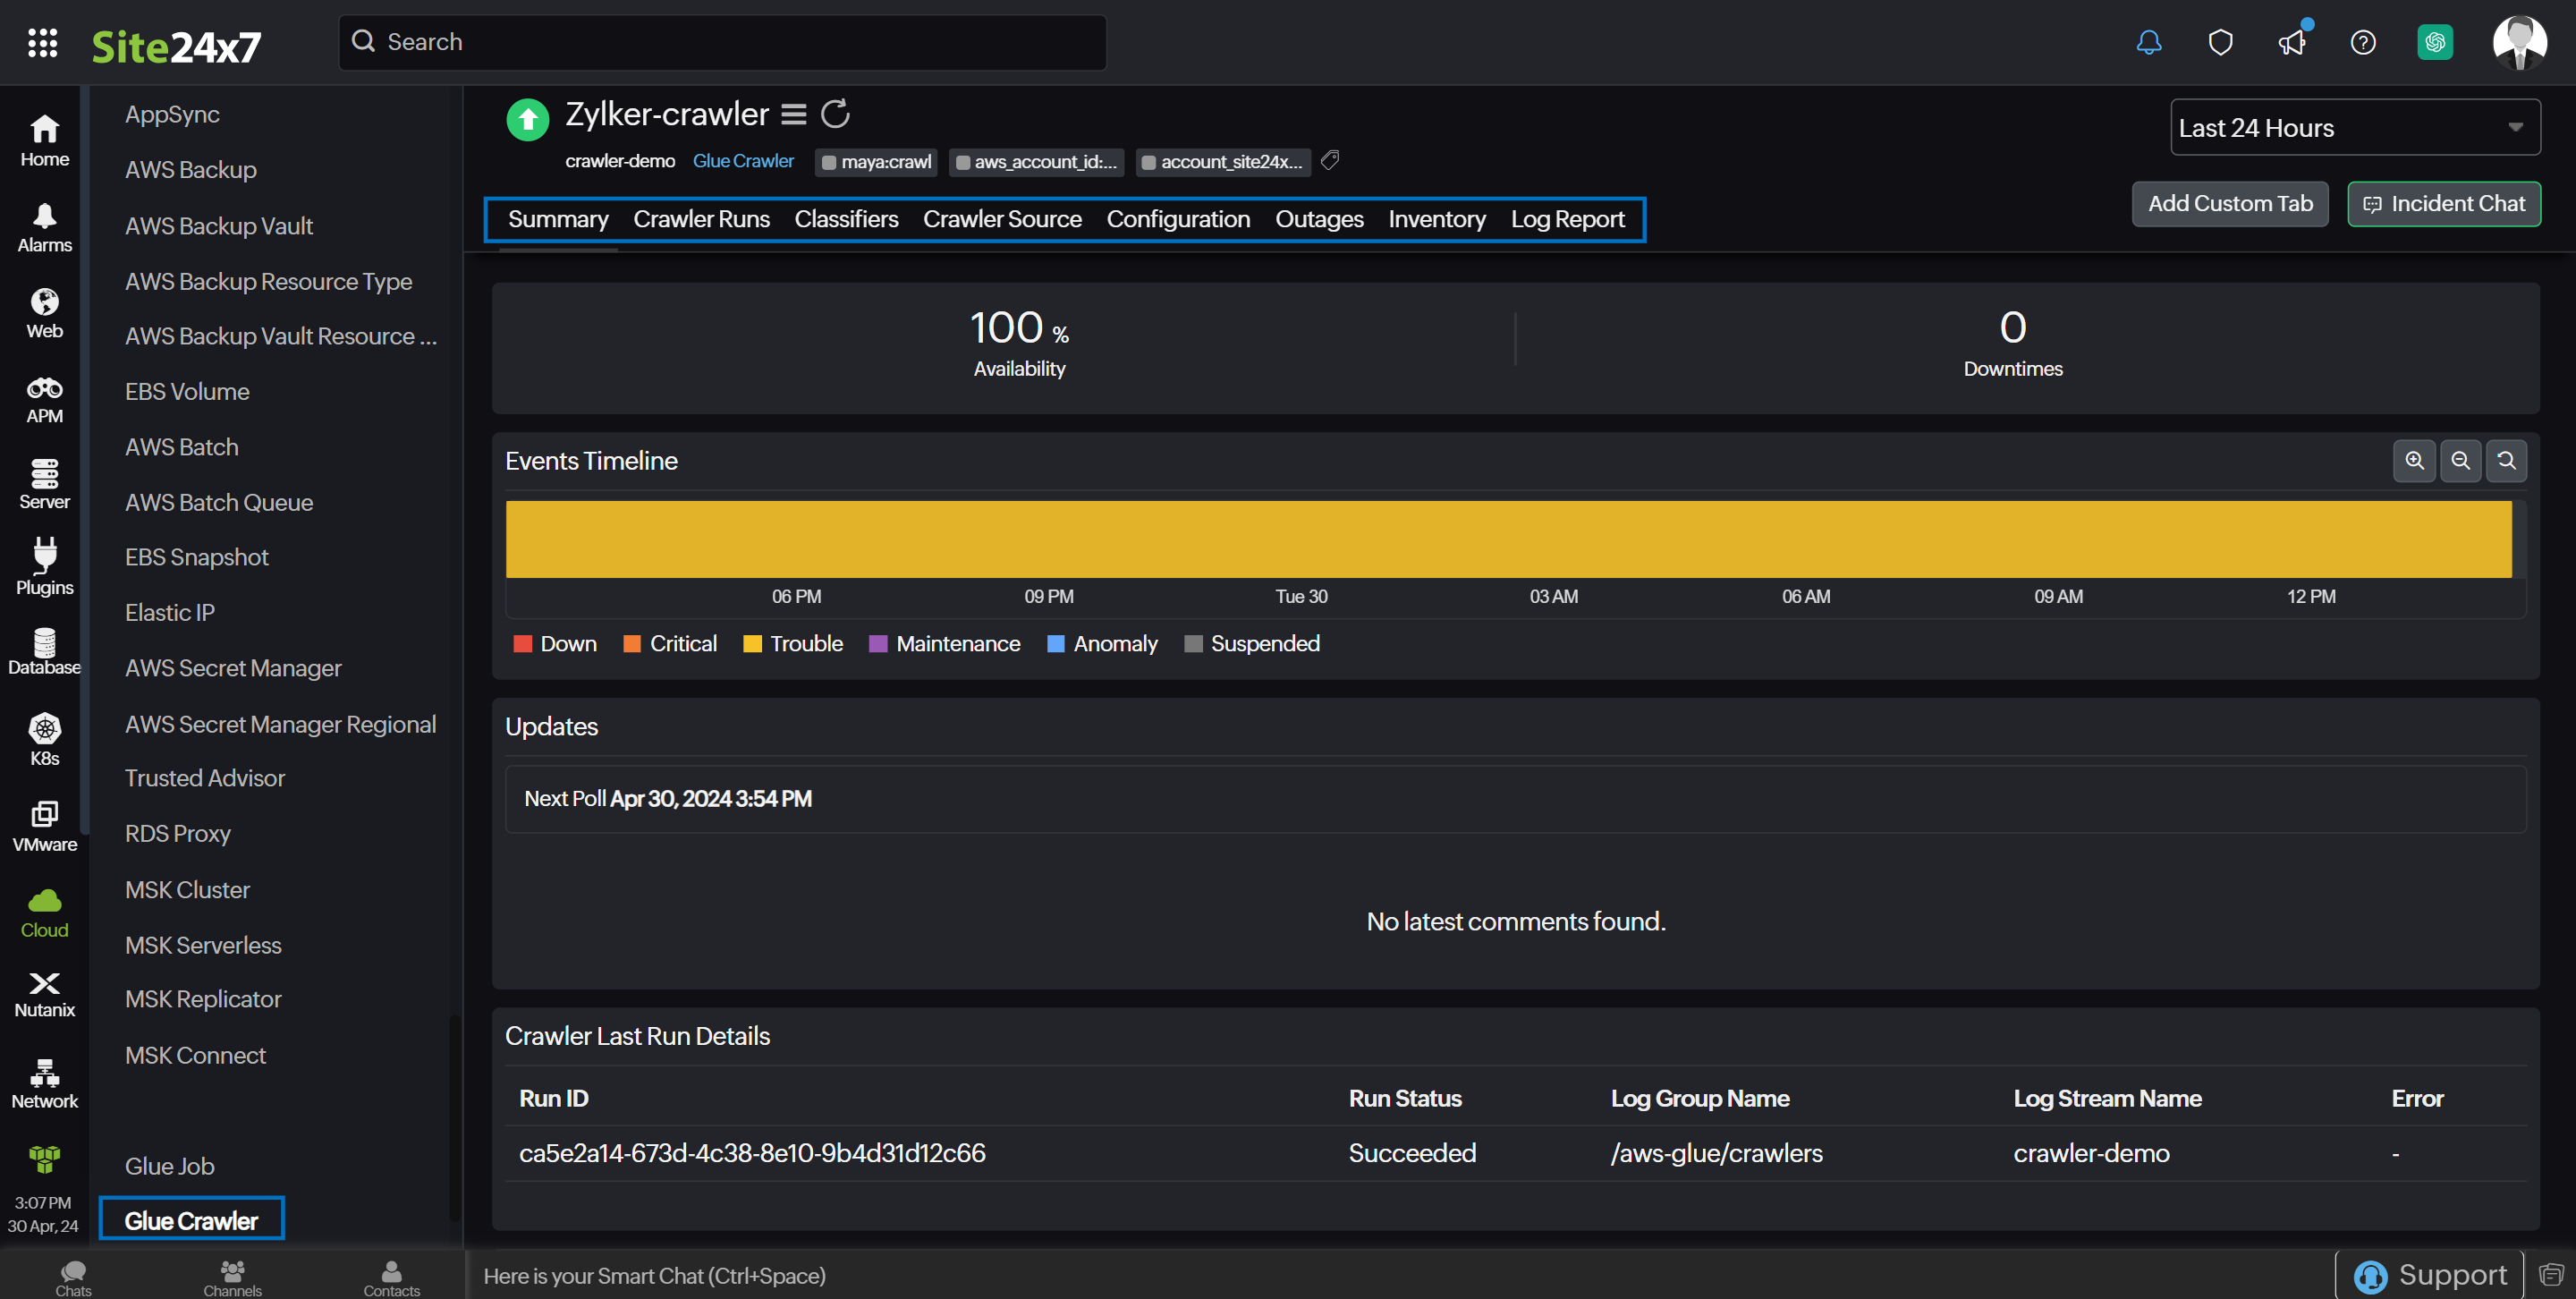
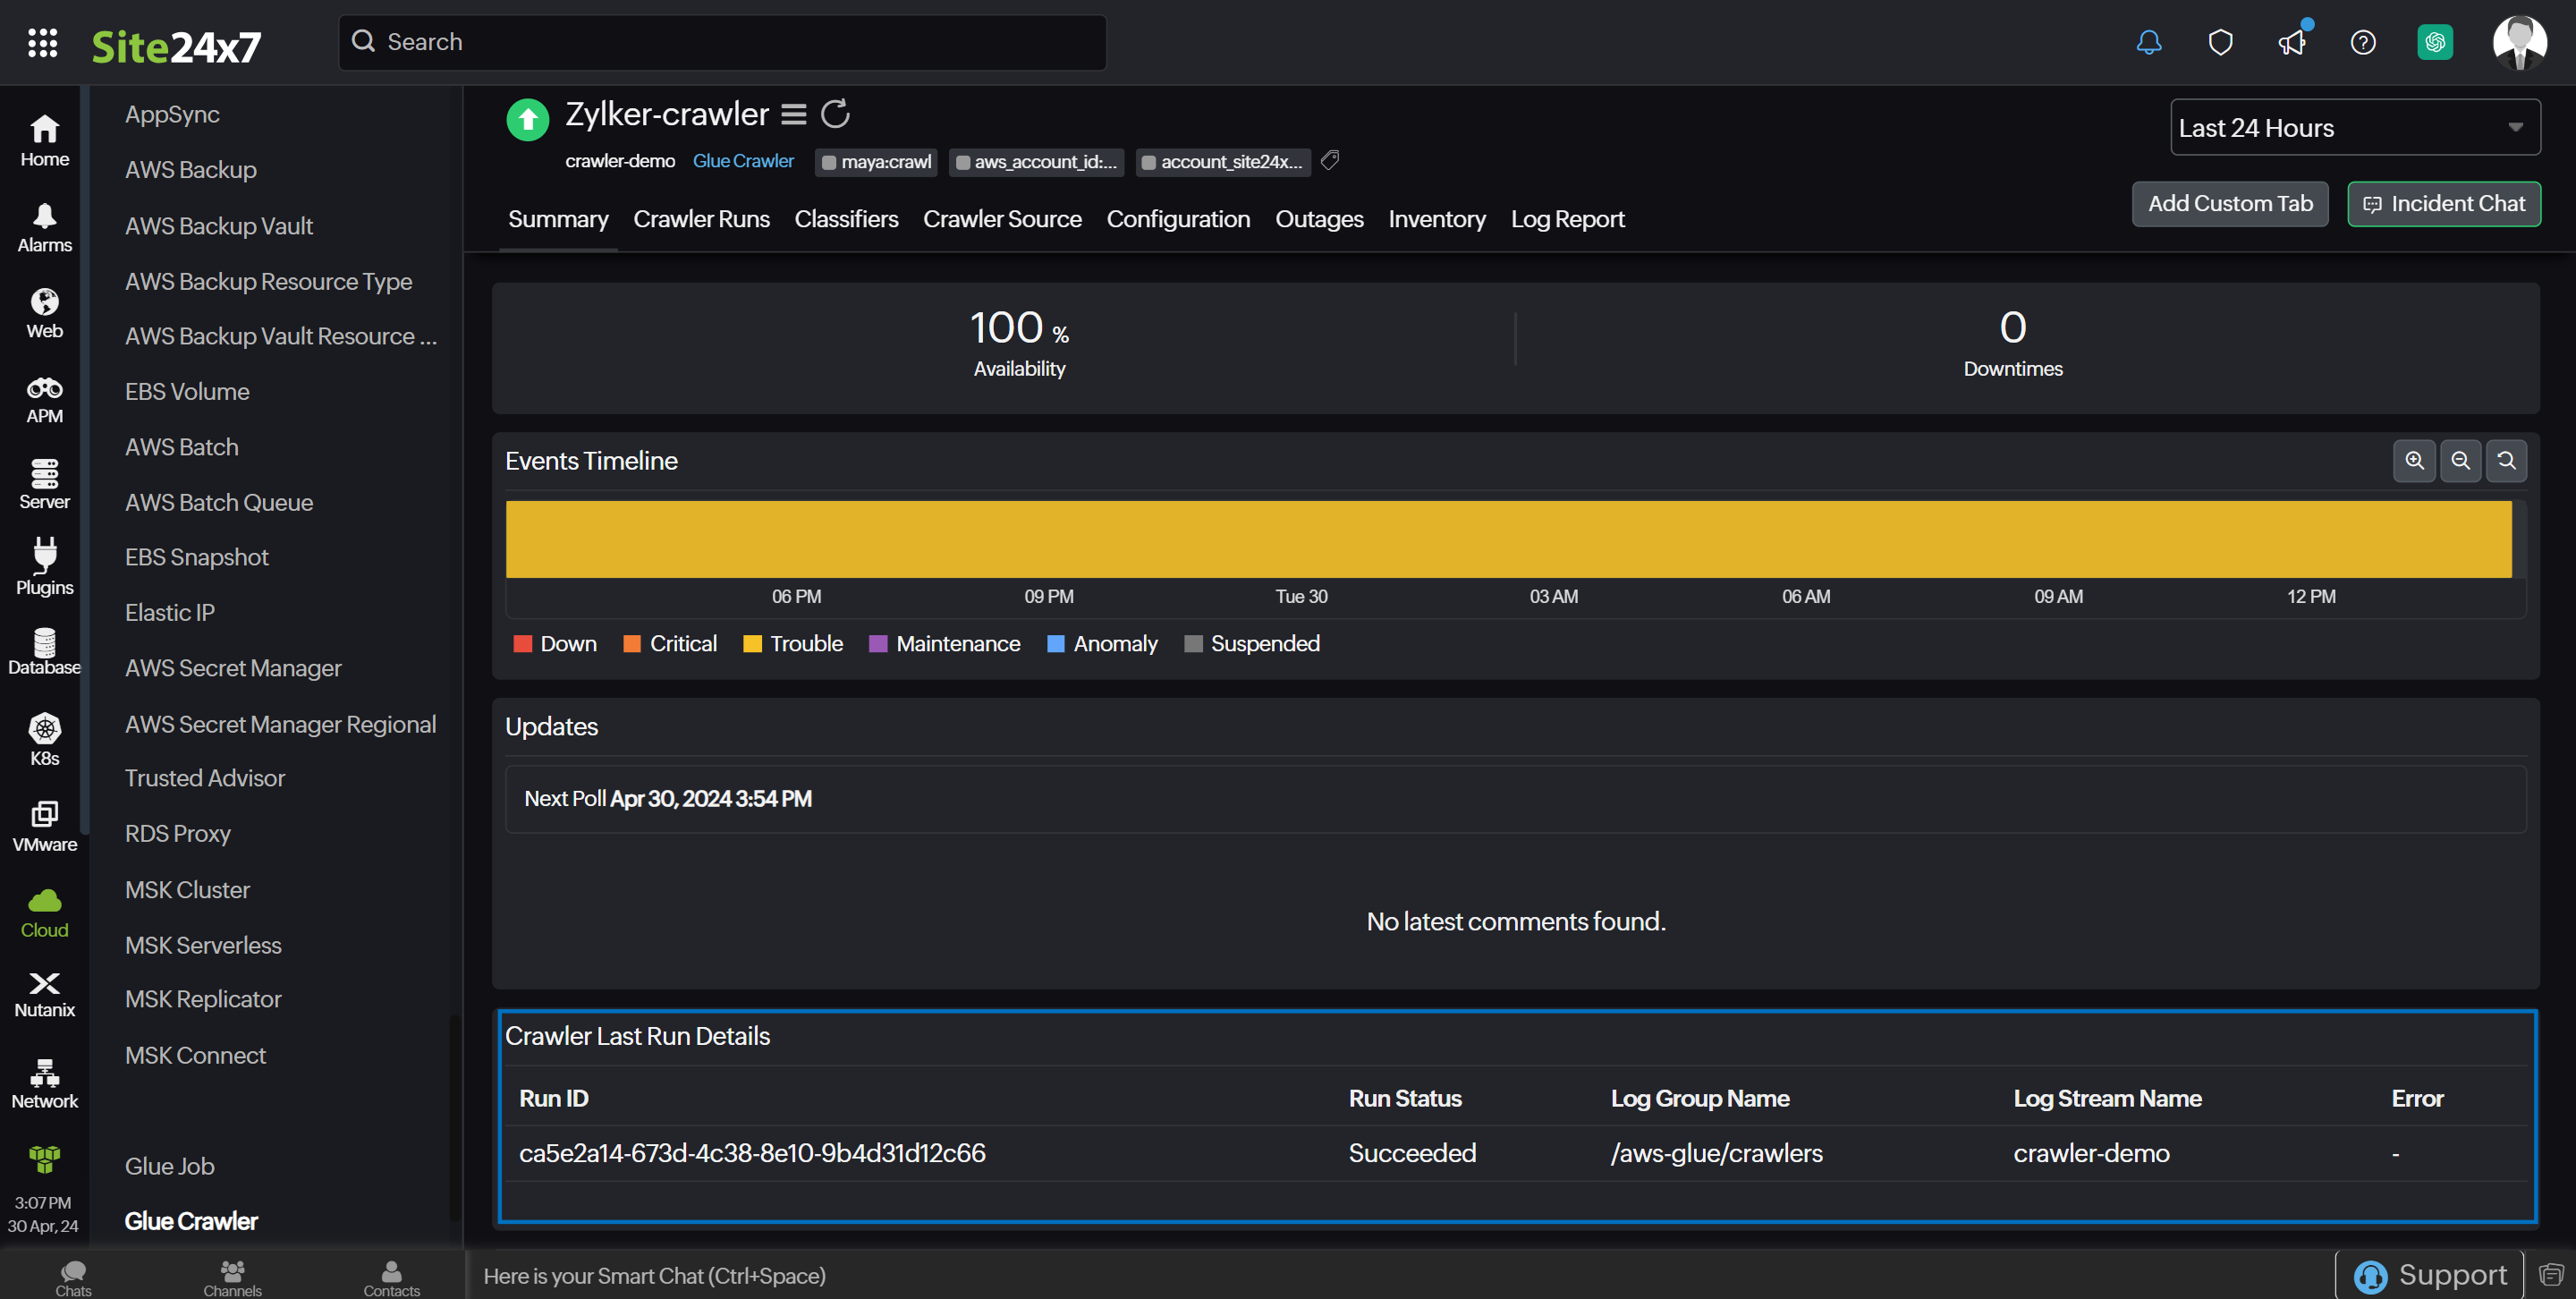
Summary
The Summary tab displays a comprehensive overview of the events timeline and metrics in the form of charts, including glue crawler performance and last crawler run details.
Crawler Runs
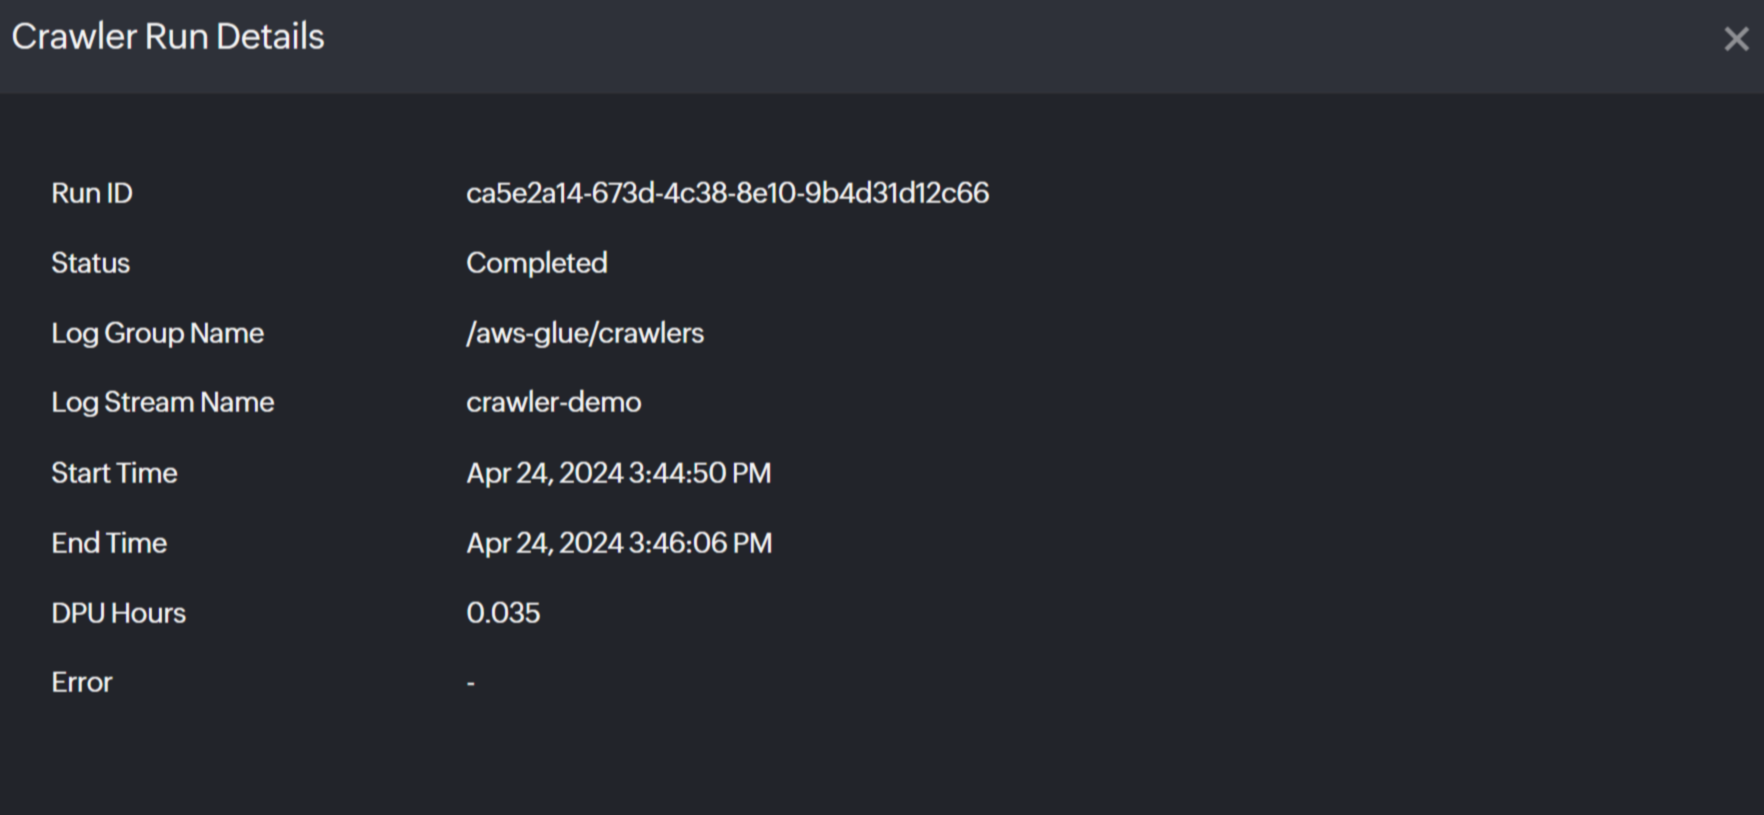
The Crawler Runs tab provides details of all the crawler runs. You can filter the crawler run details by Run ID, Status, Start Time, End Time, and DPU Hours.
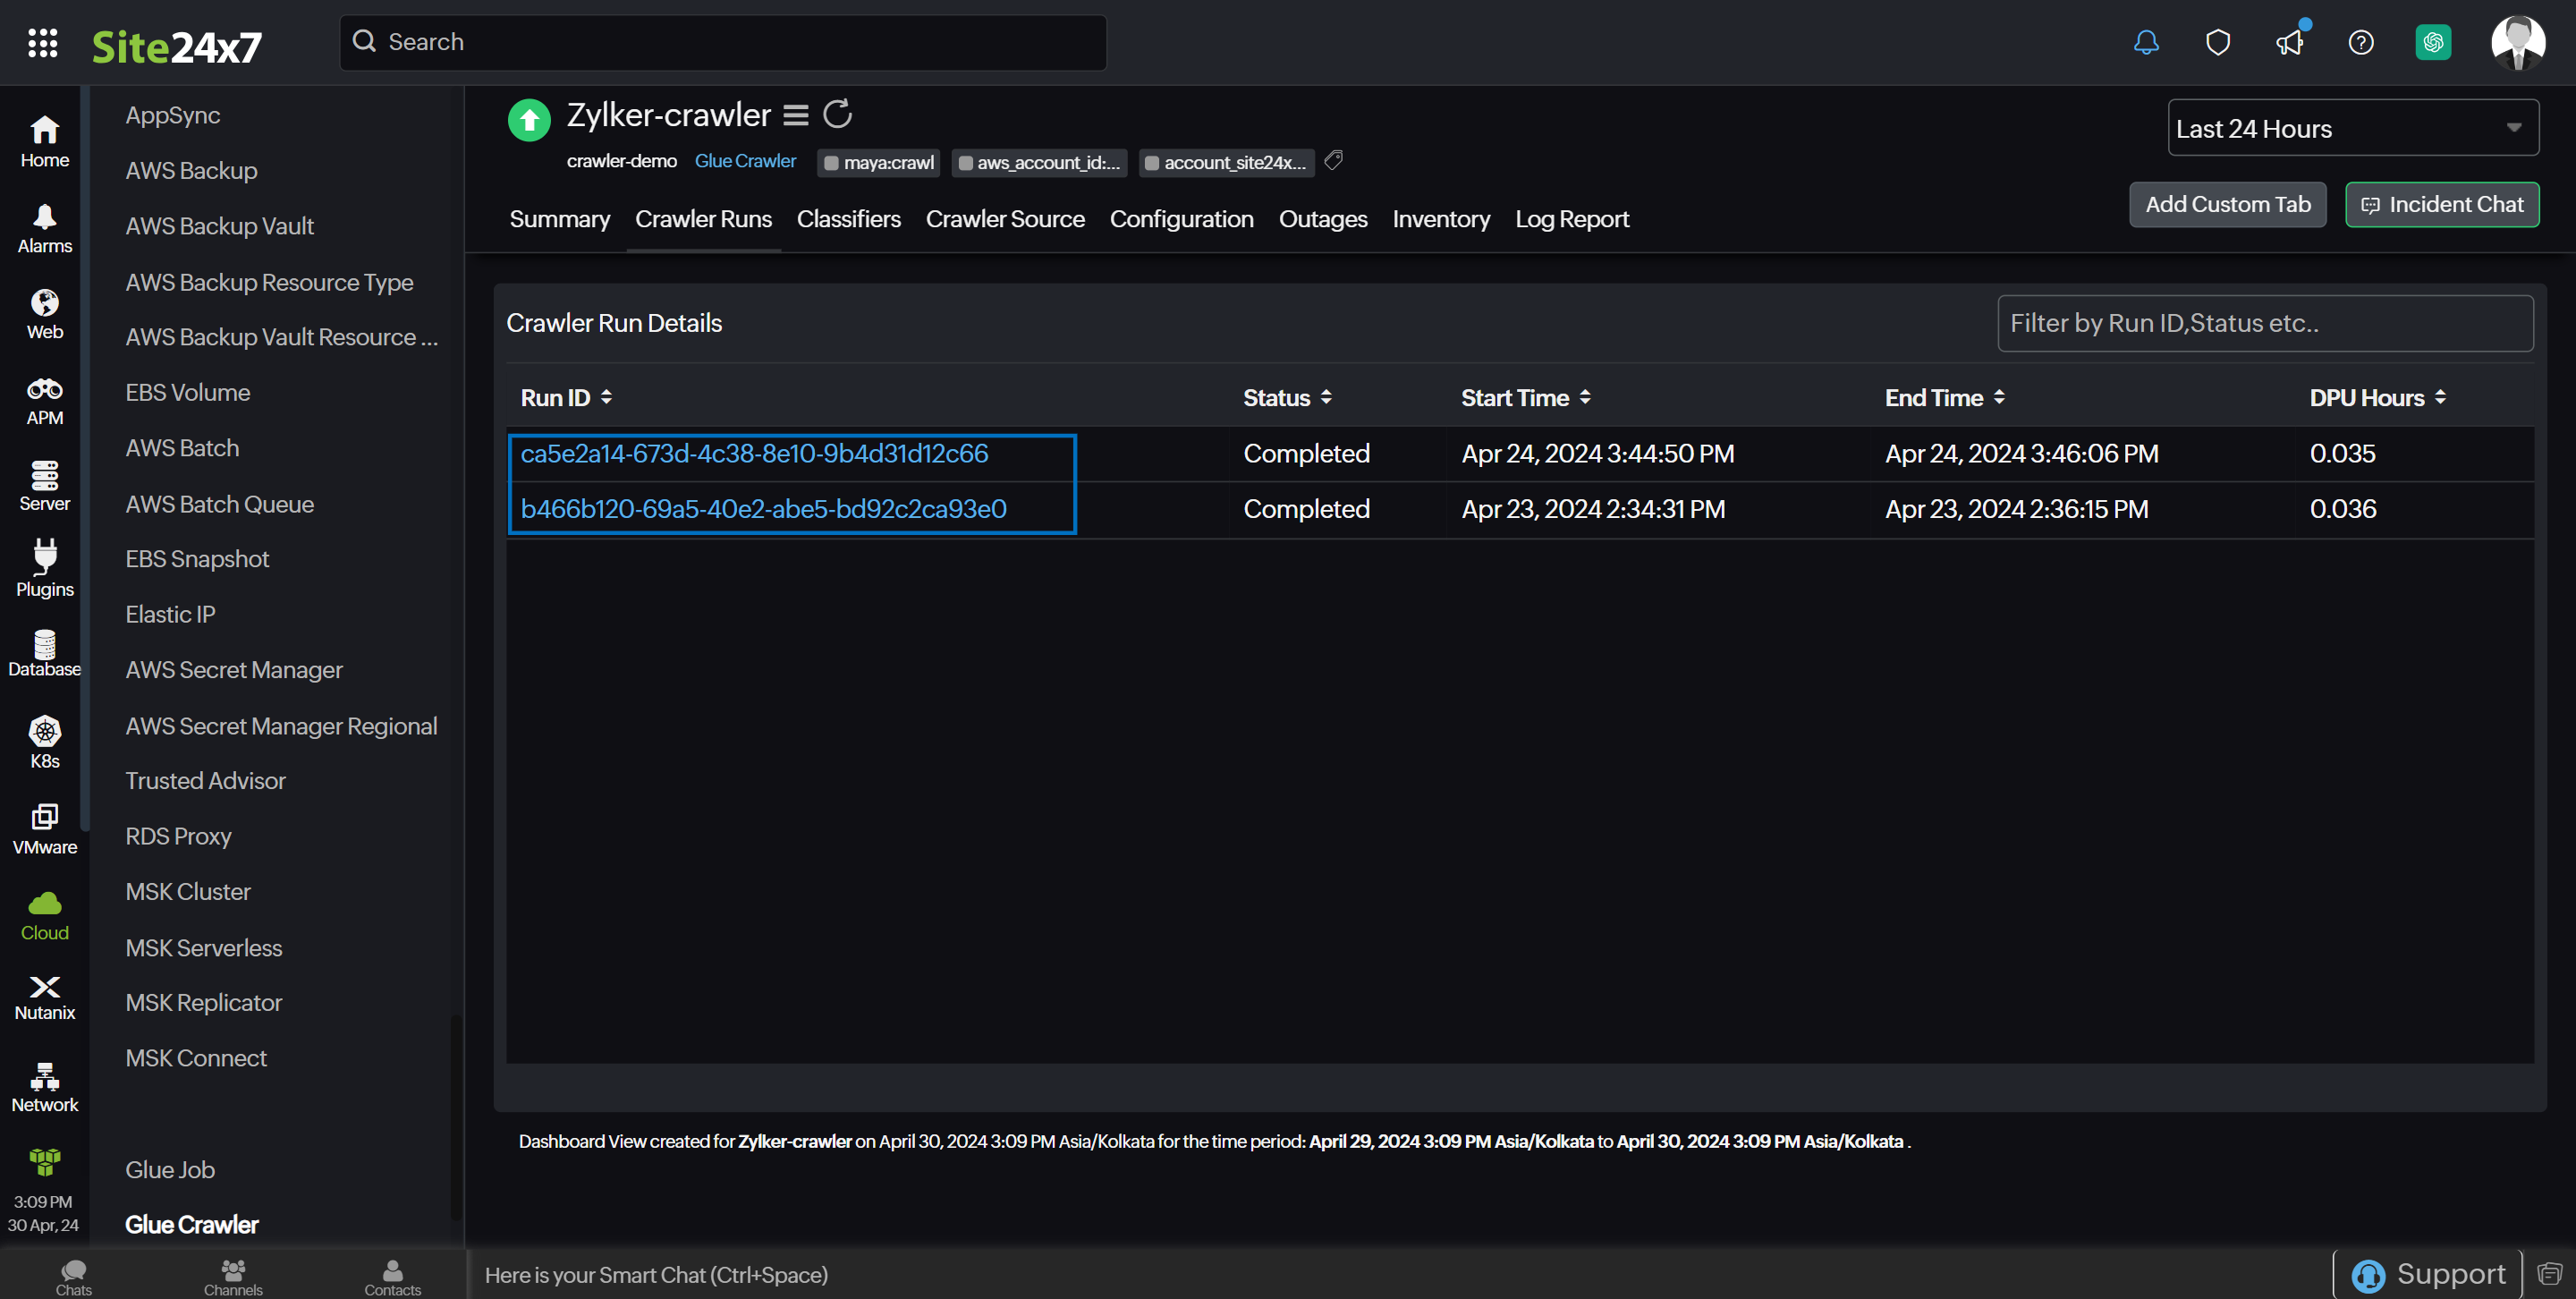
Click the applicable Run ID hyperlink to obtain a detailed overview of the crawler run from the Crawler Run Details page.
Classifiers
The Classifiers tab provides details of all classifiers specified for a crawler. You can filter the classifier details with options such as Classifier Name, Type, and Creation Time.
Crawler Source
The Crawler Source tab displays all sources of a crawler where it extracts data. You can view the Source Name, Connection Name, Path, and Tables Count in this tab.
Configuration
The Configuration tab summarizes information regarding your Glue Crawler monitor, including its name, status, version, and creation date.
Outages
The Outages tab provides details on an outage's start time, end time, duration, and comments (if any).
Inventory
Obtain details like Crawler Name, Region, and Monitor Licensing Category from the Inventory tab. Set and view the Threshold and Availability Profile and the Notification Profile according to the user in this tab.
Log Report
This tab provides a consolidated report of the Glue Crawler monitor's log status, which can be downloaded as a CSV file.
-
On this page
- Overview
- Use case
- Benefits of the Site24x7-AWS Glue integration
- Setup and configuration
- Permissions
- Polling frequency
- Supported metrics
- Glue Job
- Glue Crawler
- Threshold configuration
- Licensing
- IT Automation
- Viewing AWS Glue data
- AWS Glue monitor data
- Glue Job monitor data
- Glue Crawler monitor data