How to capture all traces for your application
Traces are detailed records that show the path of a request as it moves through different parts of your application. By viewing trace data, you can quickly identify where delays or errors occur, pinpoint problem areas, and resolve them before they impact users. This feature is common for all APM agents.
How all traces works
By default, the APM agent captures trace data every minute, based on the threshold values you configure for each application. For example, if you set the threshold to two seconds, the client will record the trace data of a request that takes longer than two seconds. Therefore, the trace data will include details of delays in successful execution or errors in transactions.
When you enable the Capture All Traces option, the APM agent ignores the configured threshold limits and starts capturing traces for all the requests. Traces are collected only when the application status is Up, Critical, Trouble, or Maintenance. For Down or Suspended status, the trace data will not be available.
Use case
An organization is using Site24x7 APM to monitor the performance of its applications. Consider a customer raises a support ticket stating that their fund transfer failed or took too long to complete. As few traces are dropped because of the configuration setup, it isn't easy to track the customer's transaction history.
With the Capture All Traces feature, the team can now search for a customer's specific transaction timestamp or trace ID and view the complete backend transaction flow, from login validation and account verification to payment gateway interactions and notification service calls.
How to enable all traces
- Log in to your Site24x7 account.
- Click on APM > APM Insight > Applications.
- For the application for which you want to enable all traces, hover on the Hamburger icon
 and select Edit.
 - Scroll down to the Configuration Profile section and click the Edit icon
 on APM Agent Configuration Profile.
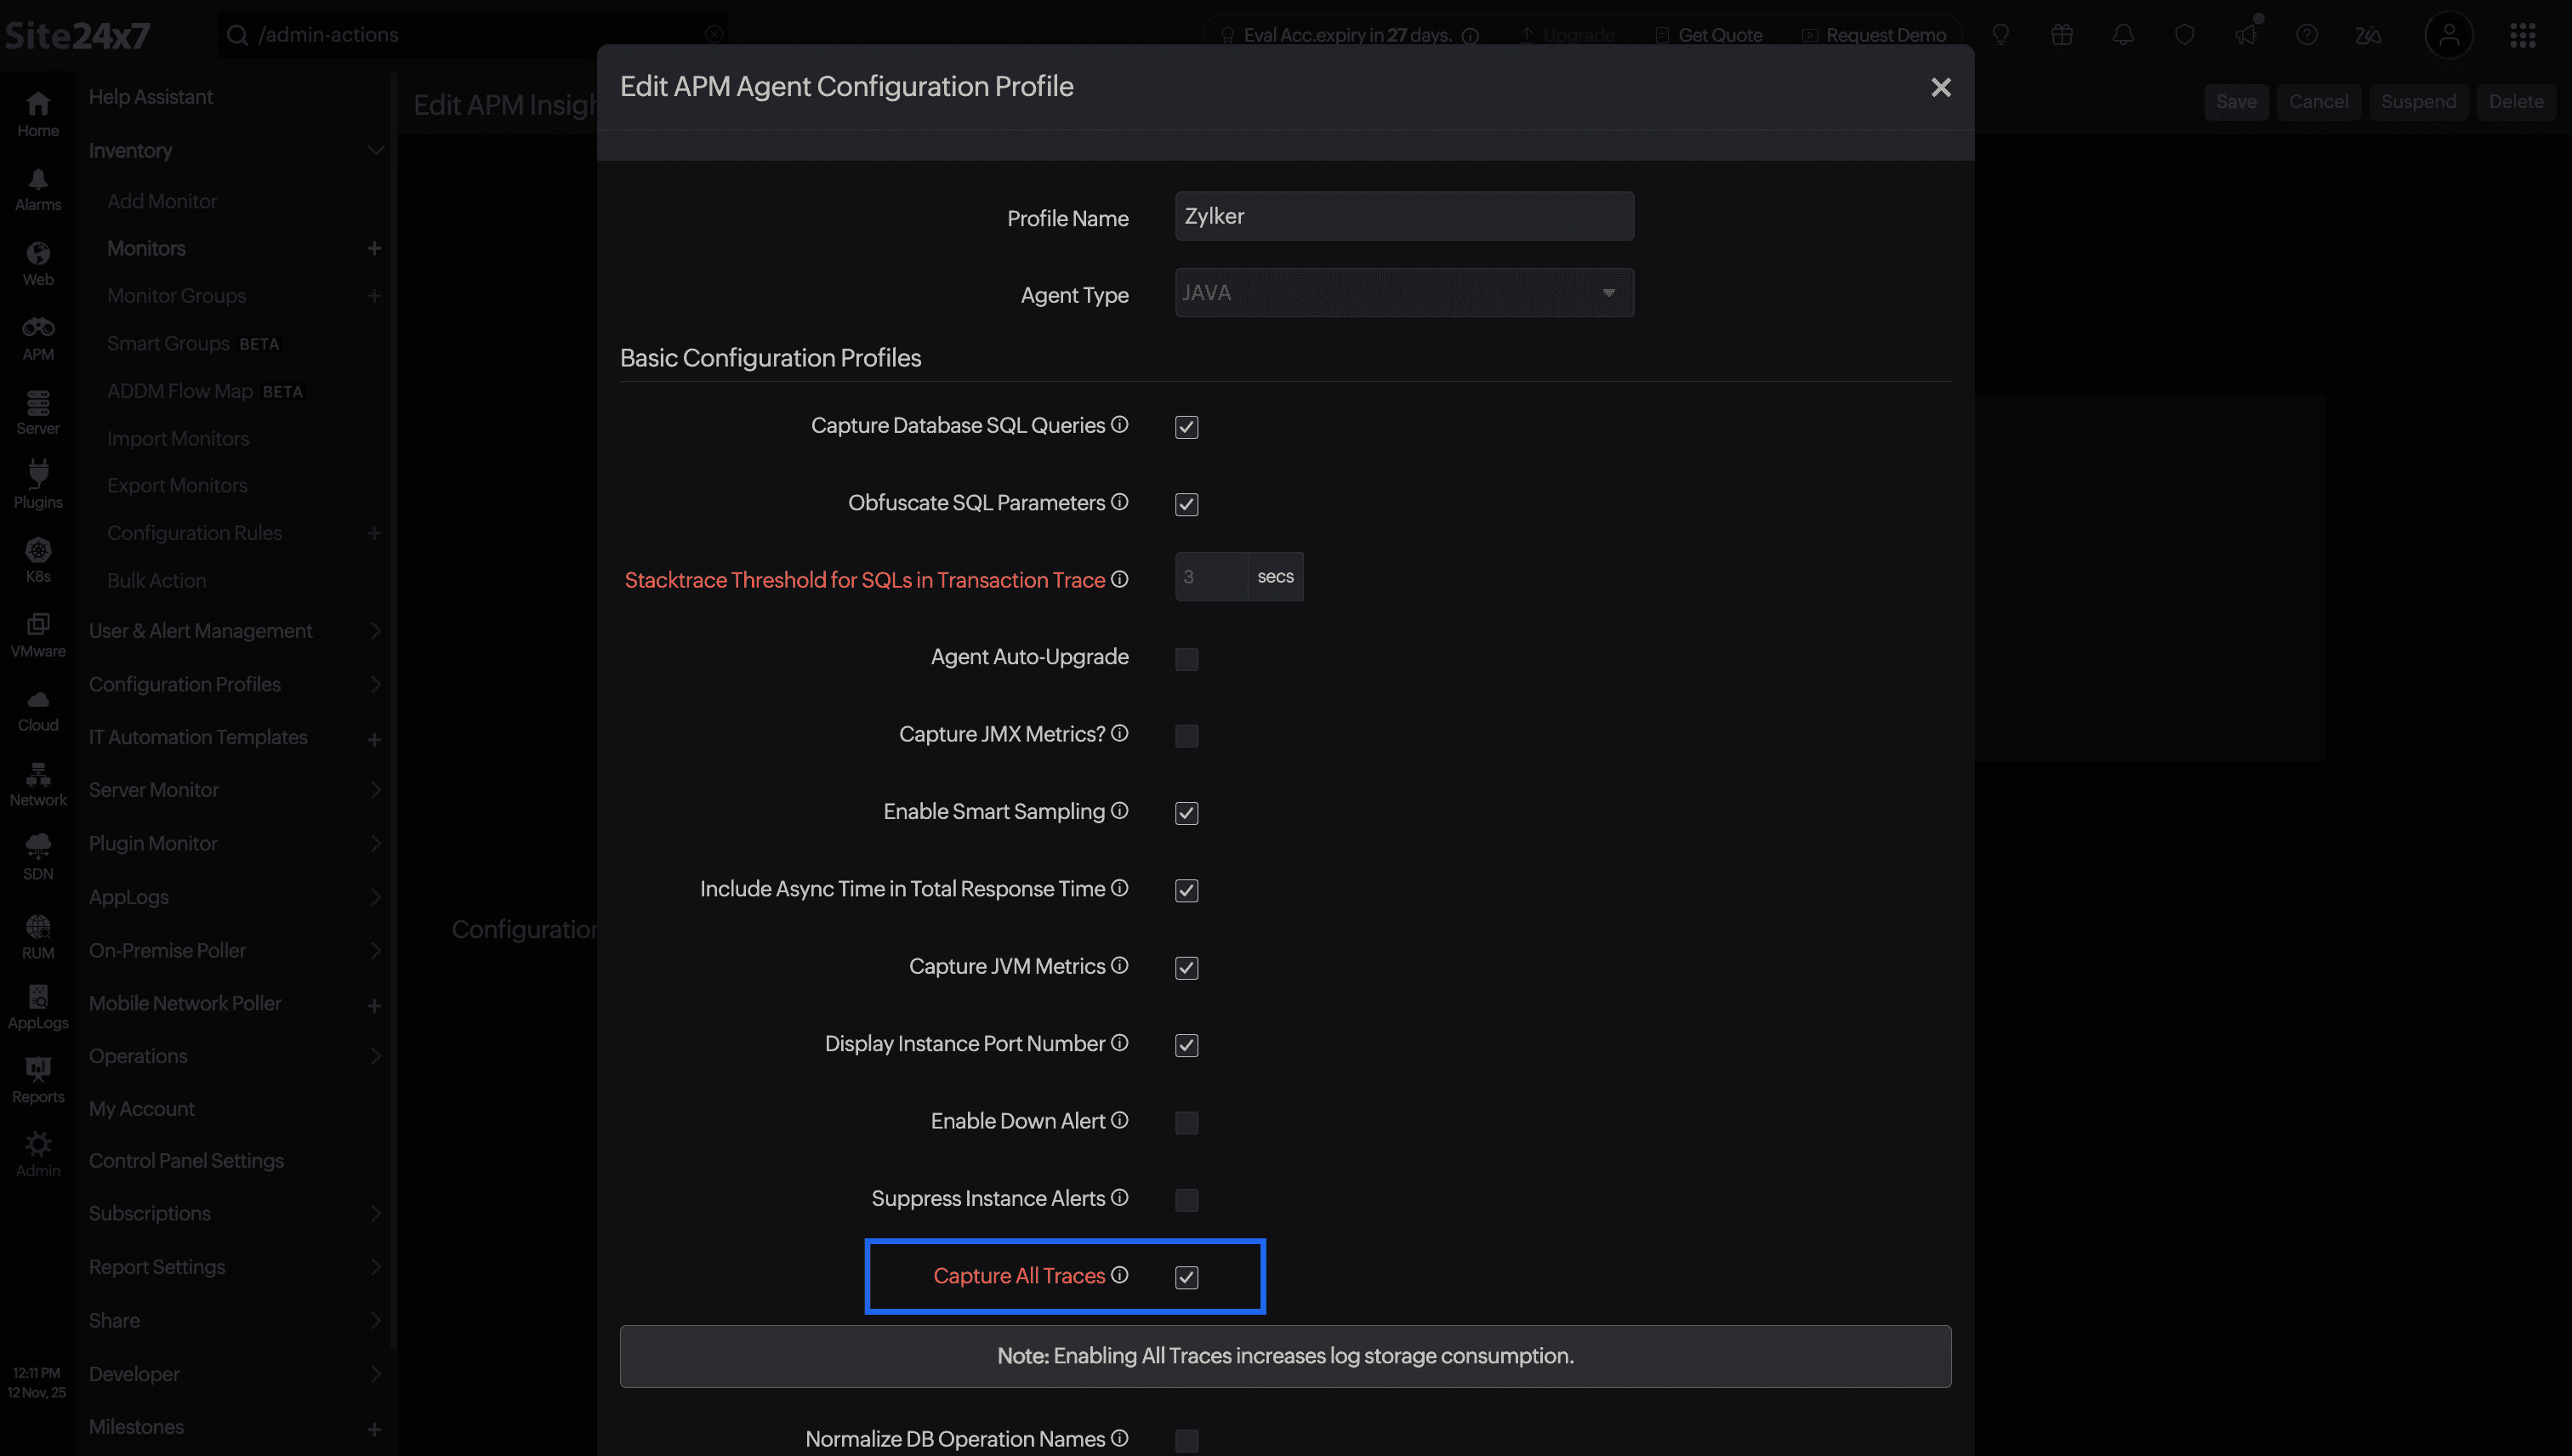
Figure 1: Edit APM Agent Configuration Profile screen showing the Capture All Traces checkbox. - In the Basic Configuration Profiles section, you can enable the Capture All Traces checkbox.
Accessing all captured traces
After enabling the Capture All Traces option, you can view the traces in two places:
- Choose the application > Navigate to Traces. You can see all the traces captured for each request.
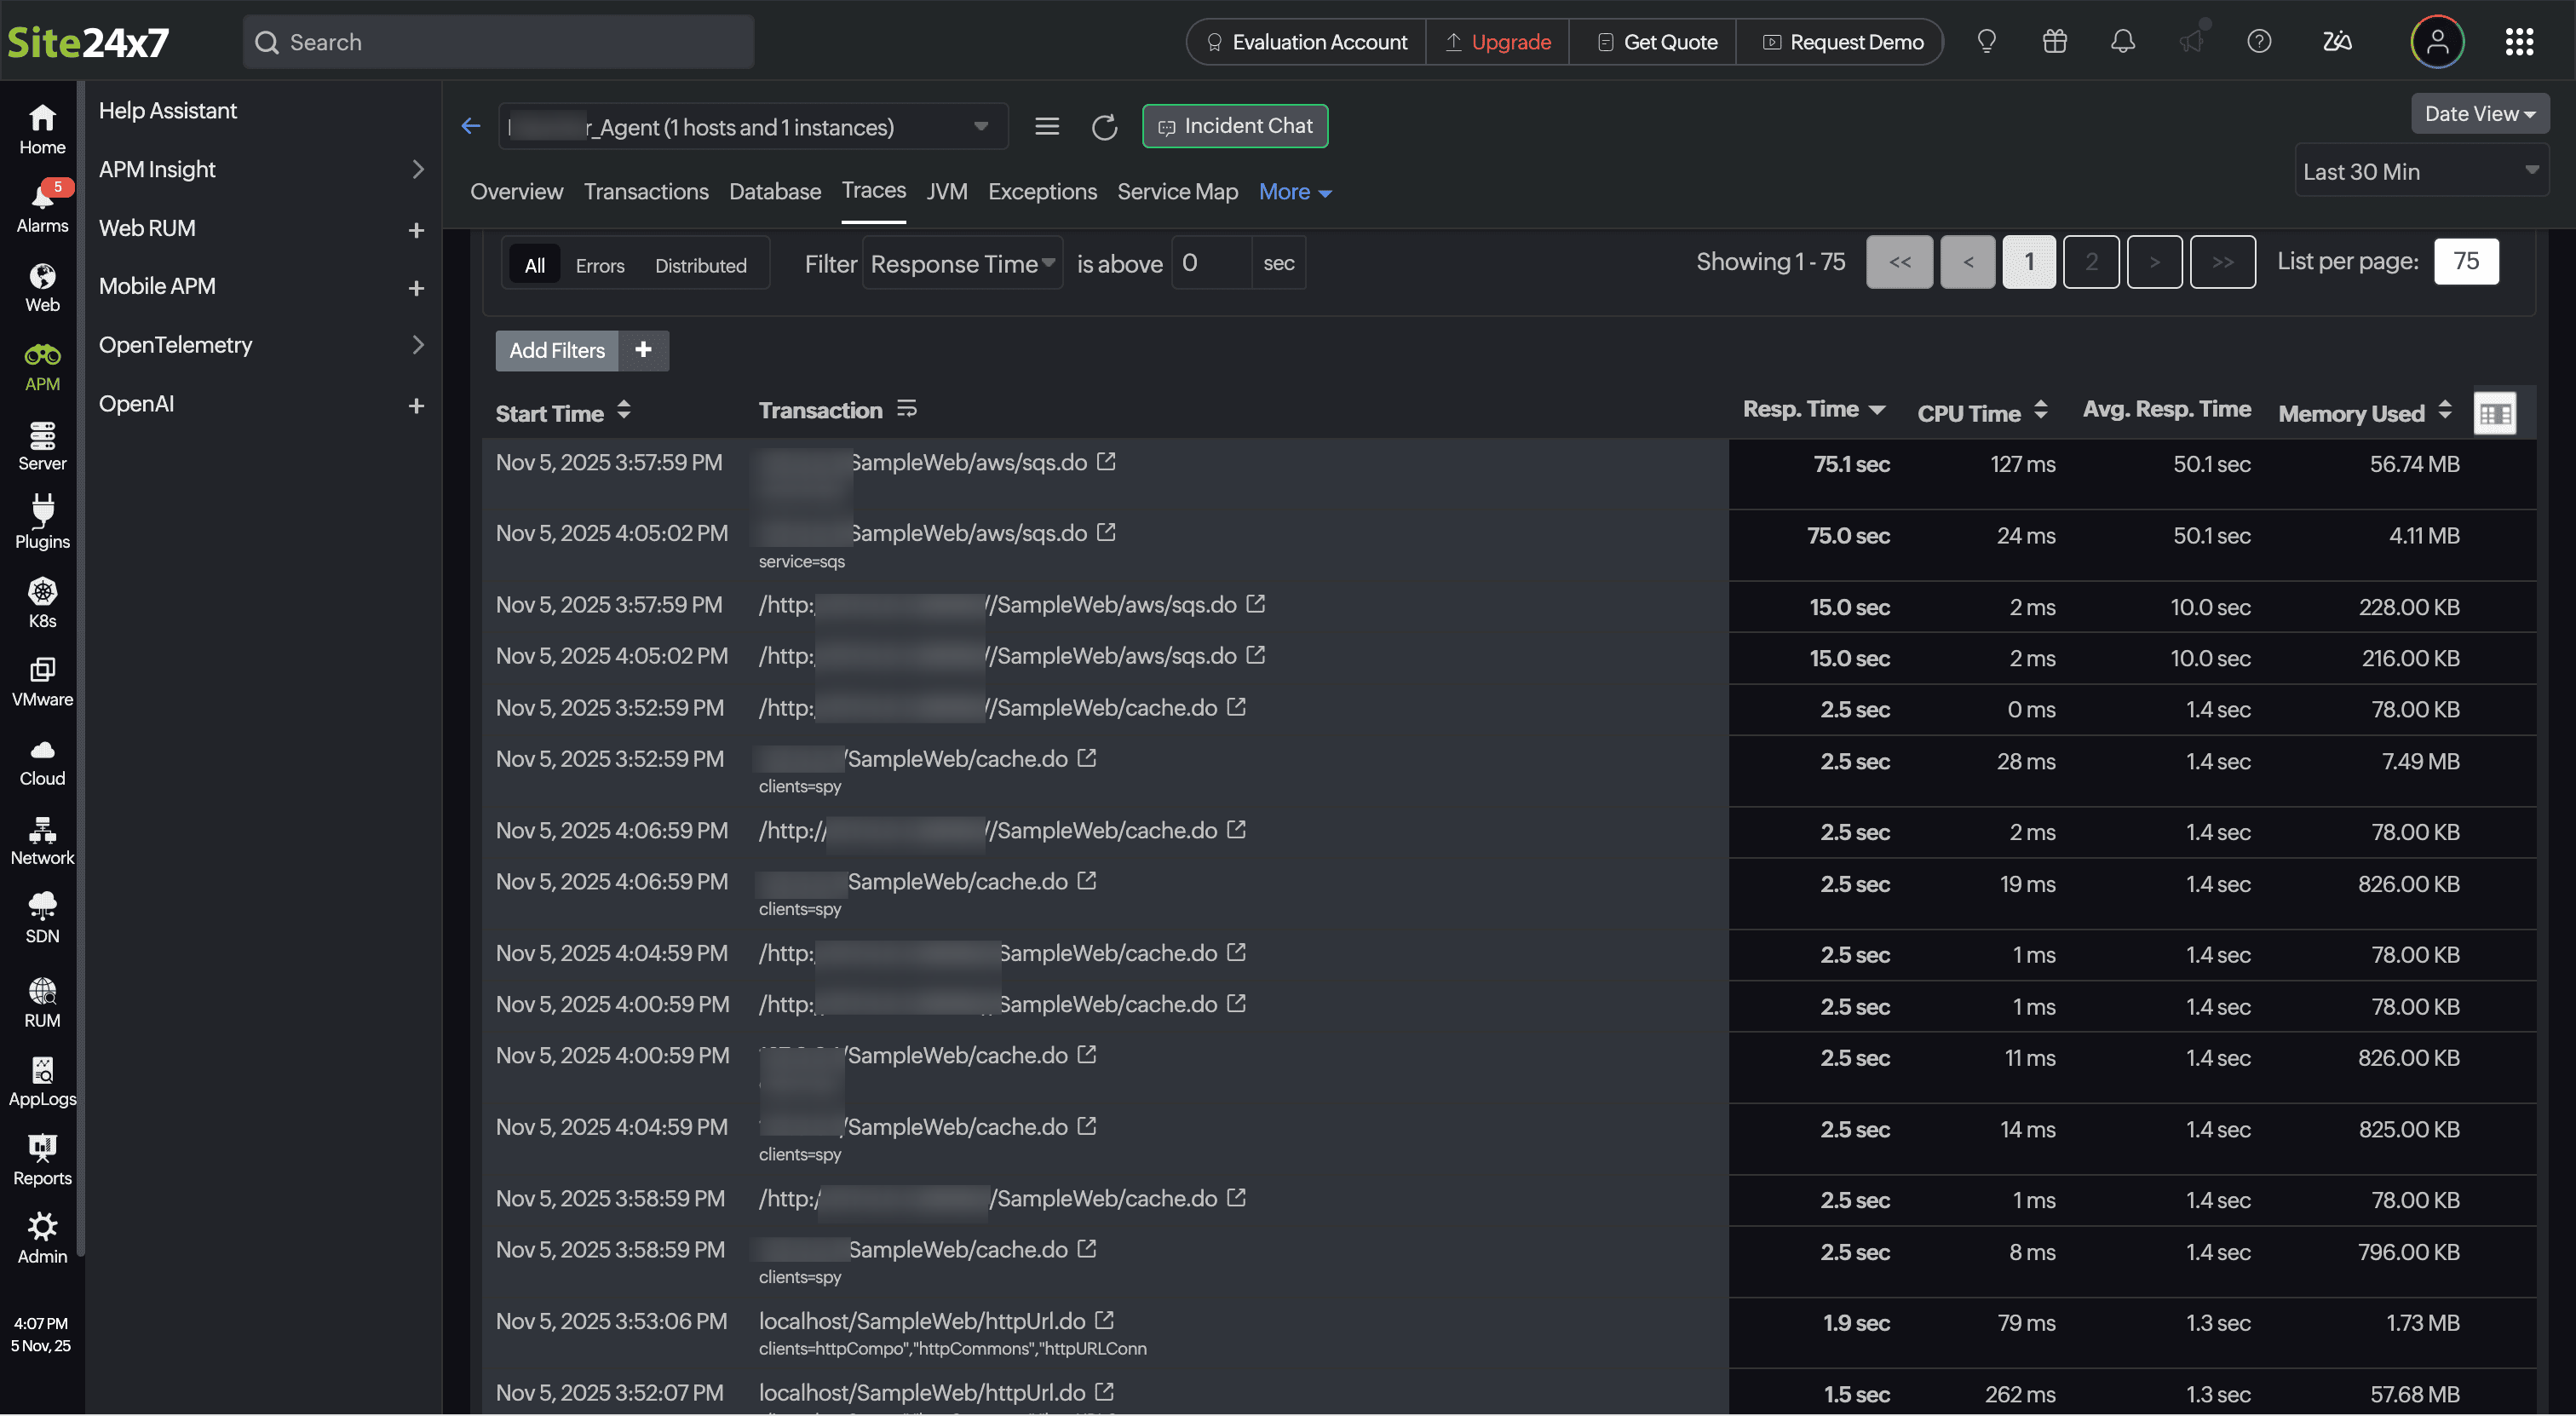
Figure 2: All the traces are captured inside the applications - Inside AppLogs, type logtype="All Traces" in the Query Search box and press Enter.
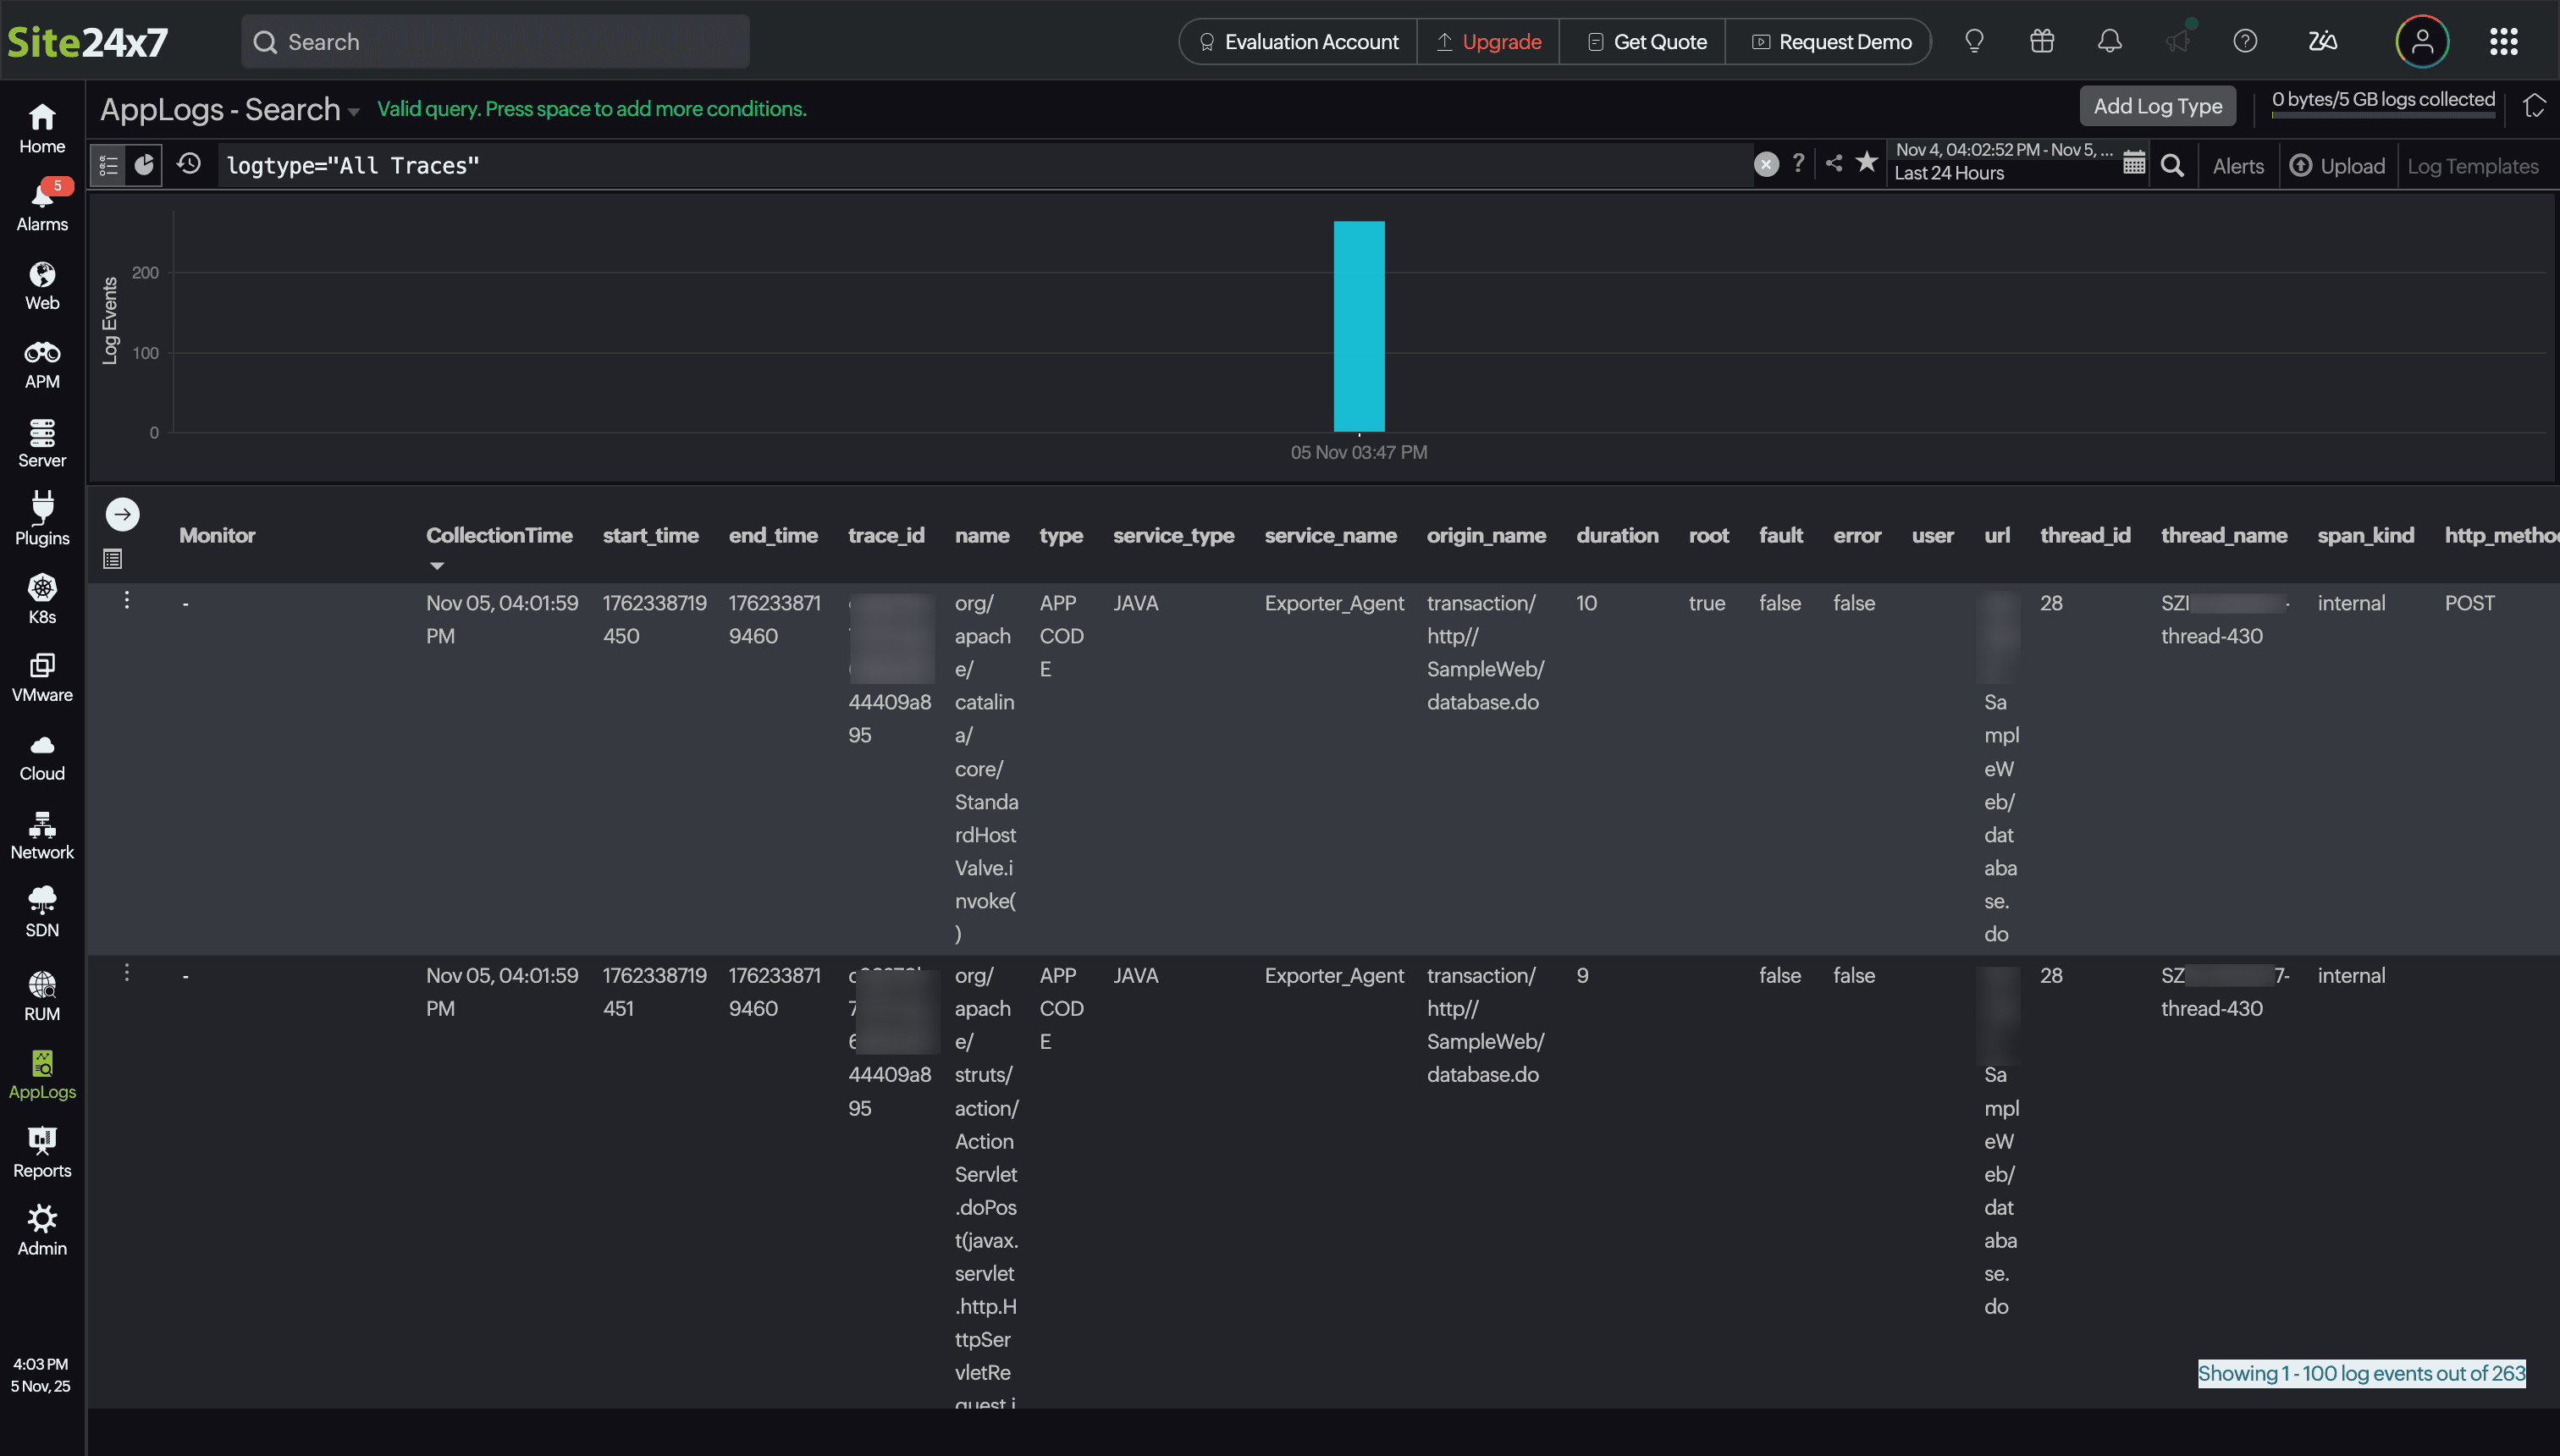
Figure 3: All the traces are captured inside AppLogs
View the unmasked transaction ID
Inside the Transactions menu, if you find asterisks (*) added to any of the transactions, say app/api/monitors/*, it means that the transaction ID has been masked. Enabling the Capture All Traces option allows you to view the unmasked transaction IDs. These unmasked values help you easily drill down and accurately track your transaction history.
To view this, you can follow the below steps:
- Go to Transactions > Click on a transaction containing asterisks(*) > Scroll down to Similar Transaction by Average Response Time widget. You can view the transaction IDs for all the grouped transactions.
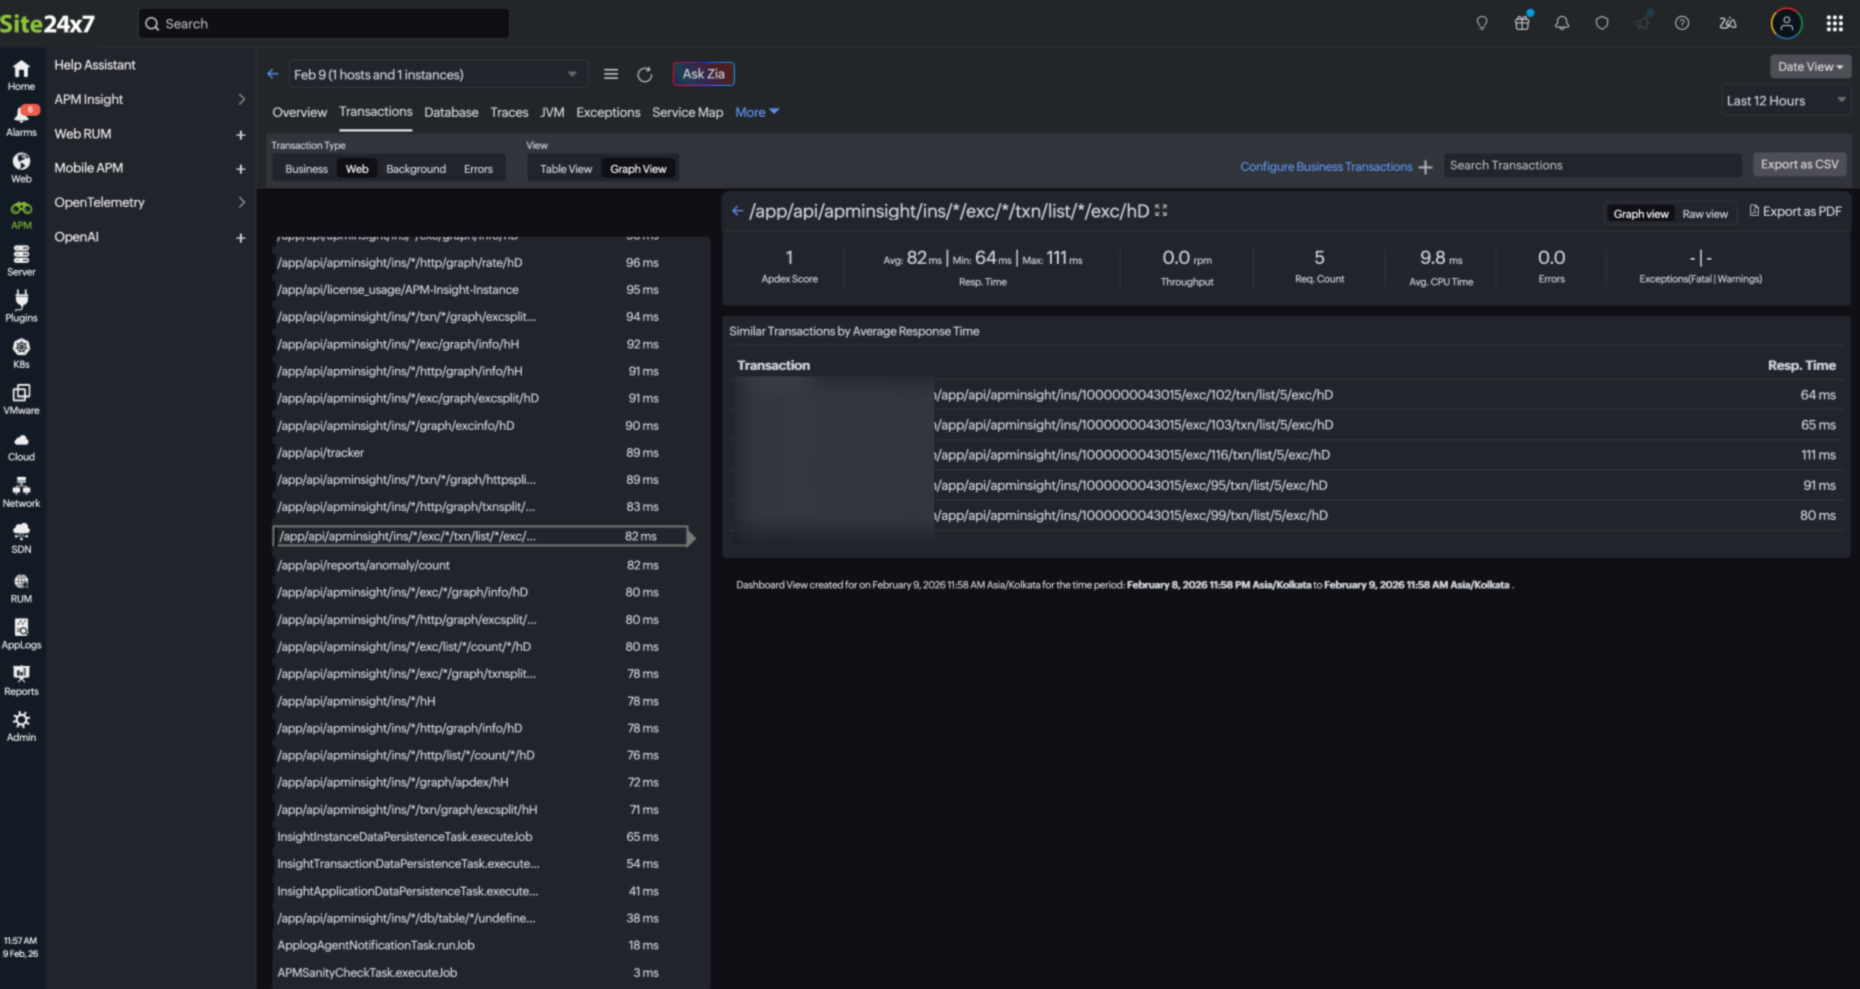
Figure 4: Similar Transaction by Average Response Time widget - When you click on a transaction inside the Similar Transactions by Average Response Time widget, you can see the detailed analysis of the selected transaction.
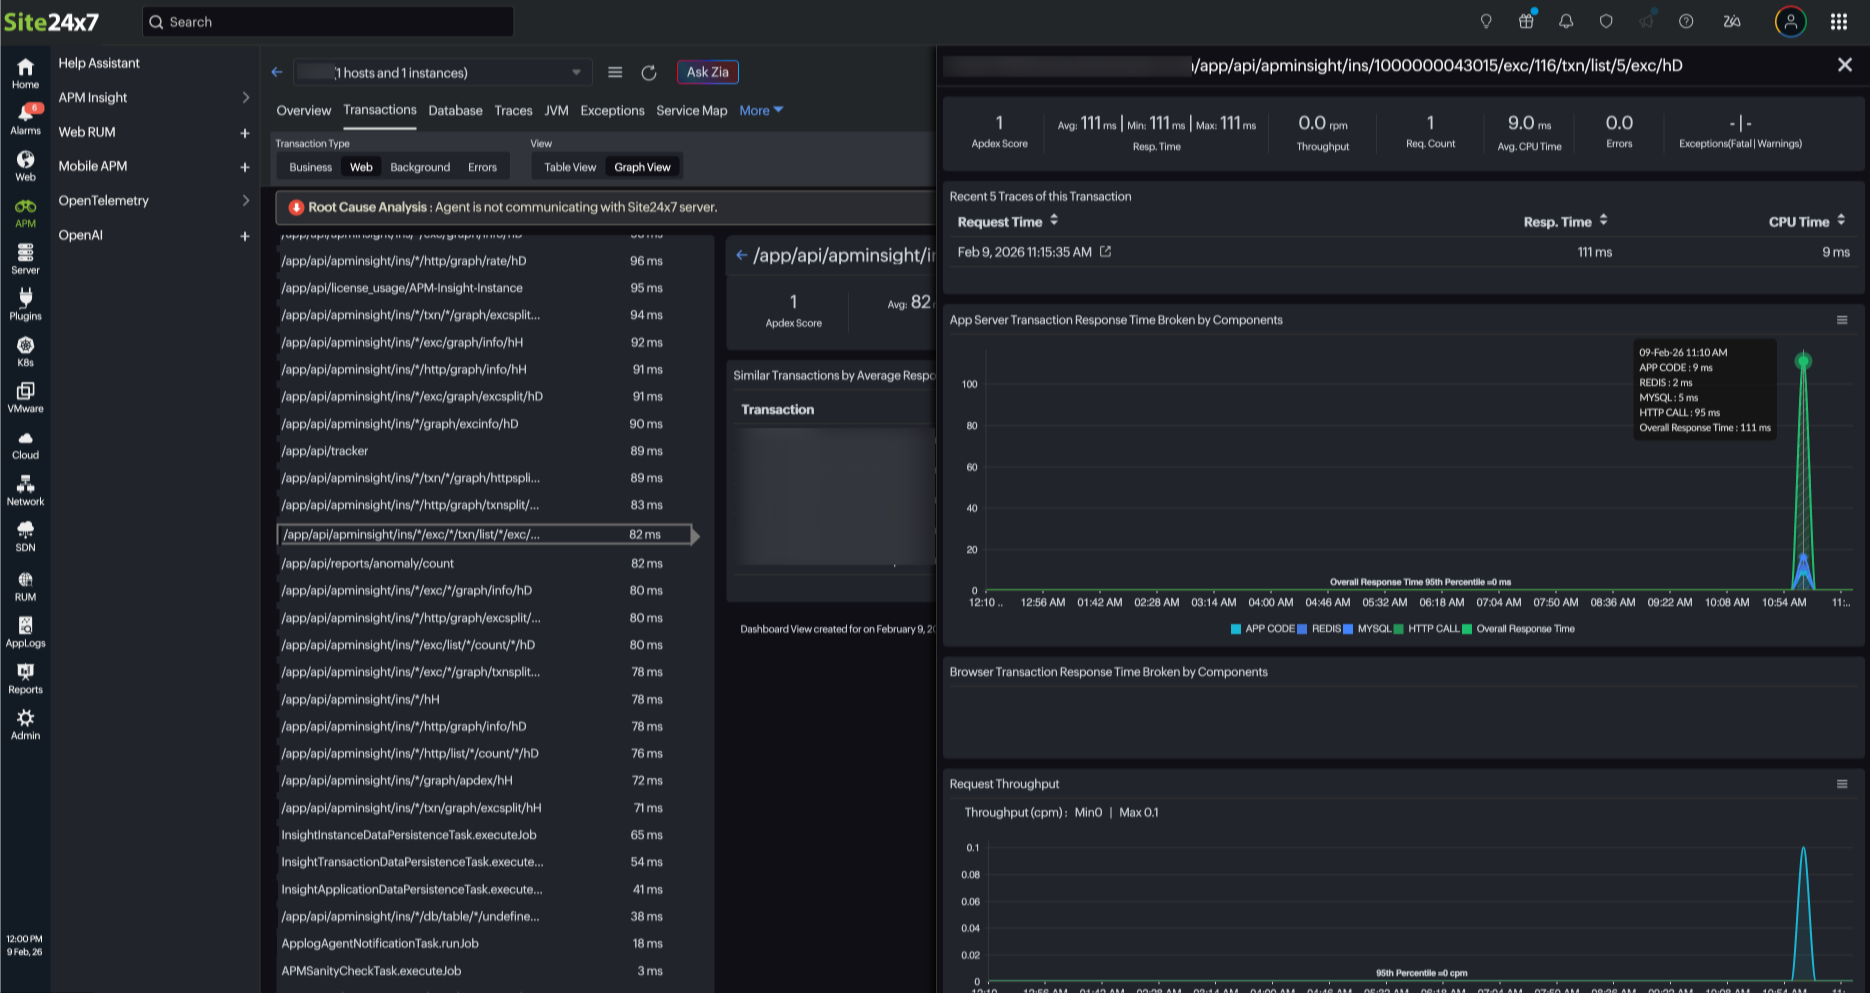
Figure 5: Detailed analysis of the selected transaction from the Similar Transaction by Average Response Time widget
Key points to note
- This feature is only available for the Enterprise customers upon request. If you would like to enable it for your account, please get in touch with the Site24x7 Support team at support@site24x7.com for assistance.
- Enabling this feature will increase your license usage, as it captures a higher volume of trace data for comprehensive monitoring.
- The trace data storage will be consumed from your purchased log space. Assume you have purchased 10GB log space and a seven-day retention period.
- Log space: The trace data uses this 10GB capacity.
- Trace lifetime: If a trace is captured on a Tuesday, it will be automatically removed from the logs on the following Tuesday.
- If the trace data storage exceeds the purchased log space, the new traces will not be stored. However, the agent will continue to communicate with the client as usual. You can delete older traces to free up space for storing new data.
Related article
