APM Groups
If your application follows a microservice architecture or has a cluster of dependent applications, you can consolidate them under APM Groups and view their performance under APM Group reports. The Apdex score and response time of your microservices or dependent applications will be shown in APM Group reports.
Creating APM Groups
APM monitor groups can be created either from the Site24x7 client or from the apminsight.conf configuration file.
Creating APM Groups via Site24x7 client
- Log in to Site24x7.
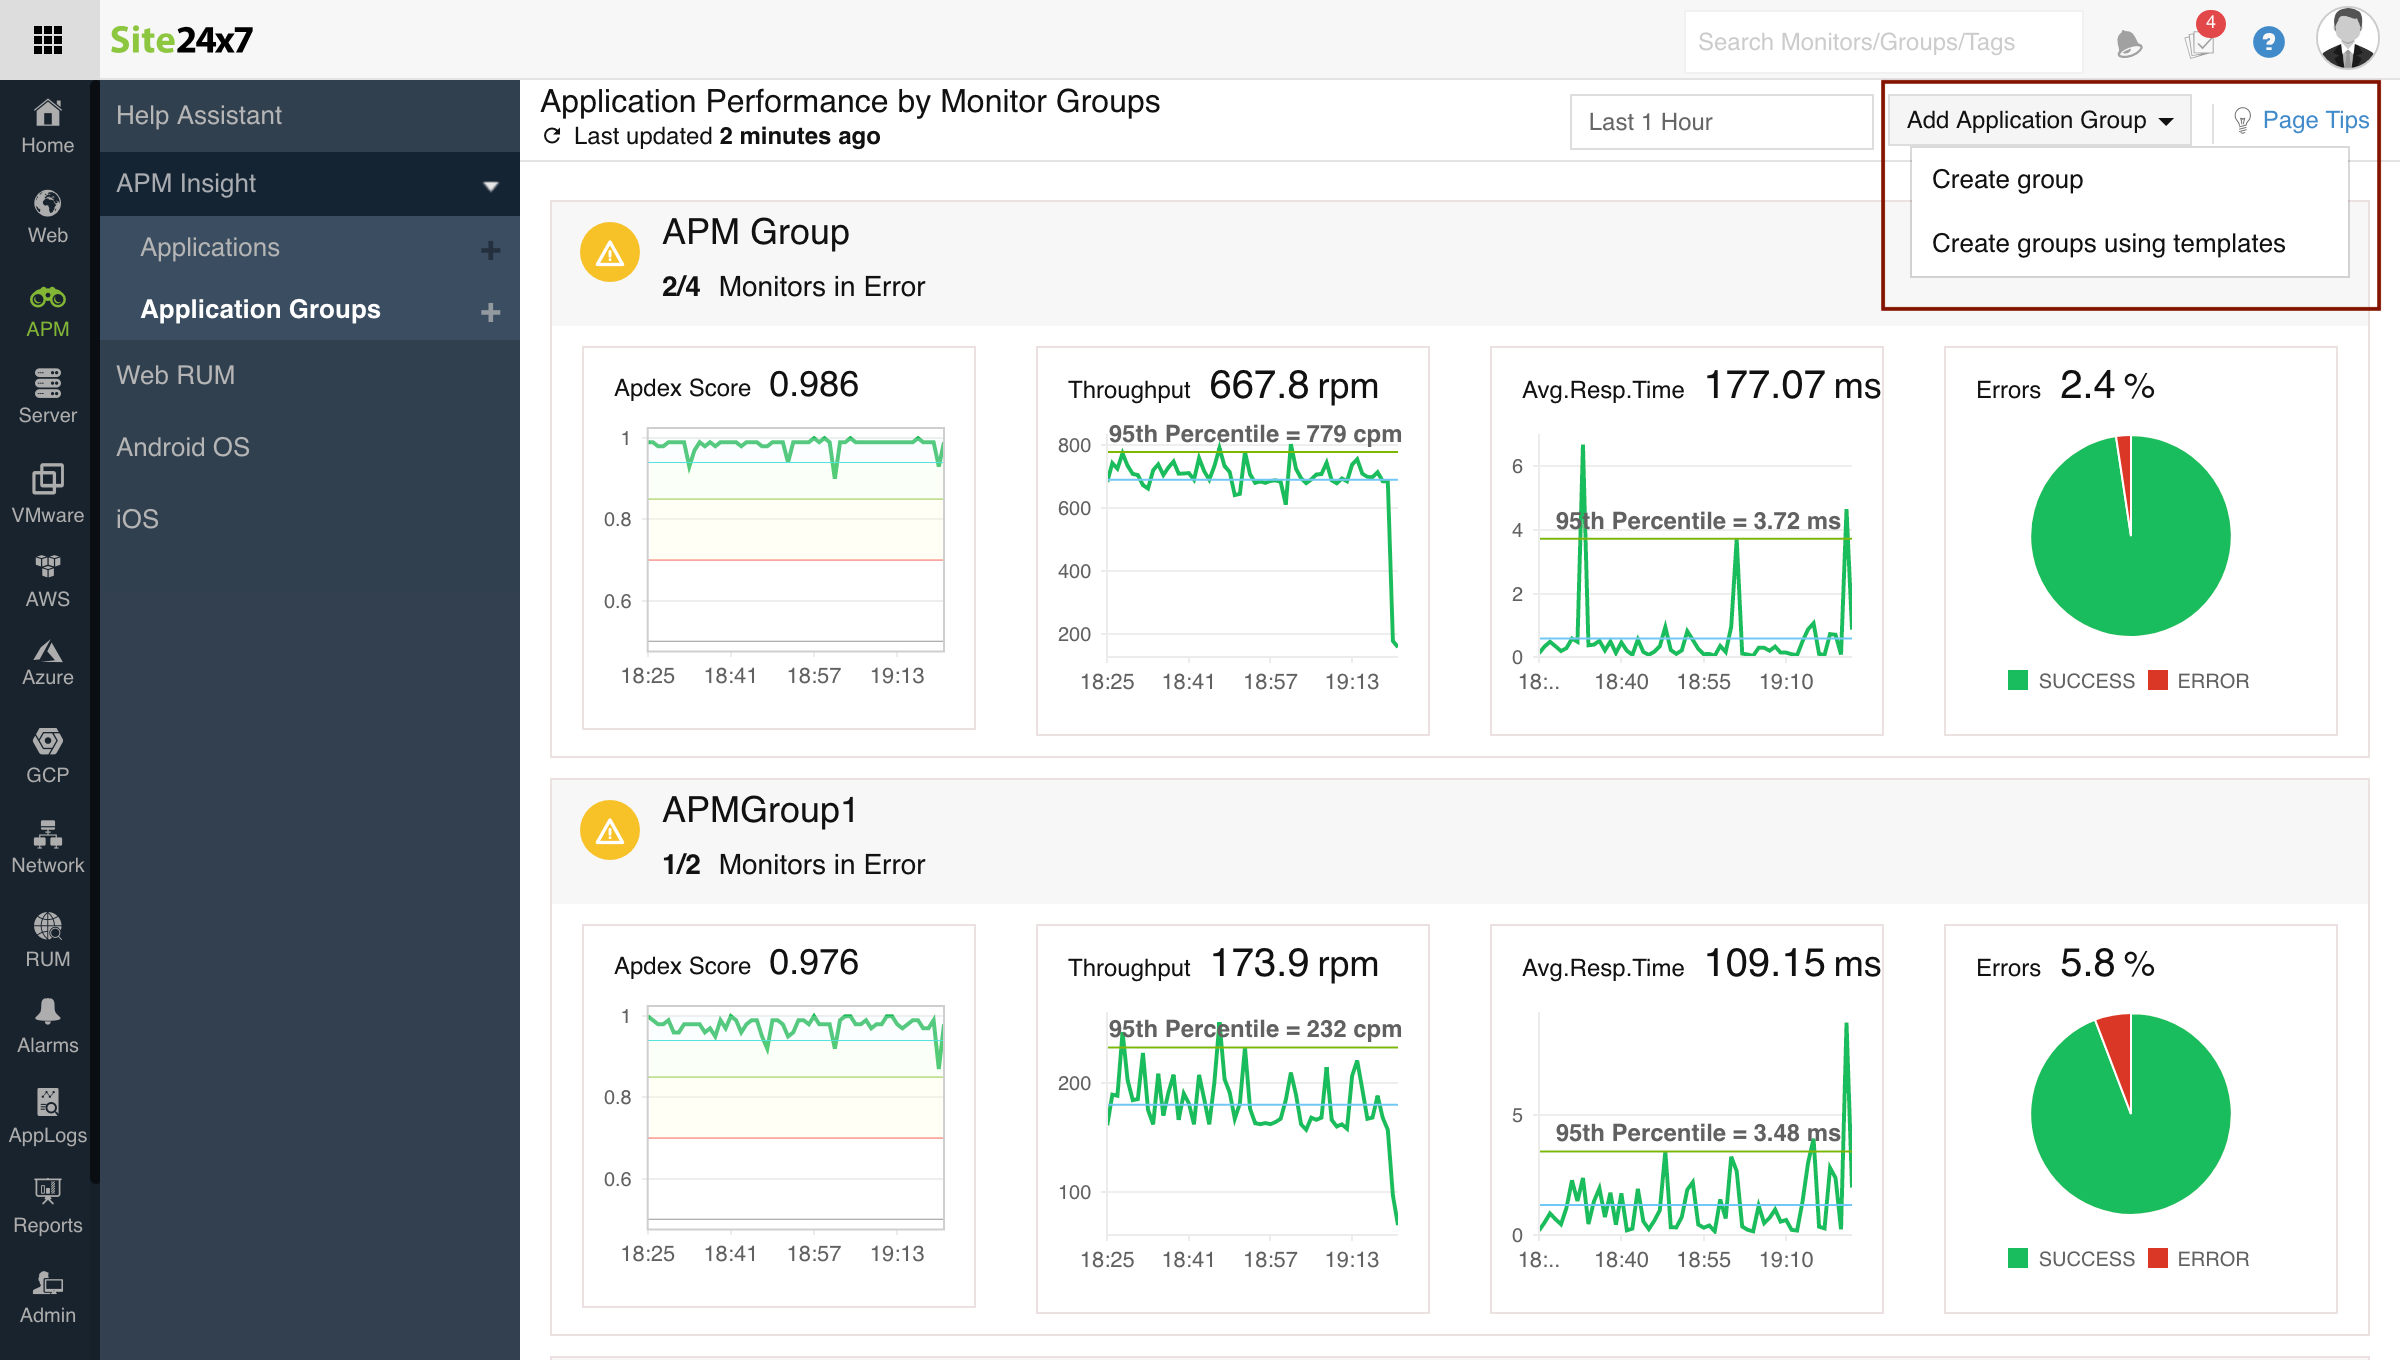
- Go to APM > Application Groups > Add monitor groups (+).

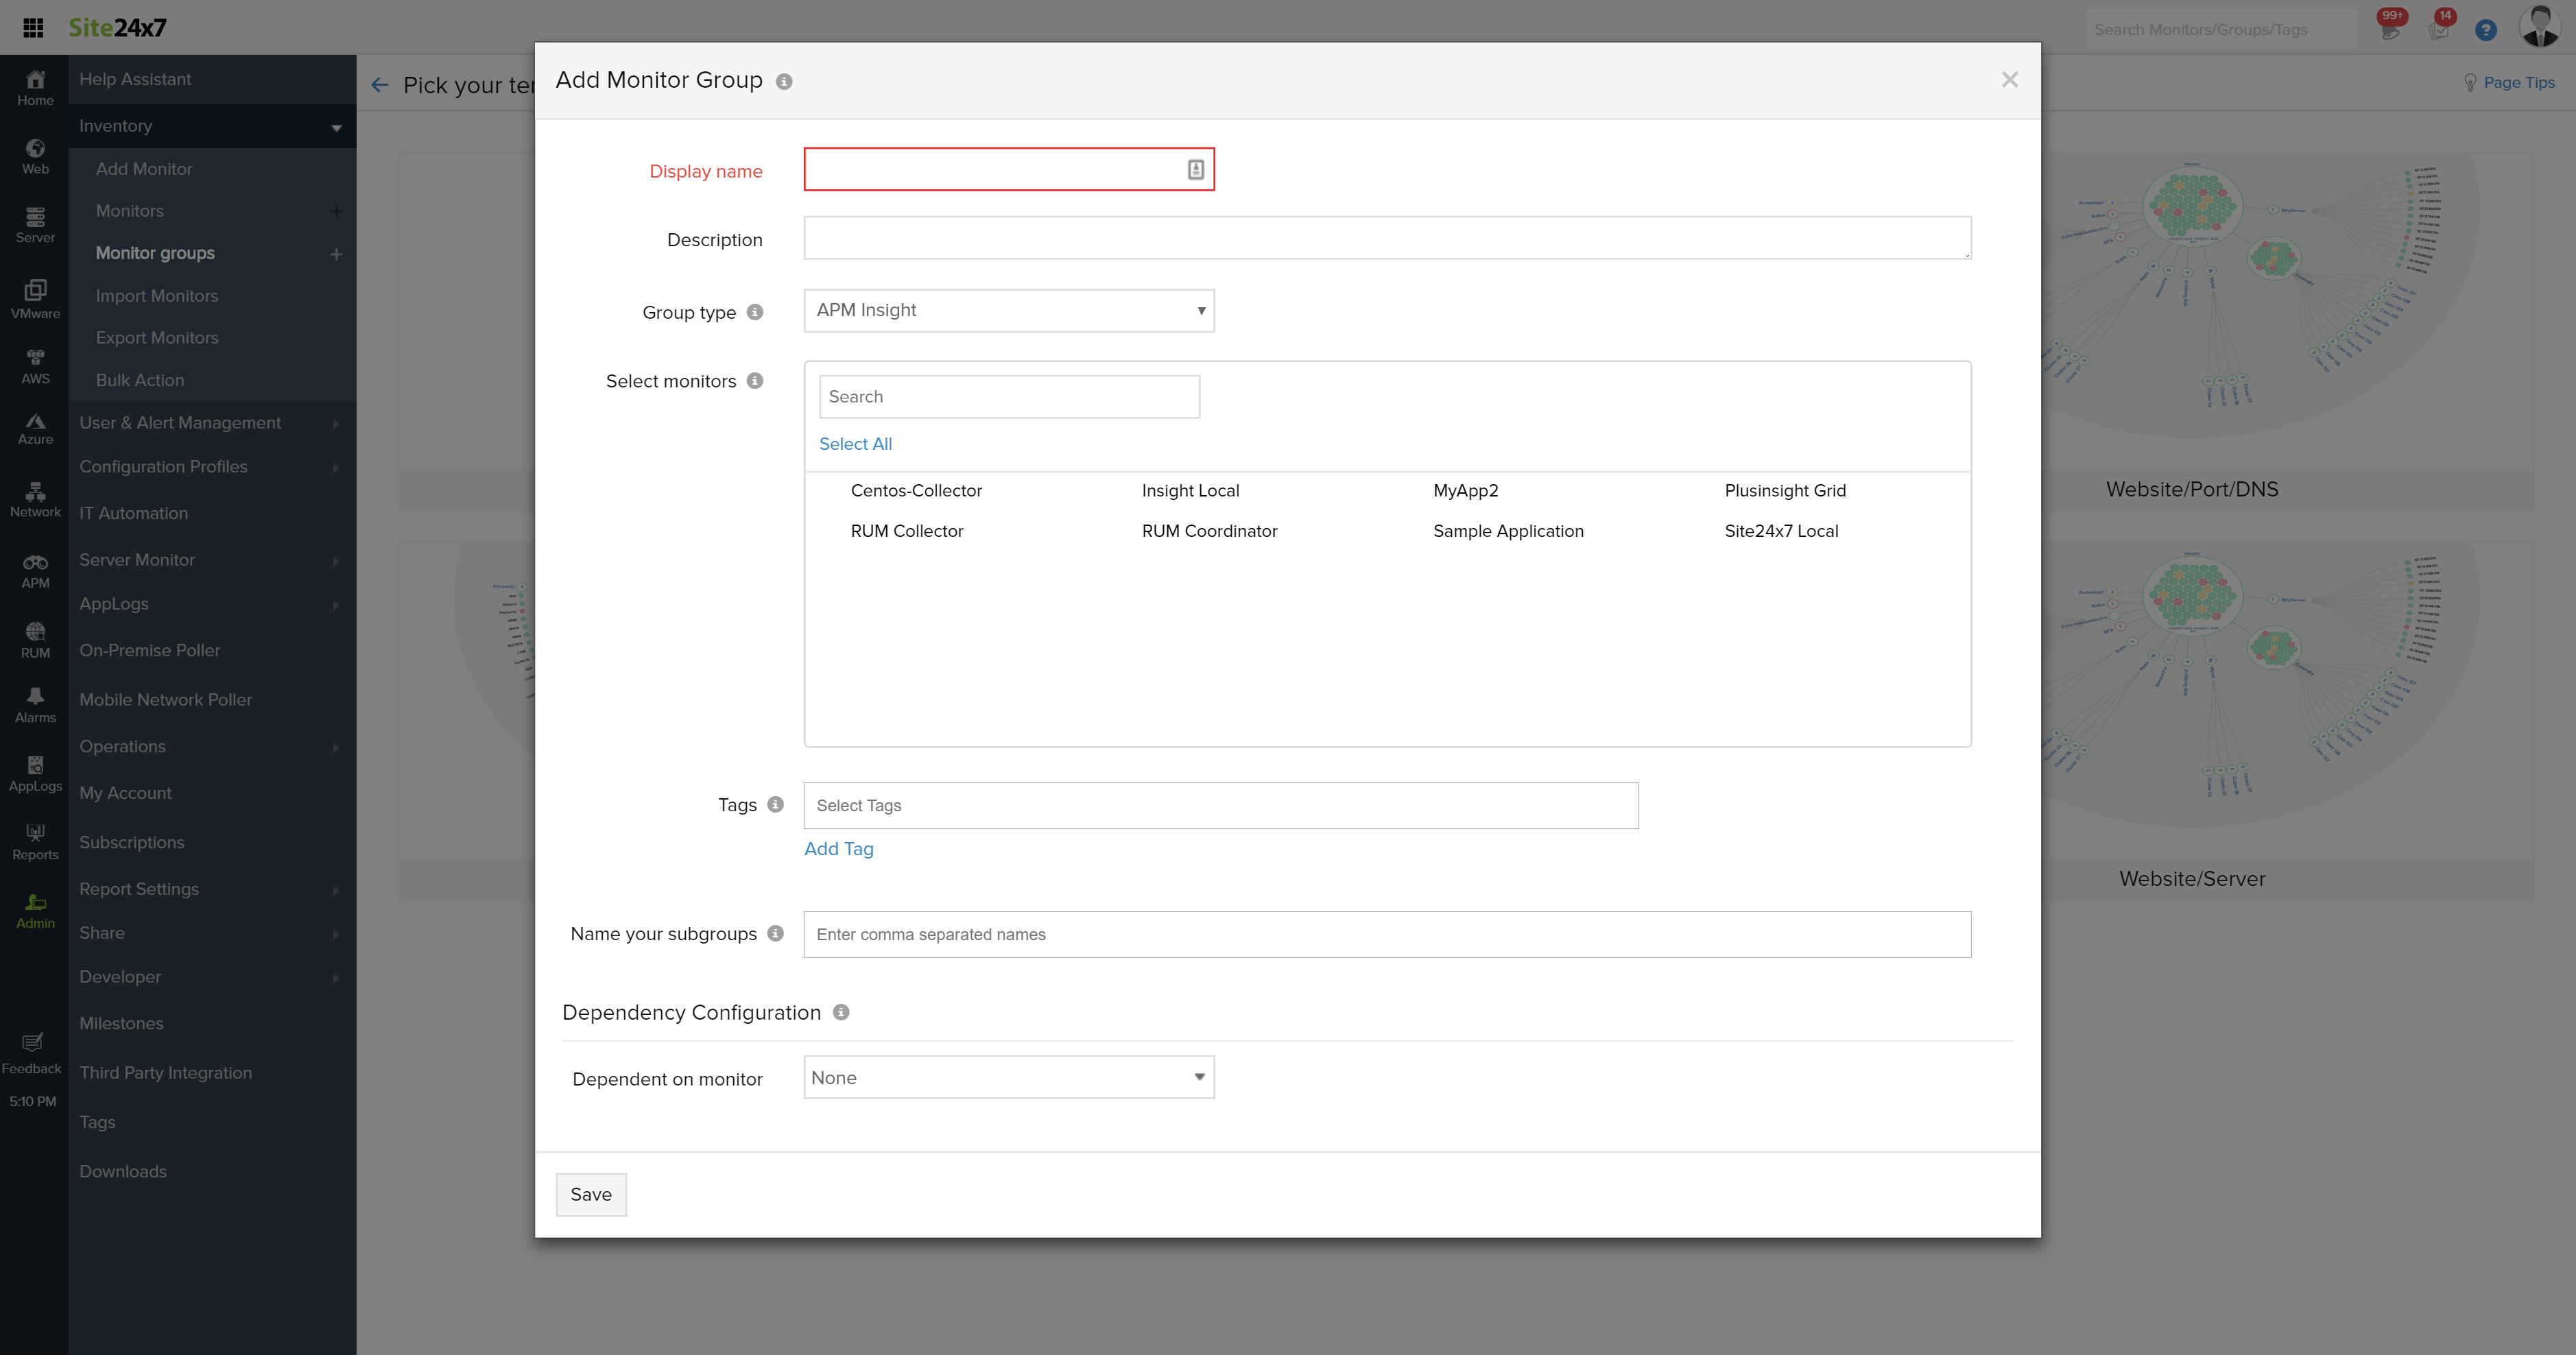
- Enter your group name in the Display Name field and add a description for your reference.
- Under Group type, select APM Insight.
- Choose the respective APM monitors for the respective group.
- Click Save.

Associating an APM monitor with APM Groups
You can also associate an APM Insight monitor to an existing APM monitor group. To do so:
- Log in to Site24x7, then go to Add monitor > Monitor groups.
- Choose the monitor group in which you want to associate an APM monitor.
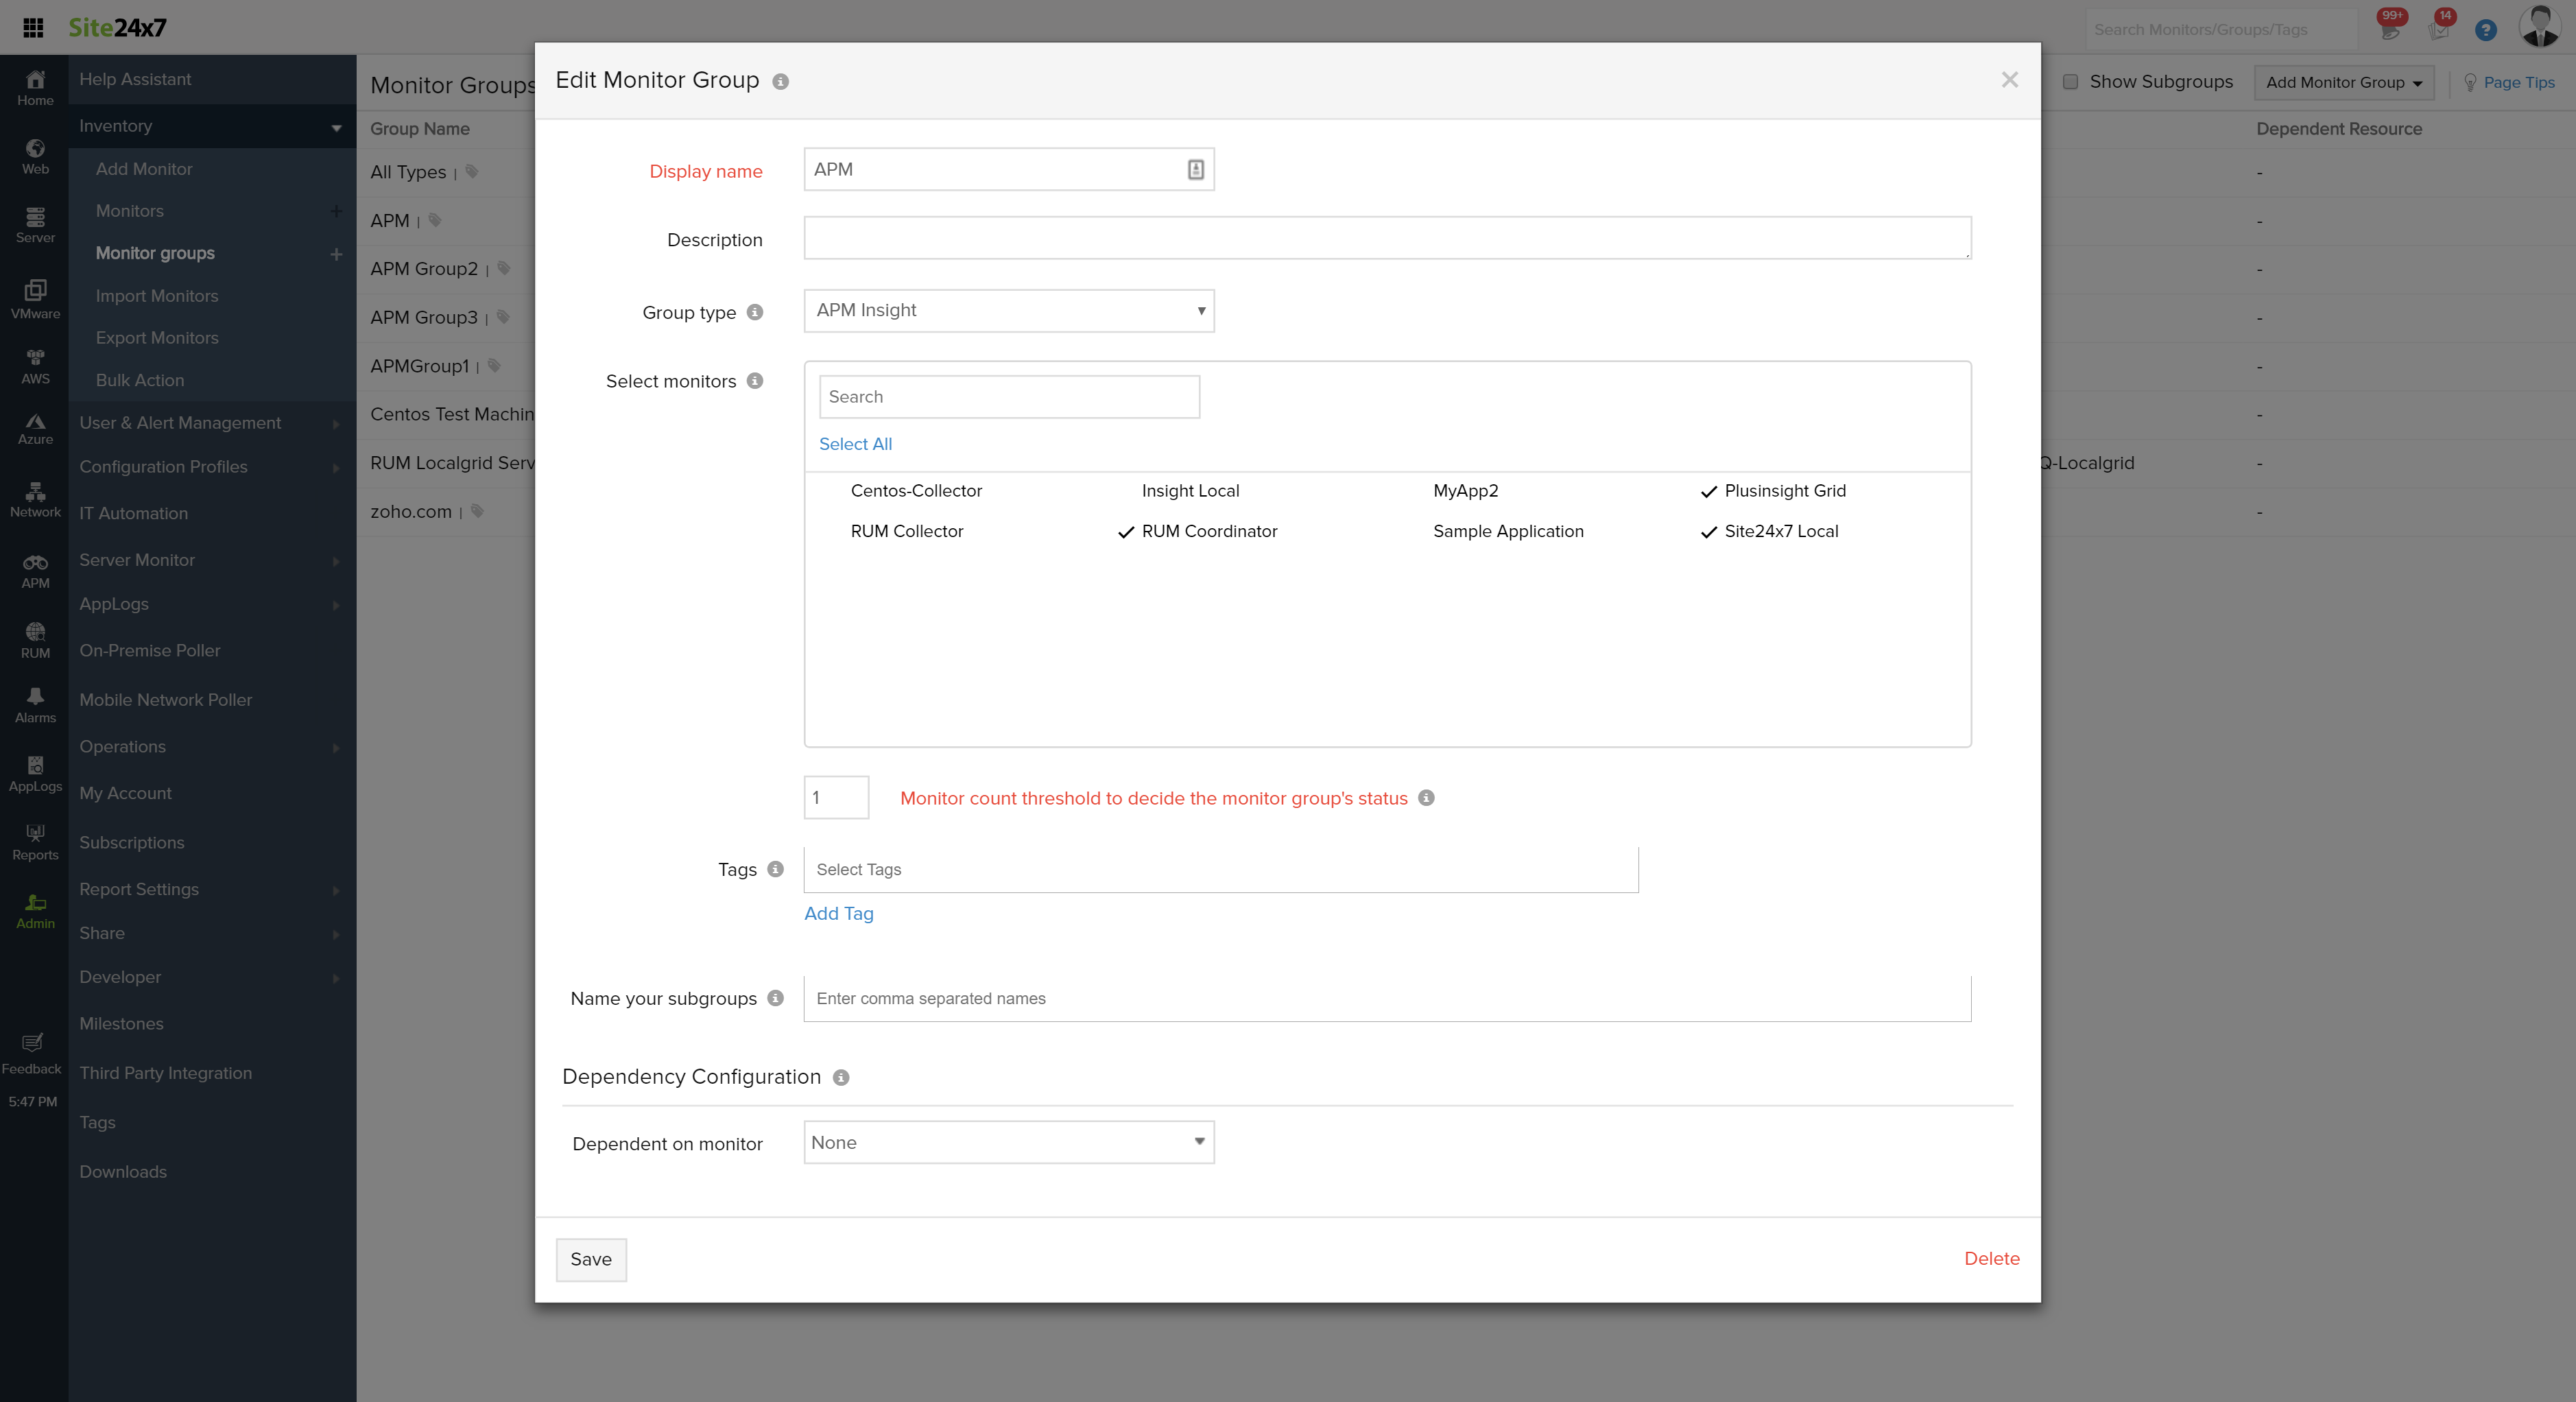
- In Edit monitor group, ensure that the group type is set as APM Insight.
- Select the APM Insight monitors that you want to associate with the group.
- Click Save.

Creating an APM group via a configuration file
To create APM monitor groups from a configuration file, update the apminsight.conf file with the following attributes:
application.group.name = <group name>
You can insert this attribute anywhere in the apminsight.conf file. Insert your APM monitor group name in the place of <group name>.
- You can create multiple APM monitor groups by entering the group names as comma-separated values.
- If the APM group is already available, the corresponding APM Insight monitor will be associated with it. If not, an APM Group will be created with the specified name for the corresponding APM Insight monitor.
Metrics monitored
Application performance metrics and Application Dependency Maps are shown along with the other metrics of a monitor group for application groups.
Application performance metrics:
The following metrics are captured for application groups:
- Average response time and throughput of all applications
- Average response time and throughput of top 5 applications in the group
- Top 5 errors and exceptions across the application group
- Total component count and component count across the applications
- Response time of components across applications
Application Dependency Maps:
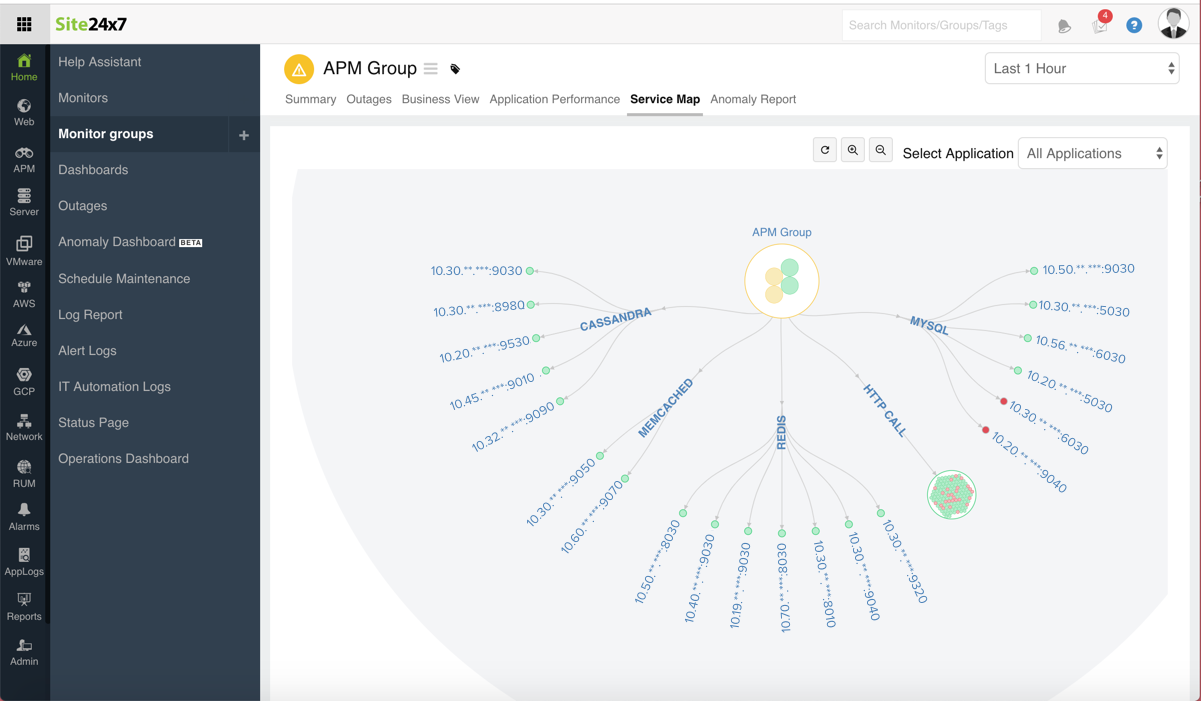
Application dependency maps shows the status of all applications in your application group along with the average response time, throughput, total request count, and failed request count for each node. You can view the application dependency map for all applications as well as for individual applications in the respective application group. Read more about application dependency maps here.

Using tags for APM applications
You can use tags for easier identification and accessibility of your monitors.
Refer to our documentation to create tags via a Site24x7 client.
To create tags via the apminsight.conf file, add the following attribute:
tags=<key1>:<value1>, <key2>:<value2>
To create more than one tag for the same monitor, provide the tag names as comma-separated values.
Viewing APM Group reports
To view APM Group performance reports:
- Log in to Site24x7, then go to Reports > APM Reports.
- Click on Application performance reports by APM Groups to see group-wise performance reports.
- Alternatively, you can also access the APM Group reports by navigating to Reports > Monitor Groups > Application performance reports by APM groups.
If you have an APM Insight application associated with any monitor group, it'll be treated as an APM monitor group. This means that reports on those groups will be shown here.
