
The Topology View for Akamai Cloud monitoring
The Topology View provides an interactive overview of your Akamai Cloud footprint, organized by account, region, and service. Rather than switching between dashboards for Linode instances, NodeBalancers, or Managed Databases, you can view all resources together on a single canvas.
Visualizing the connections between your compute, storage, network, and database resources helps you assess the potential impact of incidents. Clear visibility from the account level to individual resources accelerates incident response.
How it works
The Topology View displays your monitored Akamai Cloud resources in an interactive graph organized into the following levels:
- Account level: Represents each Akamai Cloud account connected to the monitoring console.
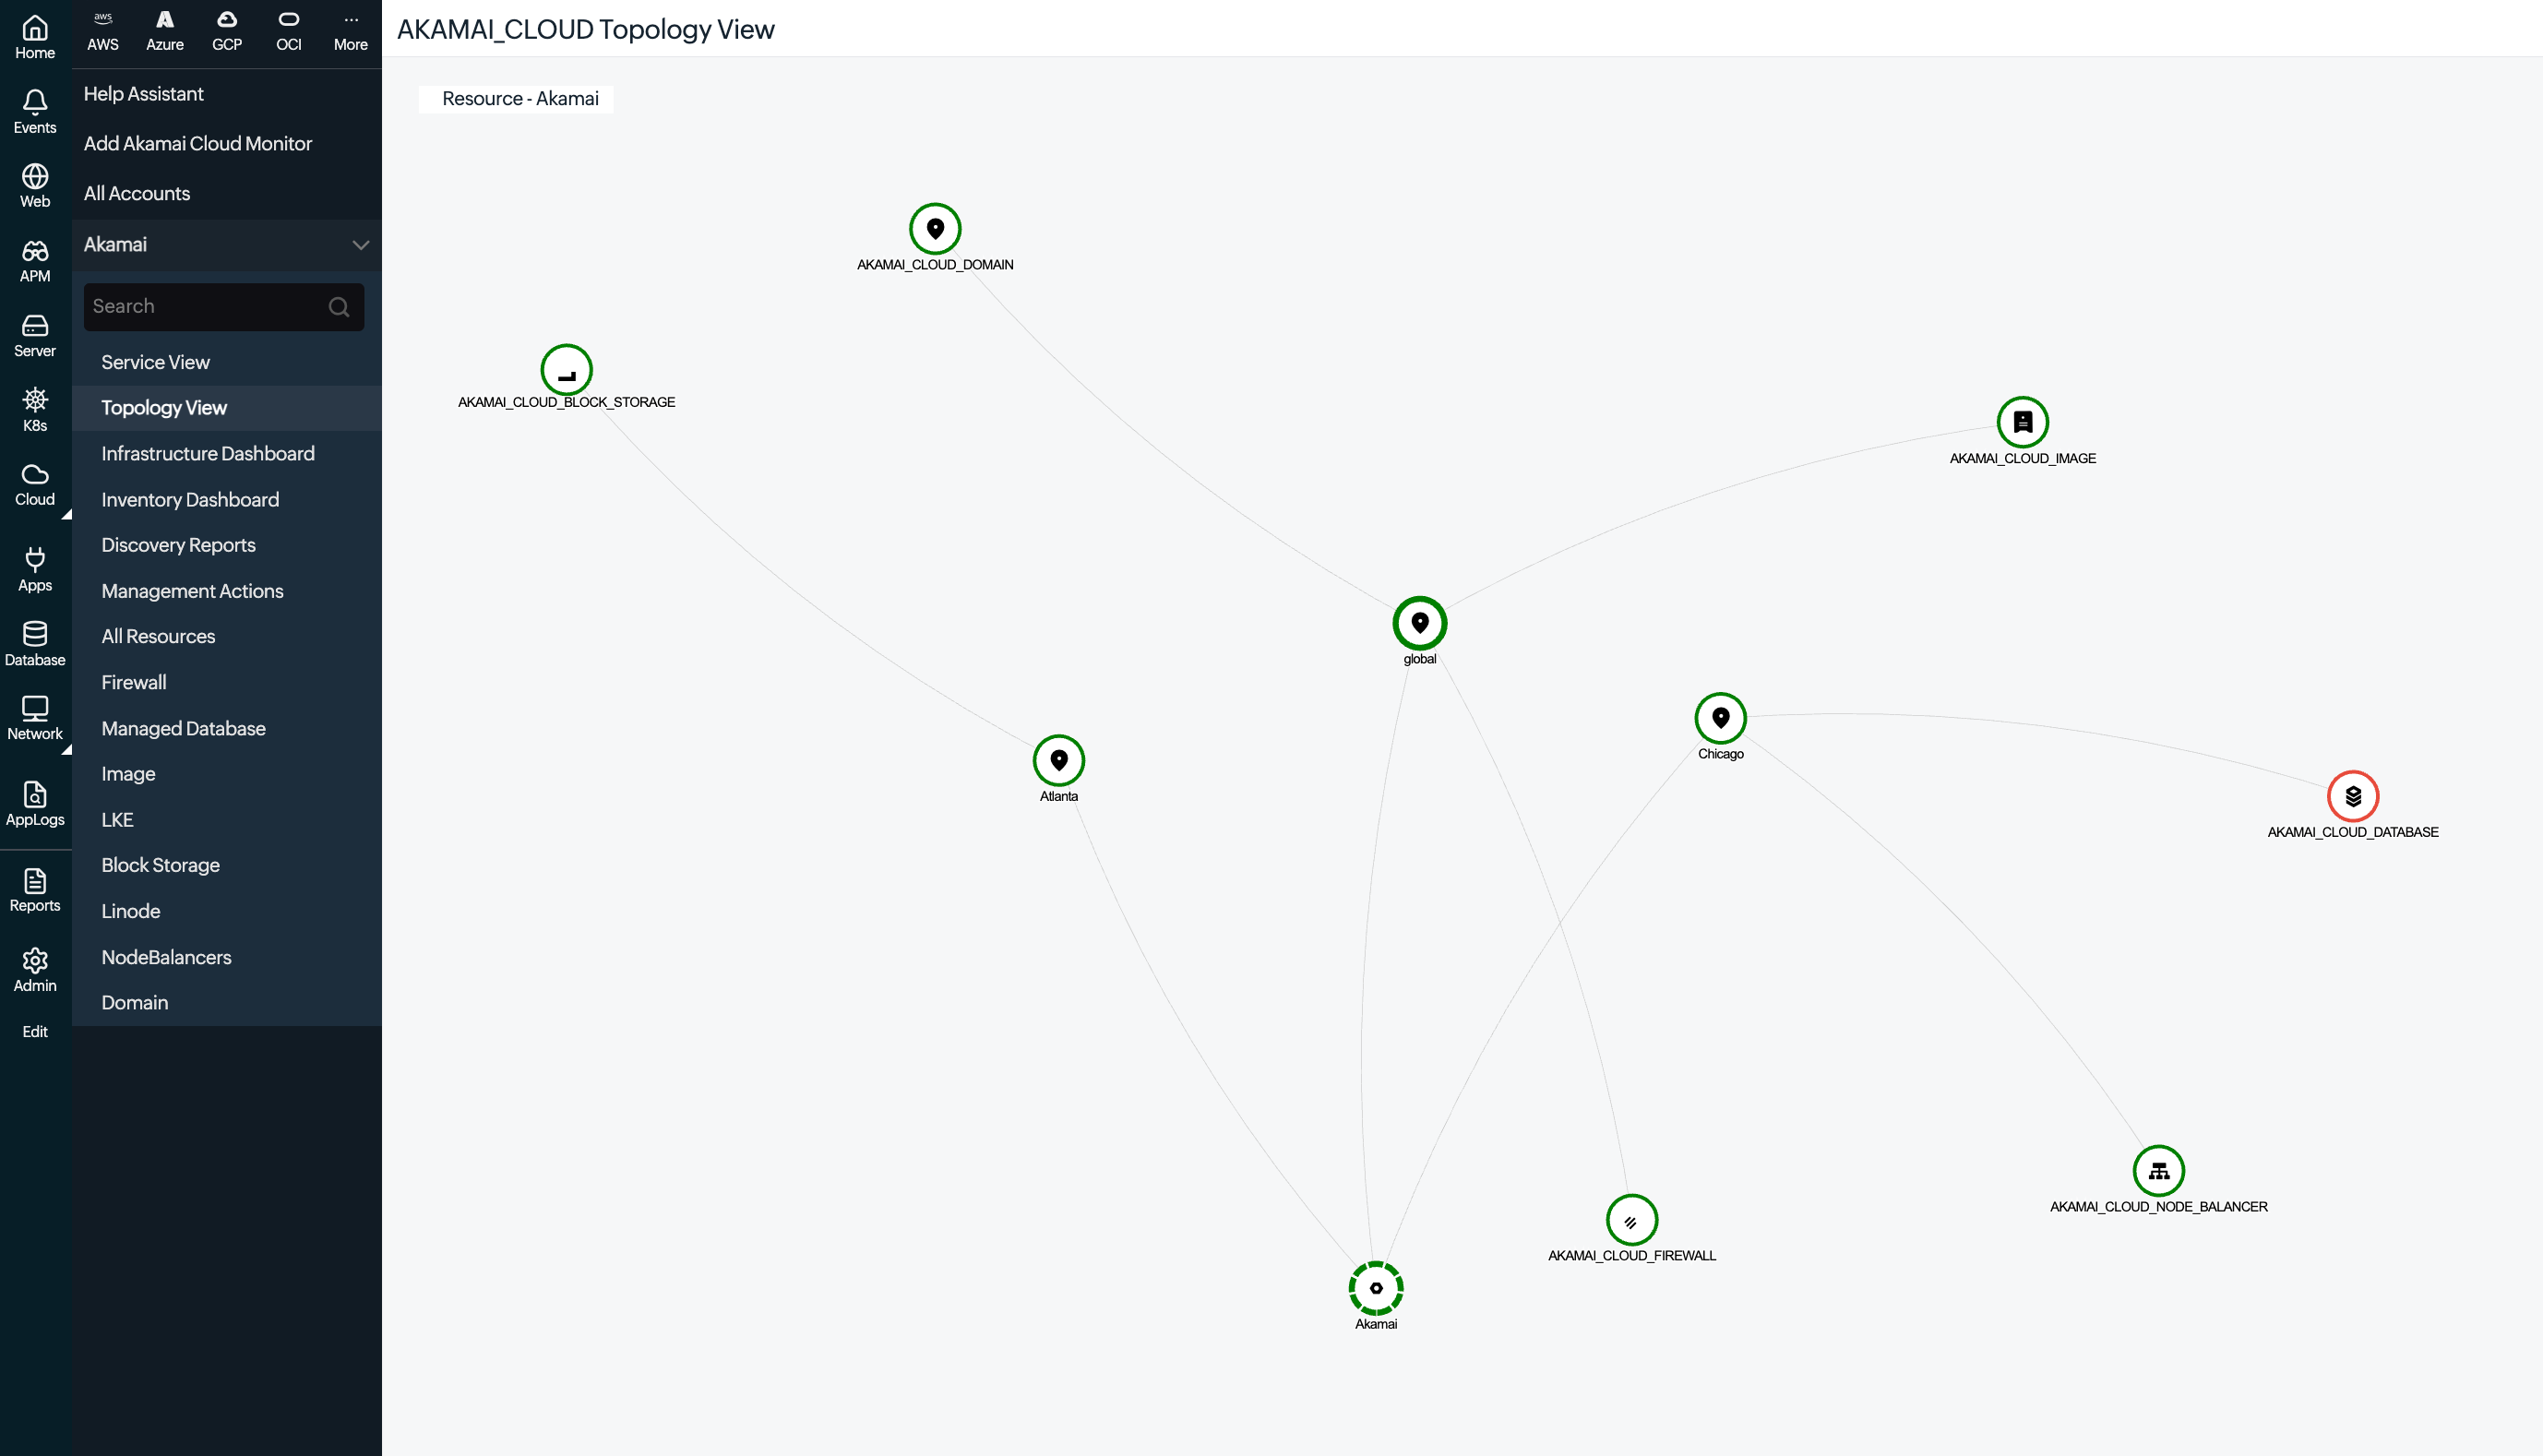
- Region level: Groups resources by the Akamai Cloud data center where they are hosted, such as Atlanta or Chicago.
- Service type level: Organizes resources by the service, such as Linode, NodeBalancers, Managed Databases, and Block Storage, within each region to simplify navigation and health monitoring.
Use case
Imagine a media streaming provider uses Akamai Cloud for regional edge servers and deploys Linode instances behind NodeBalancers across multiple data centers to minimize playback latency. During a live broadcast, viewers in the central United States report buffering.
Instead of checking each Linode instance and NodeBalancer individually, the operations team uses the Topology View in the Akamai Cloud monitor. The graph immediately highlights a critical issue at the Chicago data center. Upon further inspection, the team finds one NodeBalancer in the region with degraded back-end health.
After identifying the affected NodeBalancer, the team reroutes traffic to a healthy back end and restarts the problematic Linode instance. Playback returns to normal within minutes. The Topology View enables the team to isolate the issue to a specific region and resource quickly, eliminating the need to check every node manually.
Benefits of the Topology View
The Topology View offers the following capabilities:
- Single-pane visibility: View all monitored Akamai Cloud accounts, regions, and services in a single interactive graph.
- Faster fault isolation: Identify affected regions or services instantly using the color-coded health status, eliminating the need to check each resource separately.
- Simplified navigation: Access specific resources directly without searching through multiple monitoring dashboards.
- Operational awareness: Monitor the resource distribution and performance across all accounts and regions from a single location.
How to access the Topology View
To open the Topology View, follow the steps below:
- Log in to you account.
- Navigate to Cloud > Akamai. Select the required Akamai monitor.
- Click Topology View on the left menu.
Interacting with the Topology View
Once you've opened the Topology View, you can use the following:
Root node
Your Akamai Cloud account appears as the root node, marked by a double circle, at the center of the graph. The view automatically zooms and centers on this node so you always have a fixed starting point before drilling into regions and services.
Radial node layout
Nodes branch outward from the account in a radial layout, first into data center regions, then into the individual services running in each. This layout keeps the path from the account to a resource easy to follow, even as the graph grows.
Zoom and pan controls
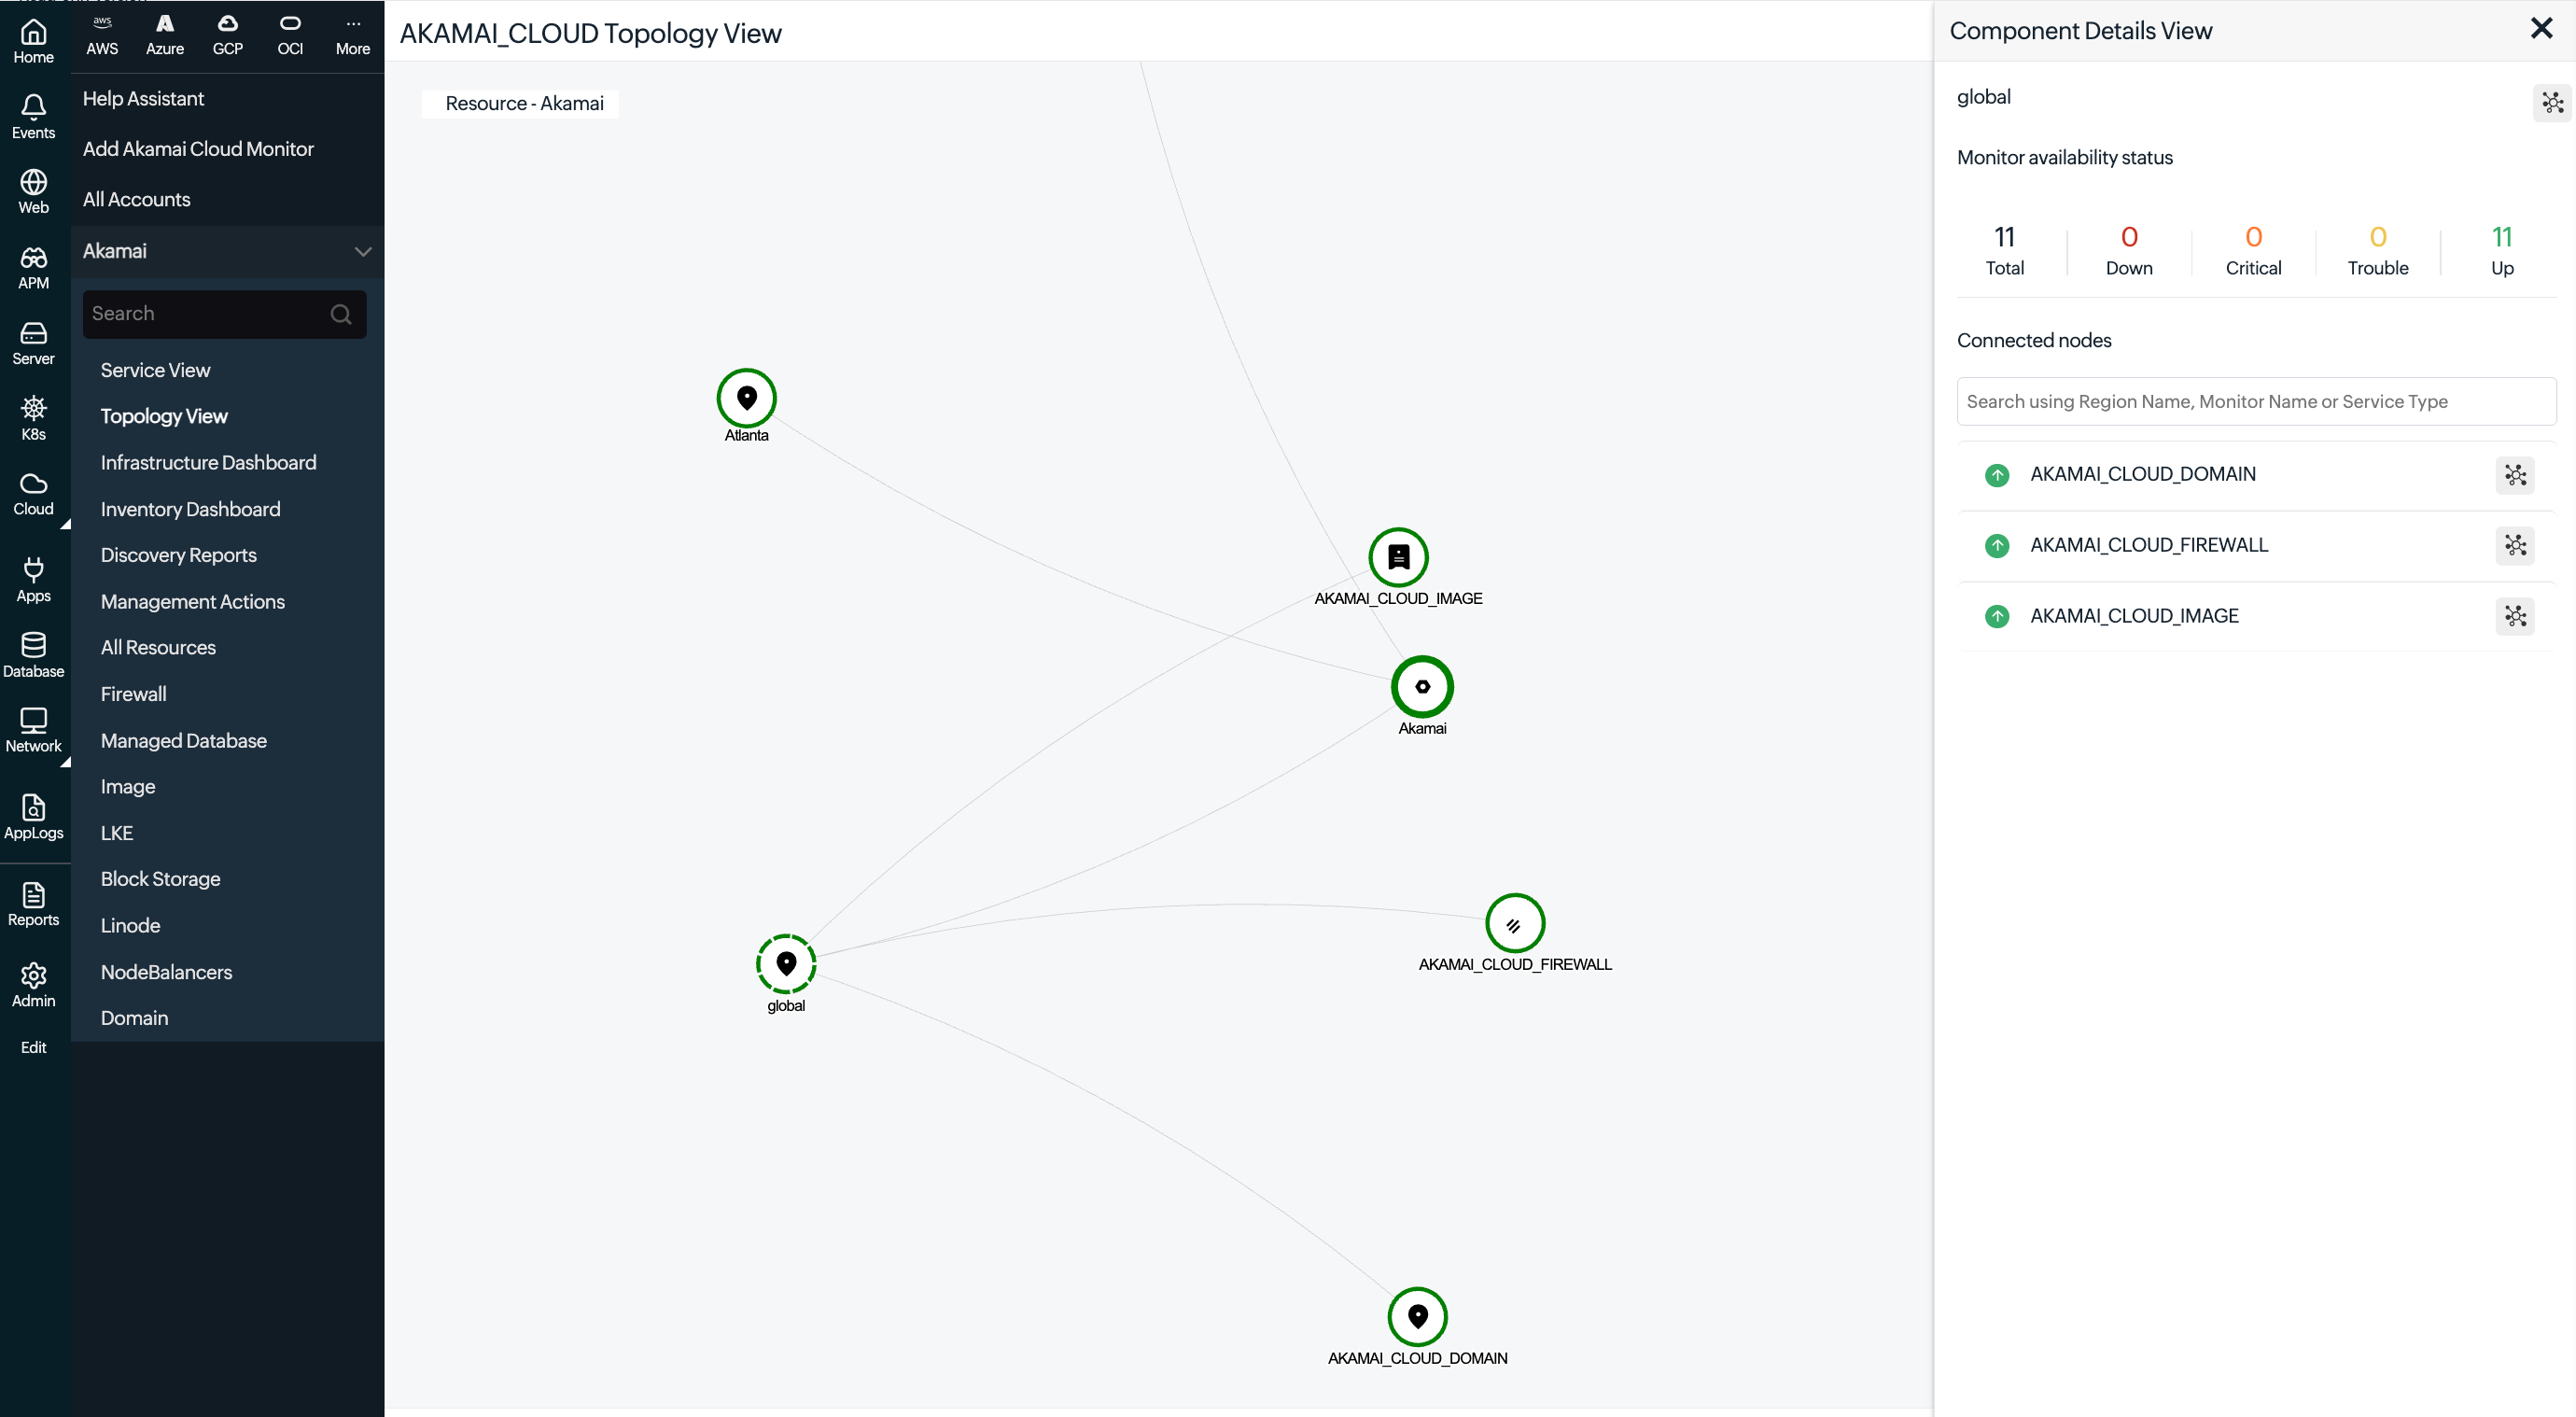
Use your mouse or the on-screen controls to zoom in on dense clusters or pan across a large graph without losing your place.
Region exploration
Zoom in on a specific data center node to reveal the services and resources running there along with how they connect to one another.
Health status legend
The legend explains the color-coding used throughout the graph, so you can gauge a resource's health, such as Normal, Warning, or Critical, without opening it.
Node tooltip
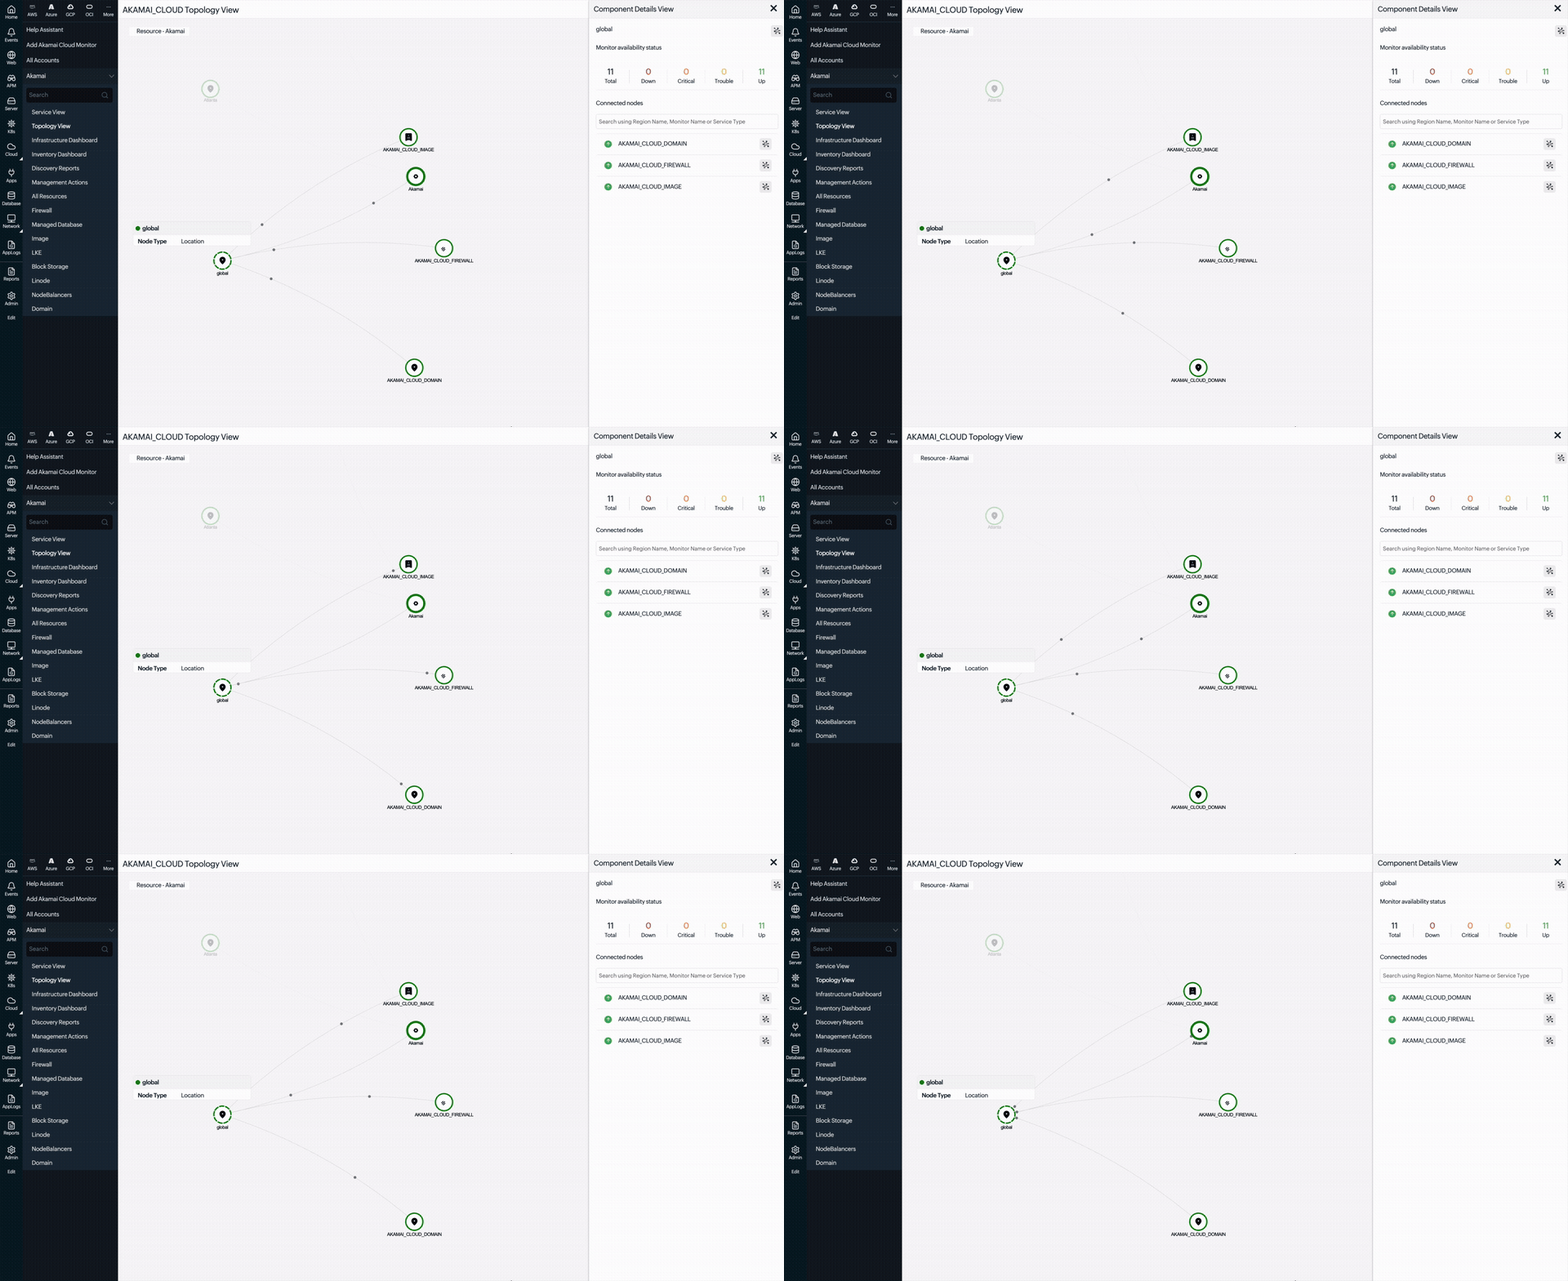
Hover over any node to see its type and location directly on the graph, without clicking it.
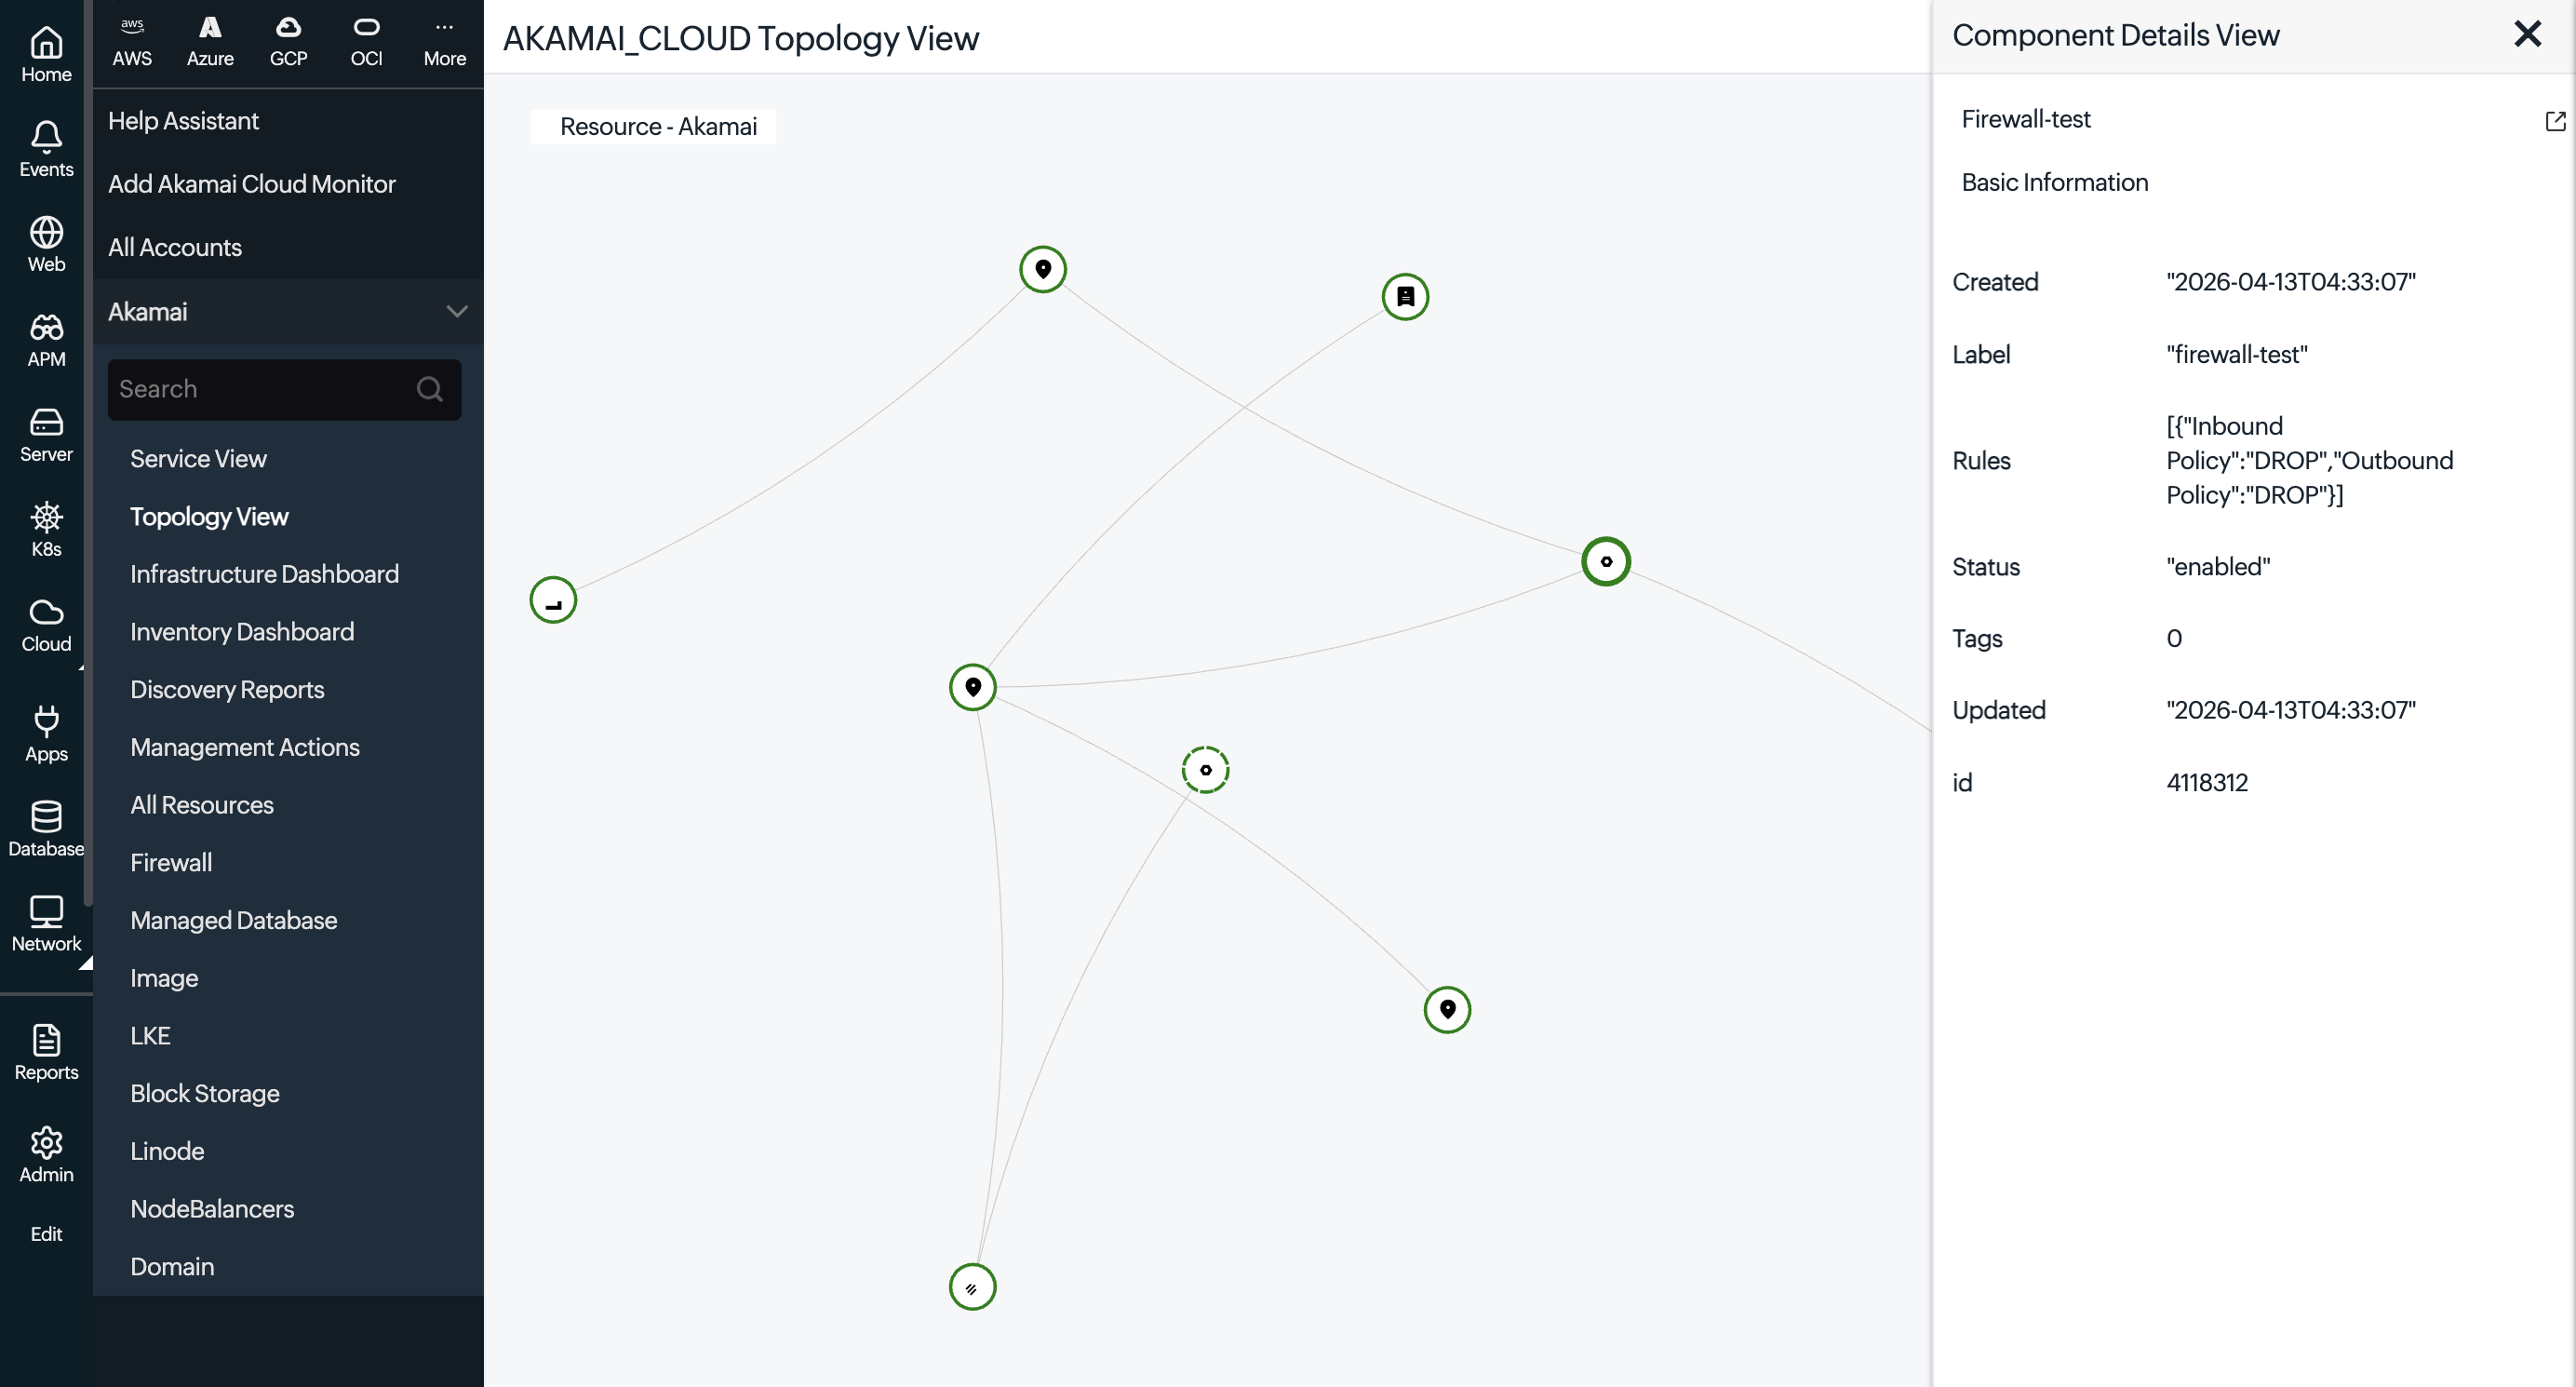
Component Details View panel
Selecting a node opens a panel on the right with the following details:
- Region or service name: It shows the name of the node you selected.
- Click the View Connections icon
 next to the name to isolate that node and its connected resources.
 - Click the Open in New Tab icon
 next to a service type to jump to its full monitor summary page.
- Click the View Connections icon
- Availability status: This is a live breakdown of monitored resources by the status (Up, Trouble, Critical, and Down) alongside the total count.
- Connected nodes: This is a list of resources linked to the selected node. Select any entry to view its health and configuration.
- Search bar: Filter the panel by the region, service, or monitor name.
- Breakdown list: It shows underlying regions or services with status icons, so failing components stand out immediately.
Mapping how your Akamai Cloud resources depend on one another makes it easier to judge the downstream effect of an issue, cutting down the root cause analysis time across your infrastructure.