Troubleshooting with event correlation
Event correlation connects related events across multiple modules, such as applications, databases, servers, and network components, to form a unified view of an incident. By linking symptoms from different sources, it helps pinpoint the root cause and speed up resolution.
Site24x7 connects related events and lists the probable root causes, which help users validate the cause, drill down for details, assign or automate remediation, communicate status updates, track recurring patterns, and document findings for future reference.
Use cases
The following use cases illustrate how Event Correlation groups related alerts into Problems to enable efficient root cause analysis and streamlined incident troubleshooting.
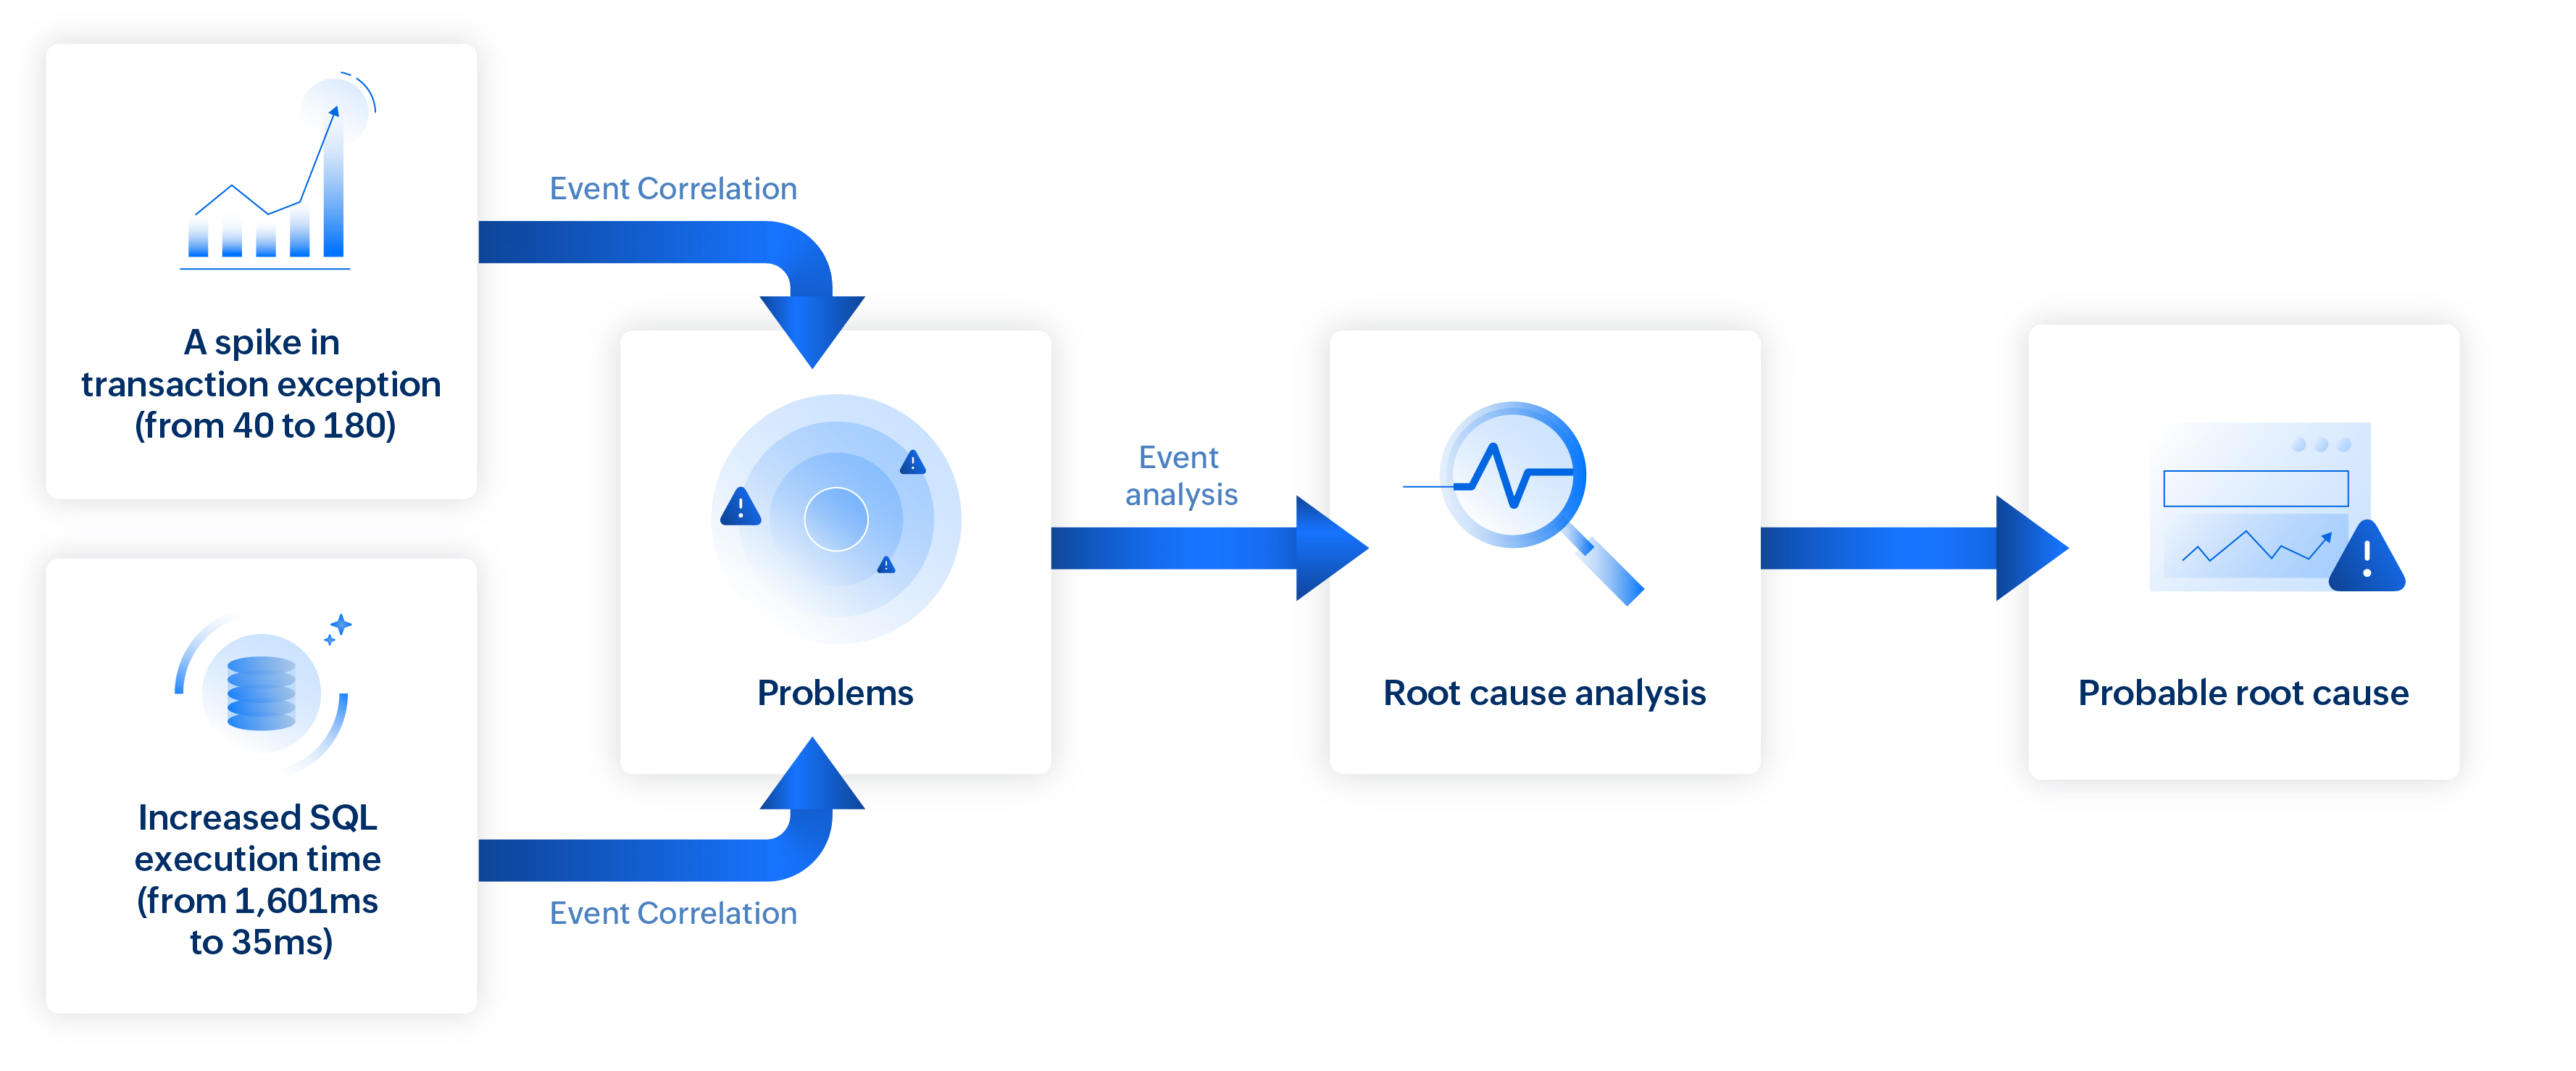
Scenario 1: Pinpoint application performance monitoring bottlenecks
When application performance degrades, pinpointing the exact cause can be challenging. For example, consider a situation where your application’s health suddenly degrades. Event correlation, paired with causal analysis, links related events to uncover the root cause.
In this case:
- A spike in transaction exceptions (from 40 to 180).
- A new SQL timeout exception from the database server.
- Increased SQL execution time (from 1,601ms to 30,105ms).
- Increased response time (from 615 ms to 2,573 ms).
By connecting these issues to a single causal path, the platform enables comparison between failed and successful transaction traces, revealing deviations in execution flow, component delays, and error points.
This targeted insight helps you resolve issues faster, minimize downtime, and ensure consistent service delivery.
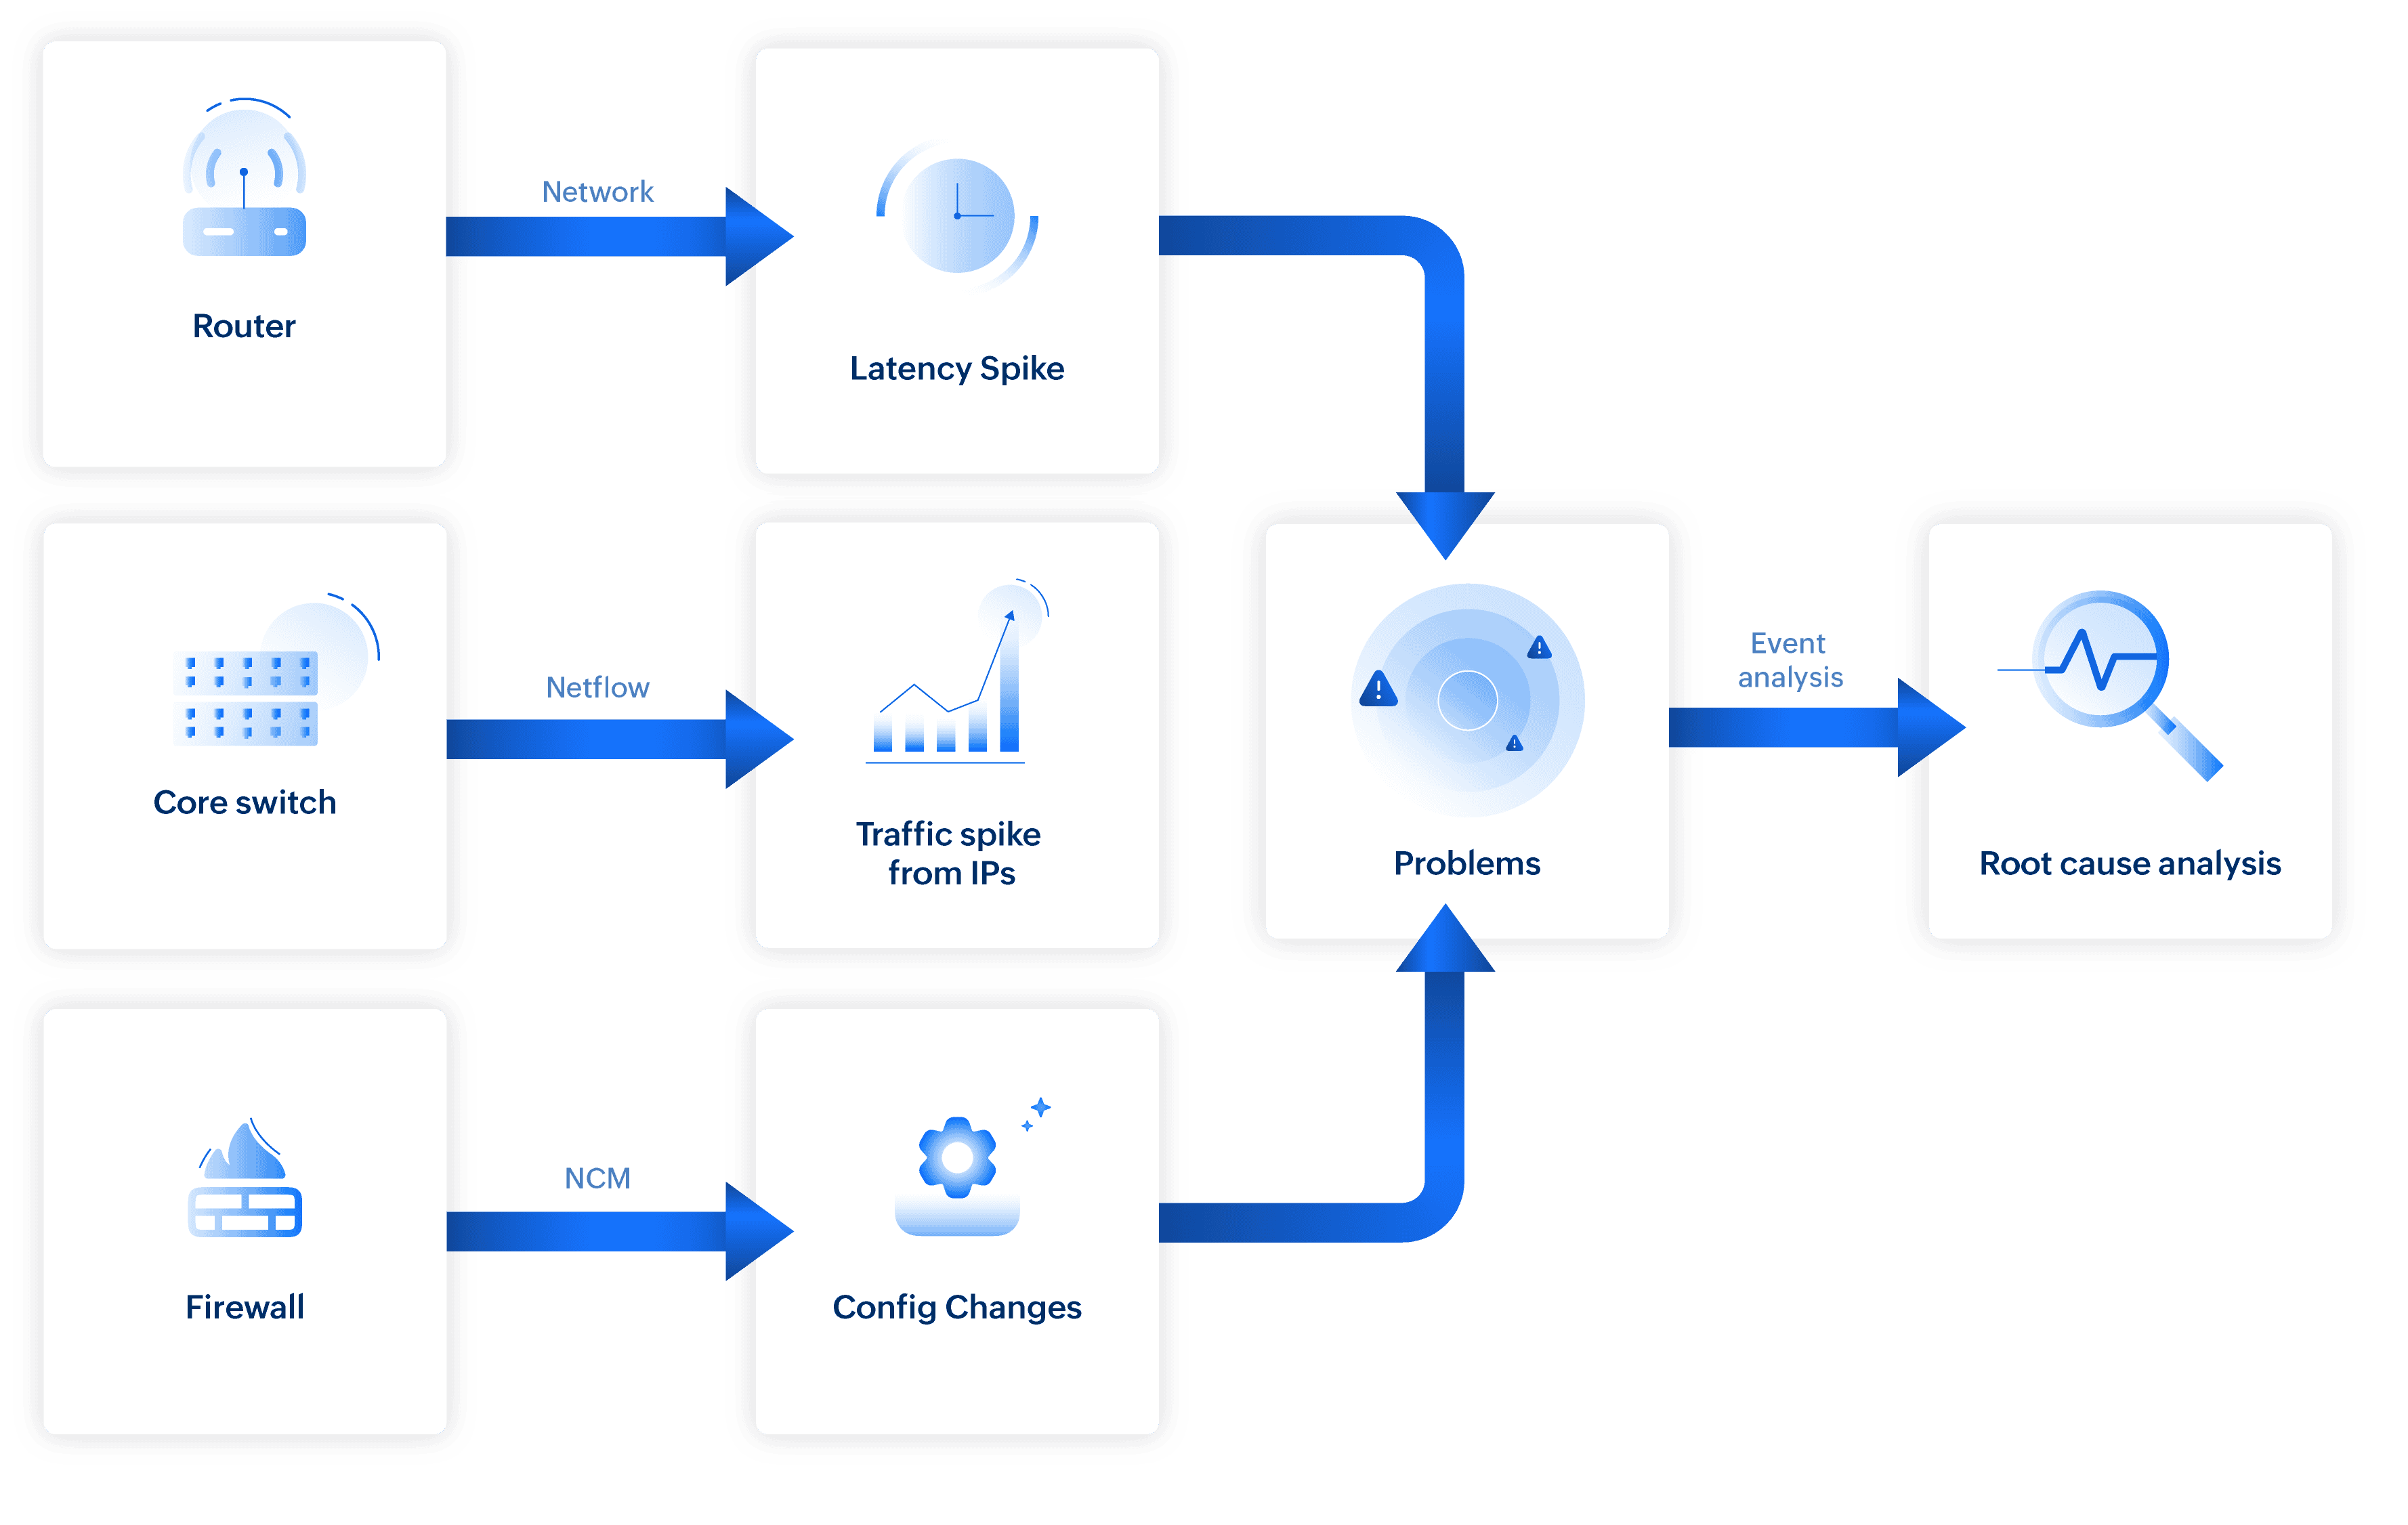
Scenario 2: Isolate the real root cause network slowdowns
In networks with numerous devices like switches, firewalls, and routers, simultaneous events can quickly become overwhelming. Event correlation streamlines this complexity by connecting related events and filtering out noise to reveal the true cause.
Consider a sudden spike in switch response time. The system analyzes events from all the network devices mapped in the path of the switch’s path (via Layer 2 map) that occur at the same time:
- Network traffic monitoring: Unusual bandwidth spike detected on a monitored interface (for example, a sudden increase in traffic from a specific application or source address).
- NCM: Recent configuration change on the firewall.
- Firewall: Rules modified (e.g., port filters adjusted).
- Switch: CPU spike on a separate device.
- Attribute-level metric: Response time (latency) spike.
Irrelevant events, such as unrelated CPU spikes, are filtered out. A correlated problem is created by combining the NetFlow traffic surge with the NCM firewall configuration change, and these are listed as probable root causes for the switch response time degradation.
Scenario 3: Identify what broke your website applications
In web applications, user-facing issues like errors or slow responses can stem from multiple underlying causes. Event correlation helps connect symptoms with relevant infrastructure and service events to pinpoint the root cause quickly.
When a user receives a 502 Bad Gateway error in a web application, there can be more than one underlying cause.
In this scenario, Site24x7 analyzes concurrent events:
- CPU spike on unrelated server
- Temporary network latency on an ISP
- Port 3000 unexpectedly killed (critical)
- Disk usage surge on a related server (critical)
- Short-lived memory spike on the load balancer
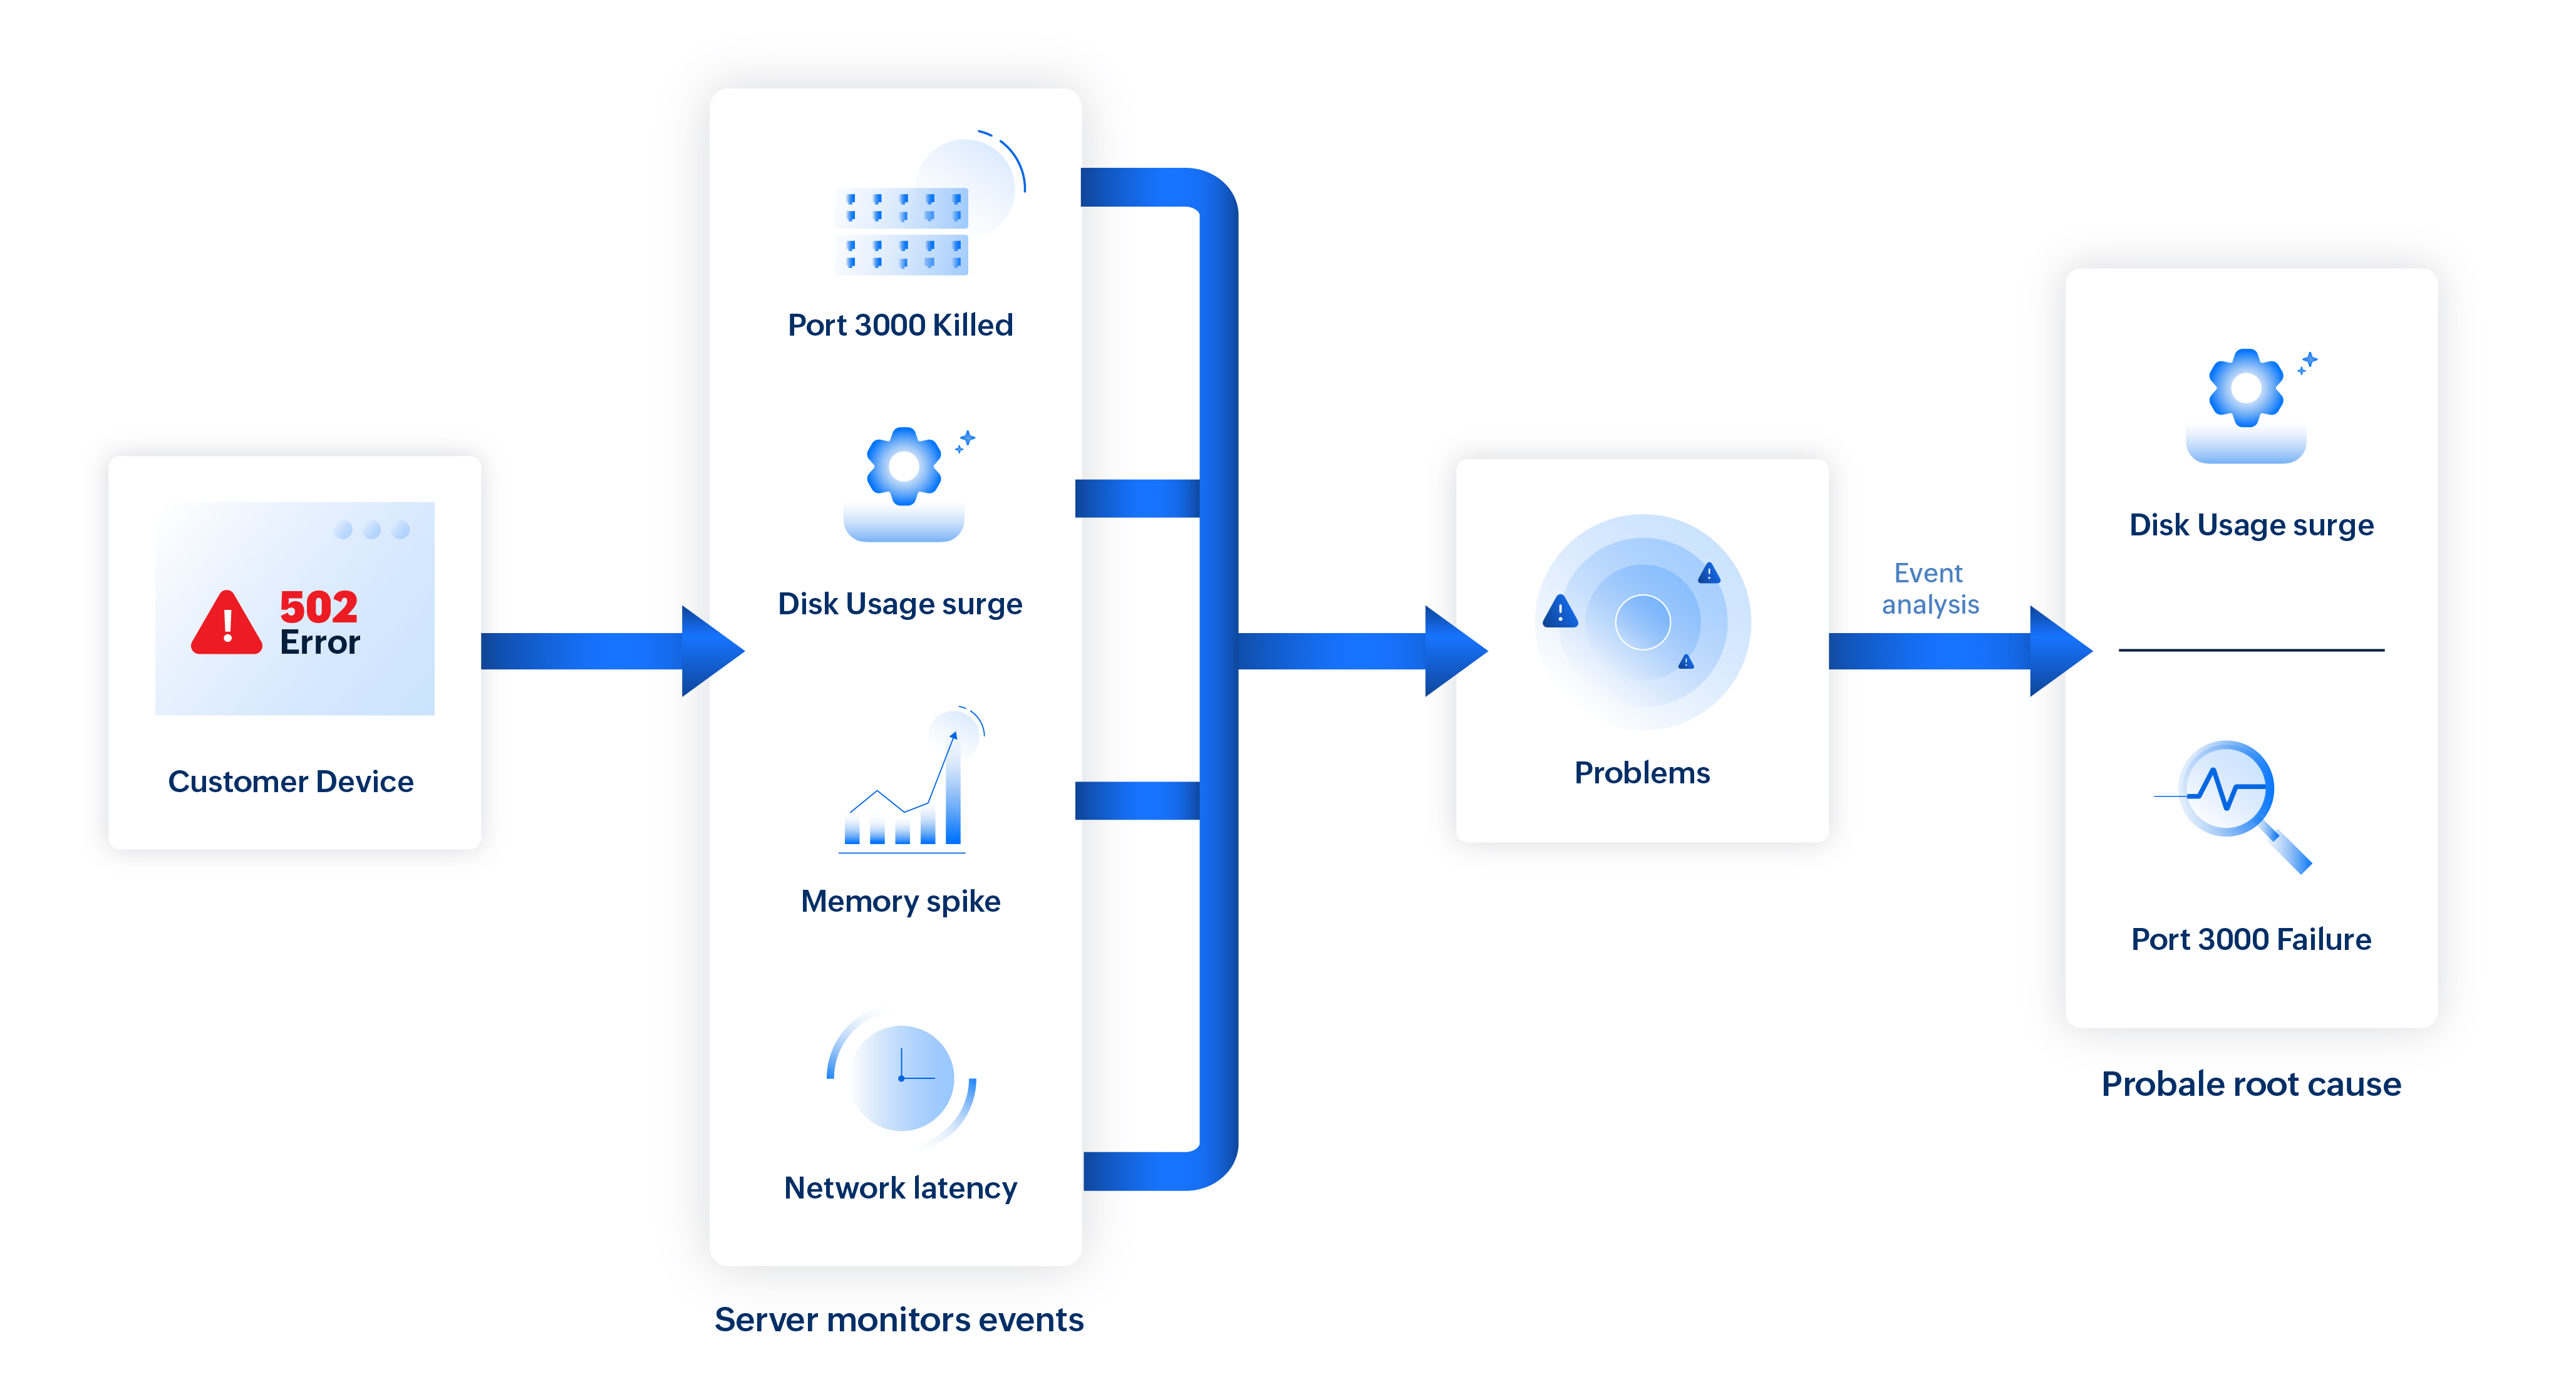
The CPU spike and memory fluctuation are flagged as non-impacting, while network latency is not topologically connected.
So, the remaining events, port 3000 killed (direct service failure), disk usage surge (linked to infrastructure degradation), and the 502 Bad Gateway (visible symptom)—are grouped as a single problem.
On further causal analysis, the port 3000 failure is identified as the primary cause, with the disk usage surge noted as a contributing factor.
Scenario 4: Trace 5xx errors to Kubernetes workloads
When an application runs on a Kubernetes environments with many pods, nodes, and deployments running at once, sudden error spikes can be hard to diagnose. Event correlation simplifies this by linking related symptoms across components to identify the real root cause.
For example, in an e-commerce application, if a payment gateway API begins returning intermittent 5xx errors (like server failure or gateway timeout error), it indicates that the server is unable to handle the request due to an internal error. Now, the system analyzes events across the impacted node, pods, and deployment within the same timeframe to pinpoint the source.
- Node-level signals: An increase in node memory usage is detected, along with warnings indicating the node is under MemoryPressure .
- Pod lifecycle events: Several pods on the node are terminated with “Evicted: The node was low on resource: memory ” as the listed reason.
- Container-level metrics: Multiple containers show OOMKilled terminations, indicating they exceeded their memory limits.
- Workload behavior: The deployment’s available replica count drops below its desired state as pods become unavailable.
- Health checks and auto-scaling: Readiness probes fail just before eviction while the HPA (horizontal pod auto-scaler) scales up the deployment, further increasing memory consumption on already stressed nodes.
Irrelevant events, such as unrelated node CPU spikes or pod restarts in other namespaces, are filtered out. Smart correlation groups all related signals within the same node and namespace, revealing a clear causal chain.
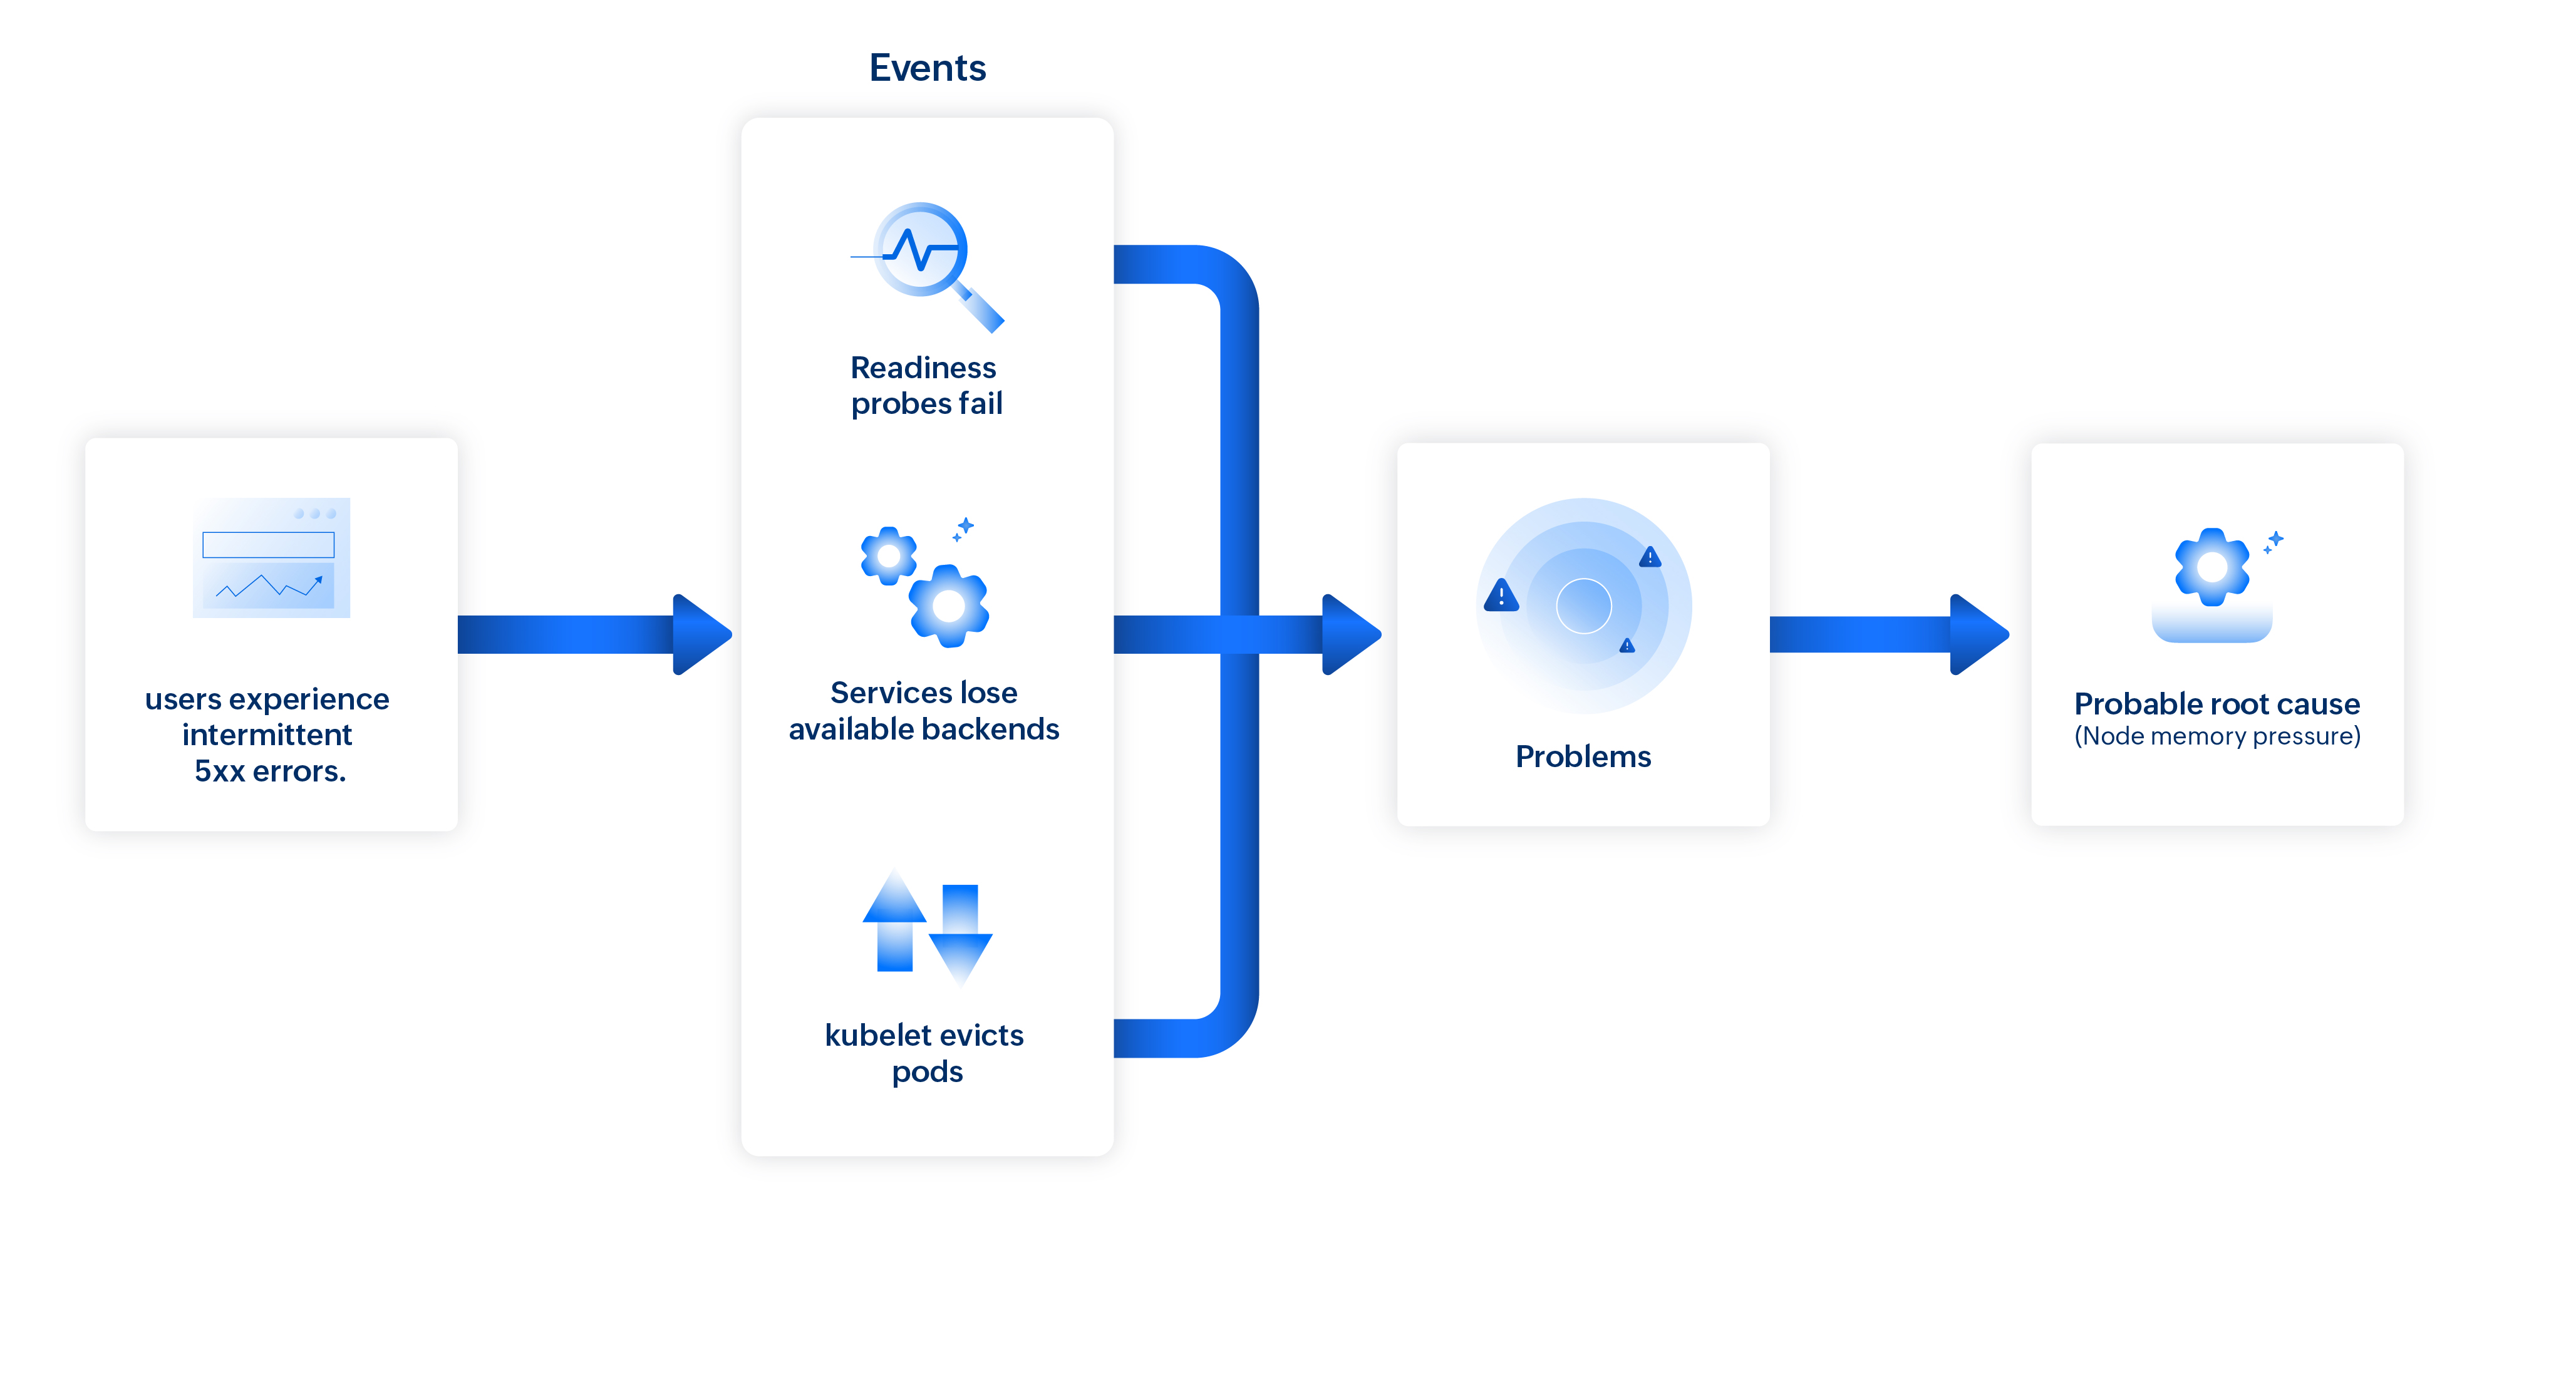
Site24x7's Problems brings these linked occurrences together to identify memory pressure as the probable root cause of the API failures.
Related articles
-
On this page
- Use cases