Forecast
Zia-based Forecast is a powerful tool that utilizes advanced analytics and machine learning techniques to provide accurate predictions and insights into the performance of monitors. By analyzing various metrics generated by the resource, Zia-based Forecast can help users make informed decisions and identify potential anomalies in their resources.
Use Case
Imagine a scenario where you are an IT Operations manager responsible for maintaining the health and performance of your company's critical infrastructure. Ensuring that servers, databases, and applications are running smoothly and addressing any potential issues before they impact users preemptively is imperative. With Zia-based Forecast, you can set customized thresholds for various performance metrics and receive alerts if the predicted values exceed these thresholds. For instance, if your database's CPU usage is forecasted to hit 90% within the next 24 hours, Zia-based Forecast will notify you in advance, allowing you to take preventive measures such as scaling resources or optimizing queries. This proactive approach ensures that you can maintain high availability and performance, ultimately minimizing downtime.
Zia-based Forecast: Alerts
Zia-based Forecast allows users to select specific attributes in their monitors and set customized thresholds for prediction. This enables users to focus on the most relevant metrics and be alerted if the predicted metric breaches the defined limit. This can be done by changing the status of the monitor to Trouble or be notified of the changes in the behavior of the monitor. This enables users to proactively monitor their resources and respond to any changes in behavior.
In addition to threshold monitoring, Zia-based Forecast provides insights into resource seasonality. By analyzing historical data, it identifies patterns and trends in the resource's performance over time. This helps users anticipate potential issues during specific periods and take proactive measures to mitigate risks.
With its advanced analytics and predictive capabilities, Zia-based Forecast empowers users to make informed, data-based decisions. By accurately forecasting monitor performance and highlighting anomalies or risks, it enables users to optimize their resource management and ensure smooth operations in seven-day cycles.
To enable Zia-based Forecast predictions to notify you of potential threshold breaches,
- Log in to Site24x7.
- Navigate to Admin > Configuration Profile.
- Select any monitor supported by Zia Forecast. Please refer to the list below for the supported monitors and attributes.
- In the Edit Threshold Profile form, click Add Zia Forecast Threshold to add Zia forecast threshold values in attributes supported by Zia-based Forecast.
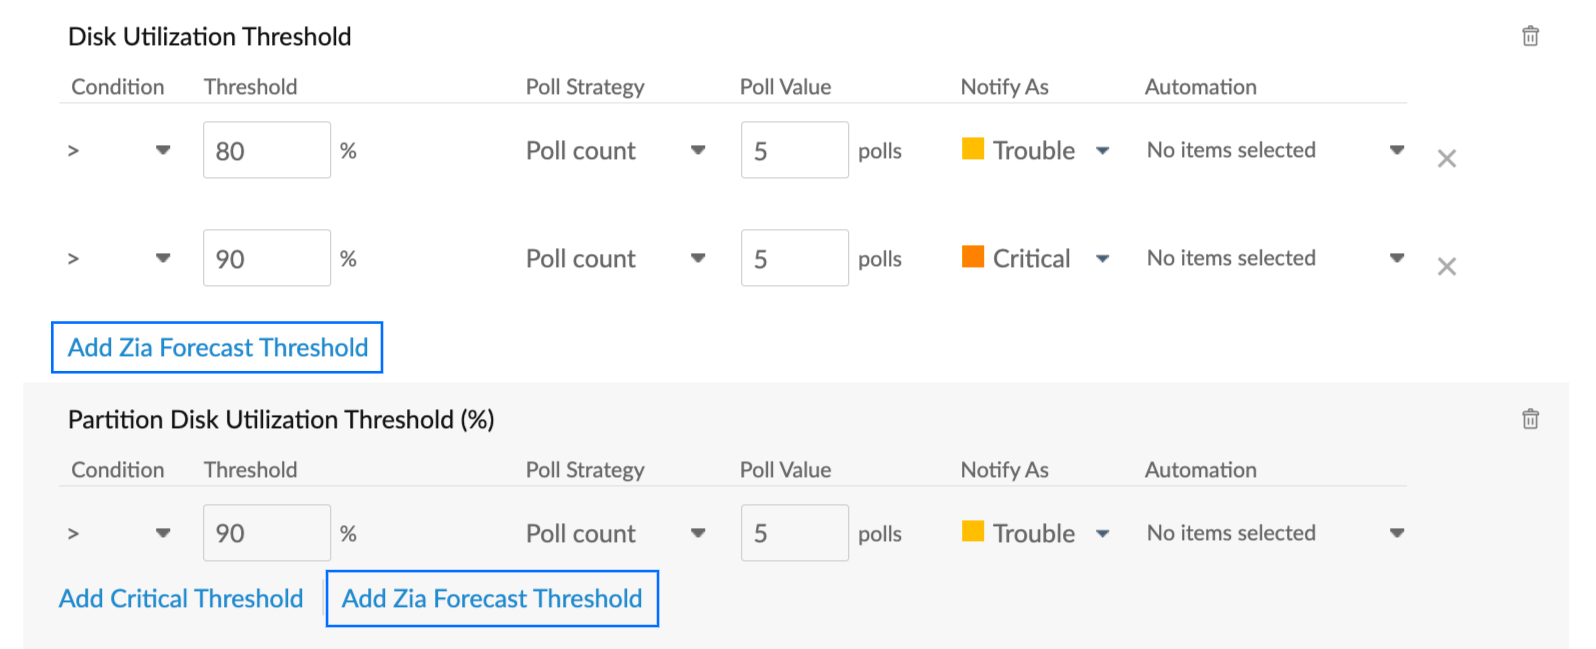
Figure 1. Add Zia Forecast Threshold - Click Save.
How it works
By configuring the threshold settings in Zia-based Forecast, you can establish specific trigger points for notifications. For example, let's assume you set a threshold of 80% to receive a Trouble notification and 90% to receive a Critical notification. In this scenario, if you set the Zia Forecast Threshold at 85%, you will receive advance notifications based on Zia's prediction of when the monitor might approach that threshold. These proactive notifications allow you to take preemptive actions to keep the monitor from reaching the Critical state.
You can find Zia-based Forecast in the following places:
Dashboards
Navigate to Home > Dashboards. Choose any monitor type that supports Zia-based Forecast. Your charts will reflect the forecast data if the widgets you create comply with the time period and attributes supported by Zia-based Forecast. The forecast value is represented in a translucent section in the area charts, and in the line graph, it is represented as a dotted line.
To enable or disable Zia-based Forecast, click Edit Dashboard on the top bar. You can click the Zia icon over the chart to disable this feature.
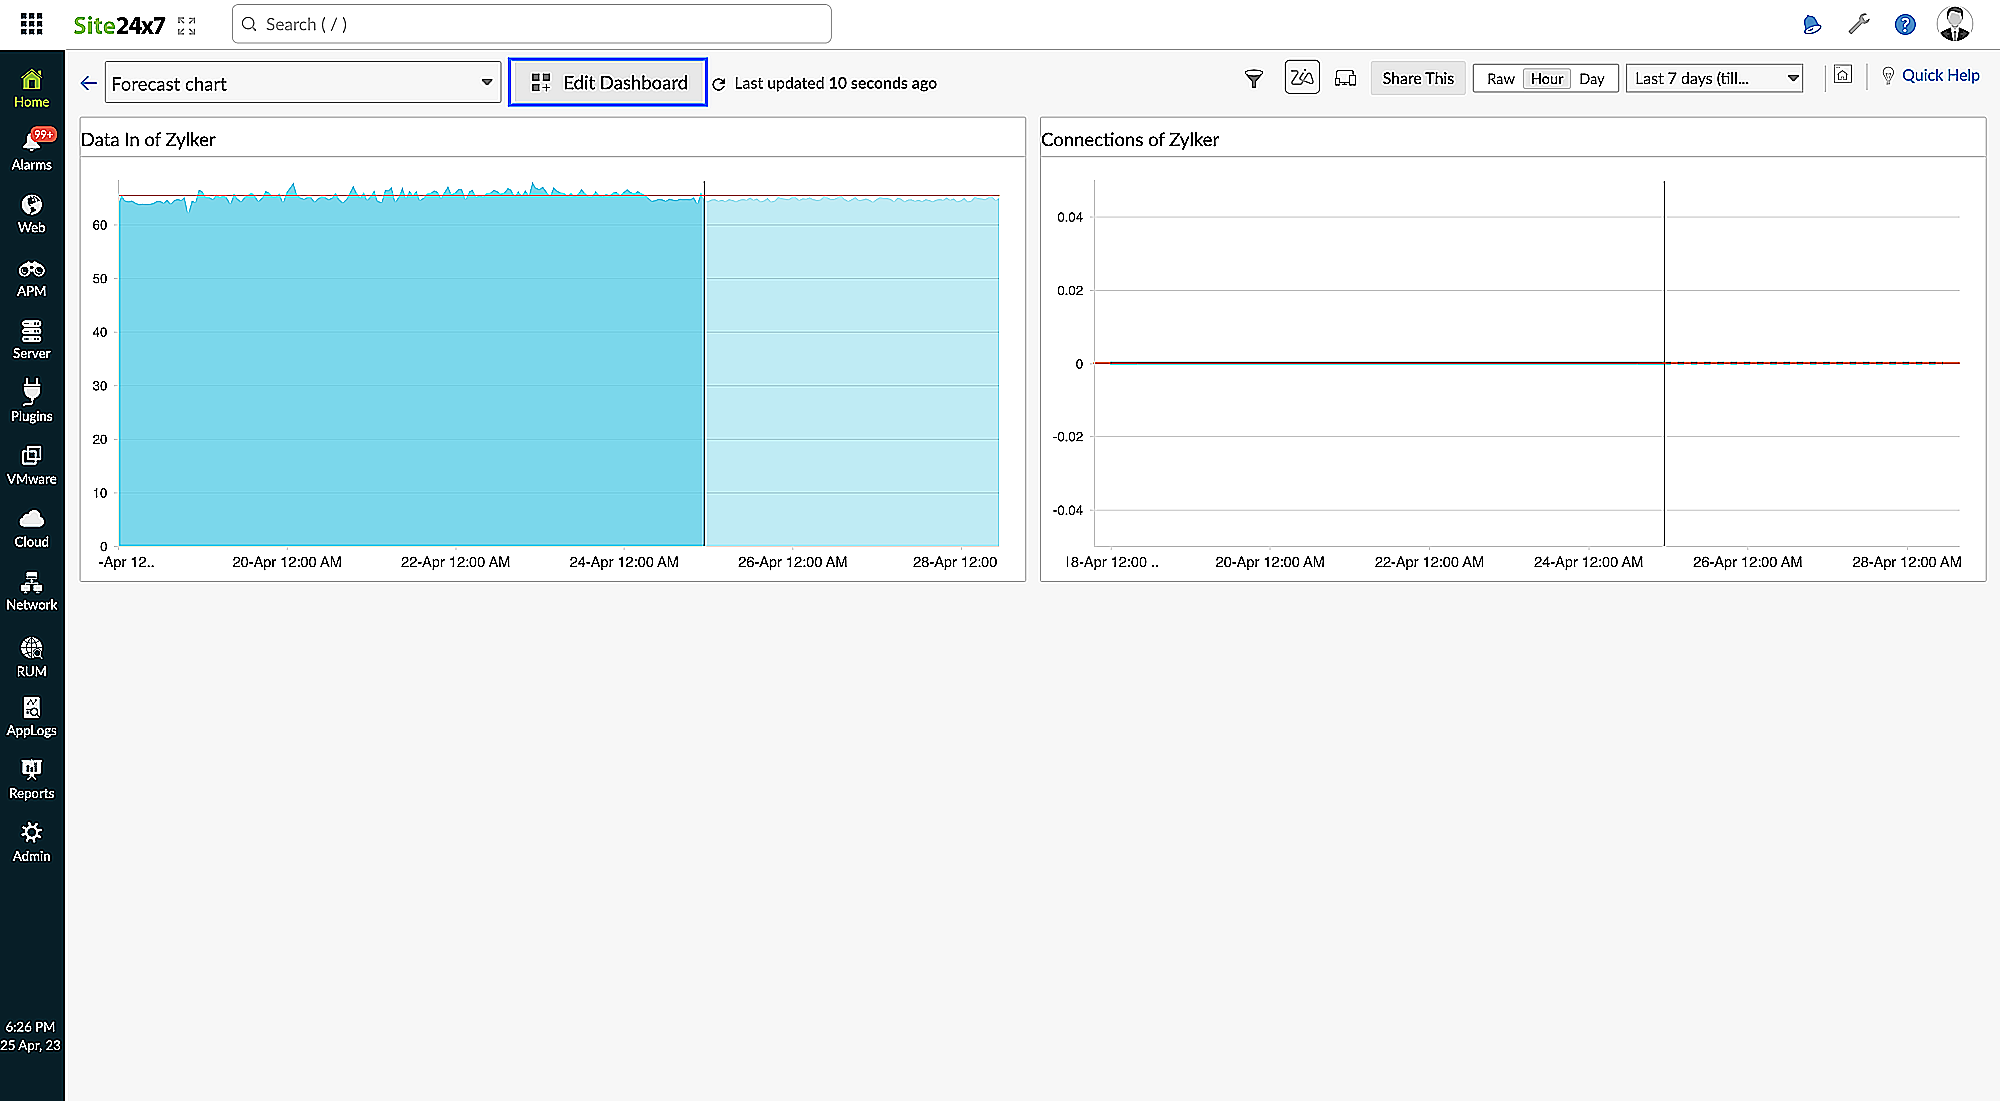
Figure 2. Edit Dashboard
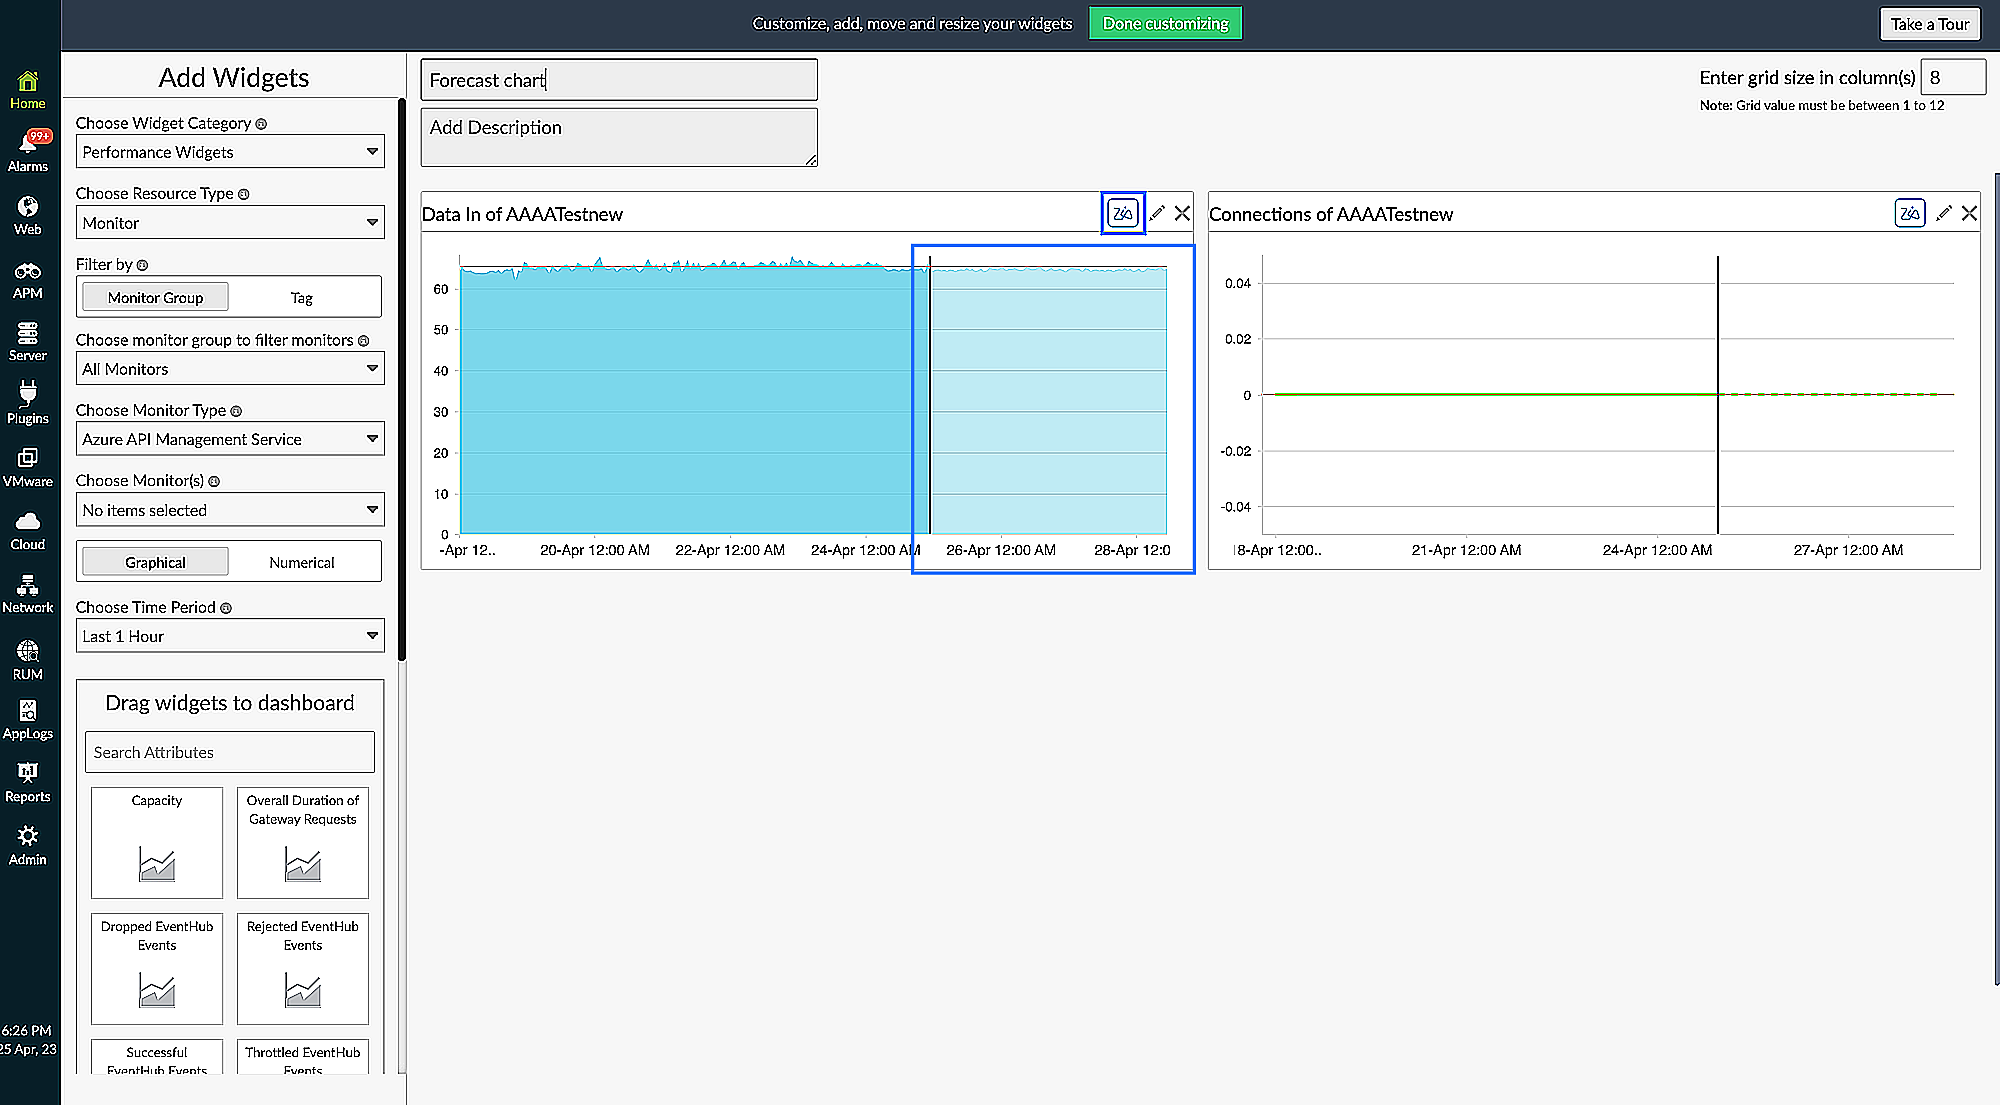
Figure 3. Zia icon in forecast charts
Reports
From the left navigation, go to Reports > Performance Report. Once you enable Show Forecast Values displayed in the top bar, you will be able to see the forecast data in the charts. The forecast data will be represented as a blue translucent section in the area chart, and in the line graph, the data will be represented as a dotted line.
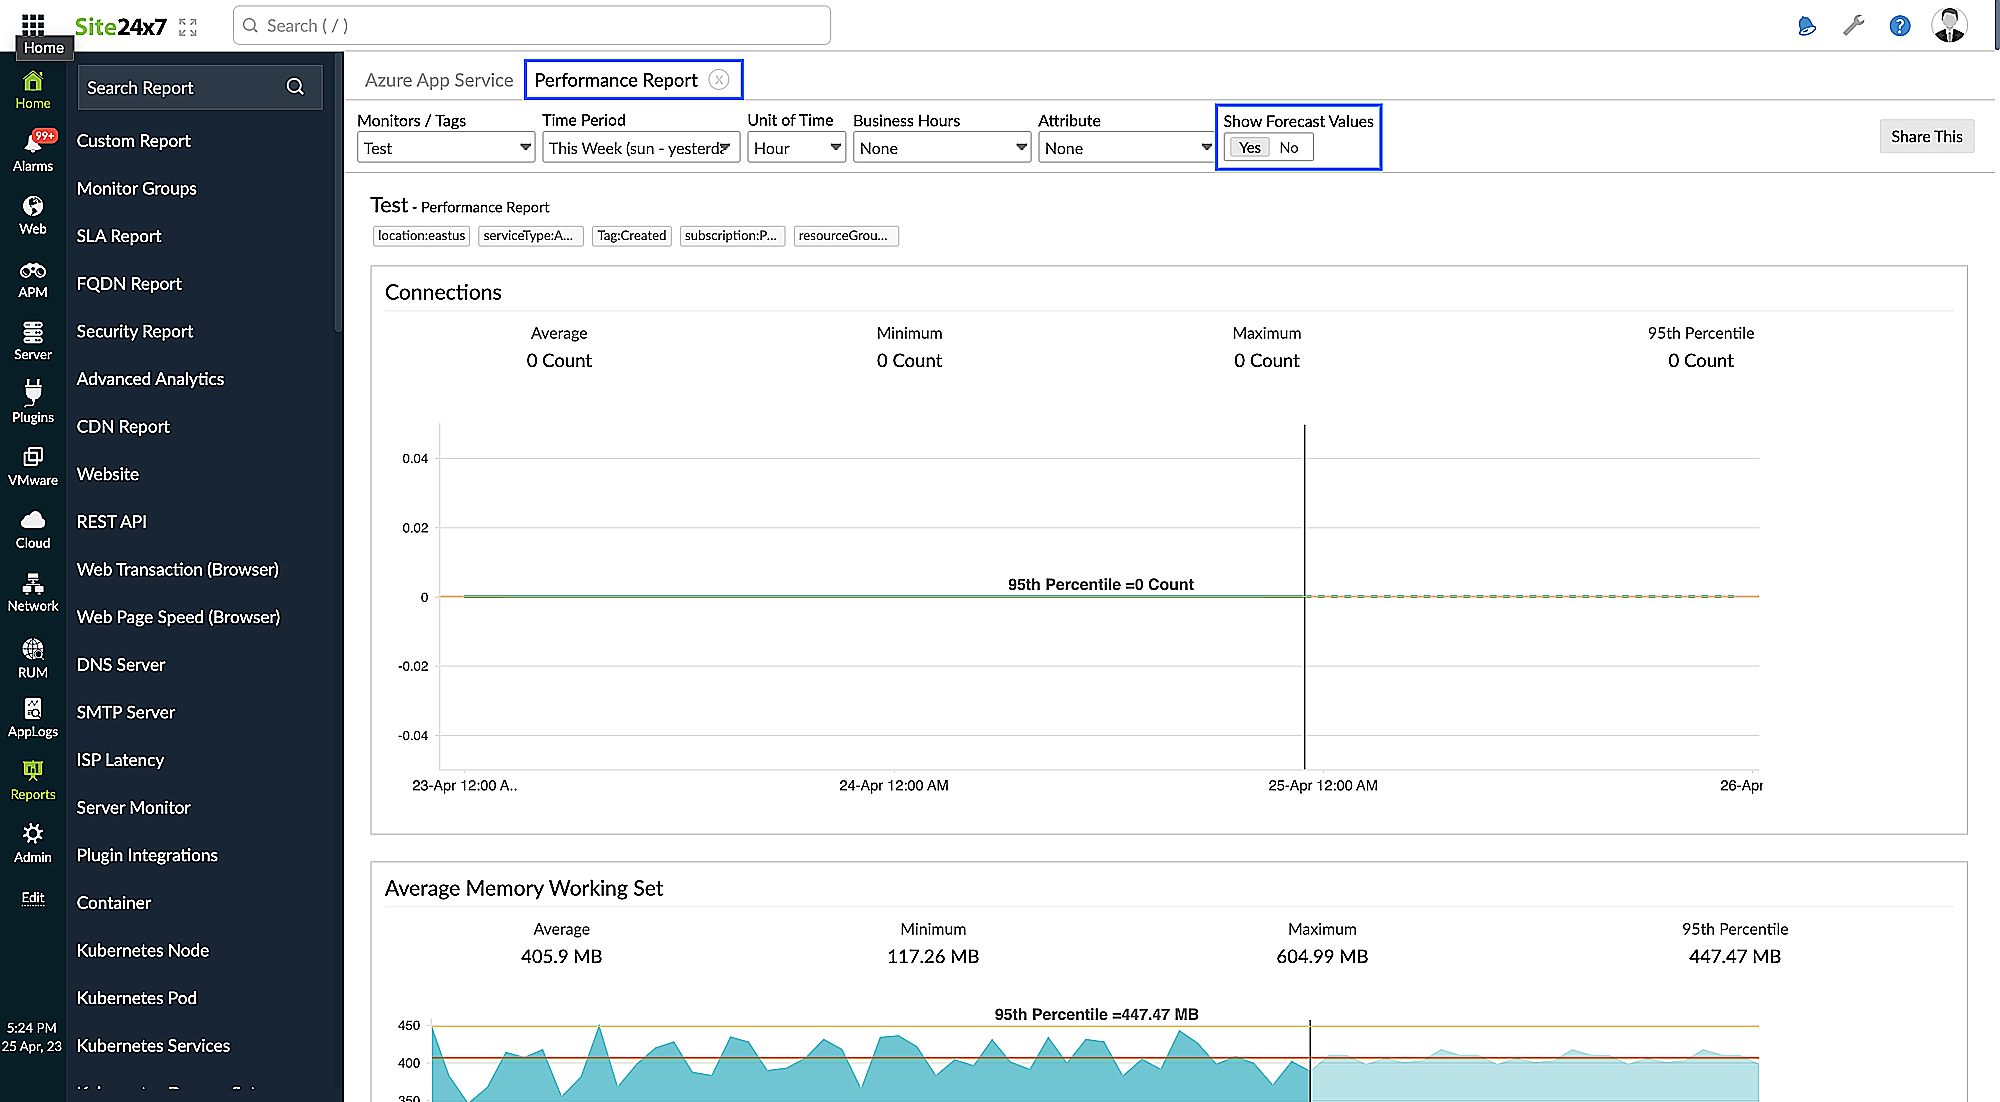
Figure 4. Performance Report
Schedule Reports
- Go to Admin > Report Settings > Schedule Reports.
- Click Schedule Report on the top bar at the right side.
- In the form, choose Performance Report from the drop-down menu in the Report Type field.
- Next, select a Monitor Type that supports Zia-based Forecast after which you will be provided an option to either enable or disable the Zia forecast values in the report. This option will be disabled by default.
- Click Save.
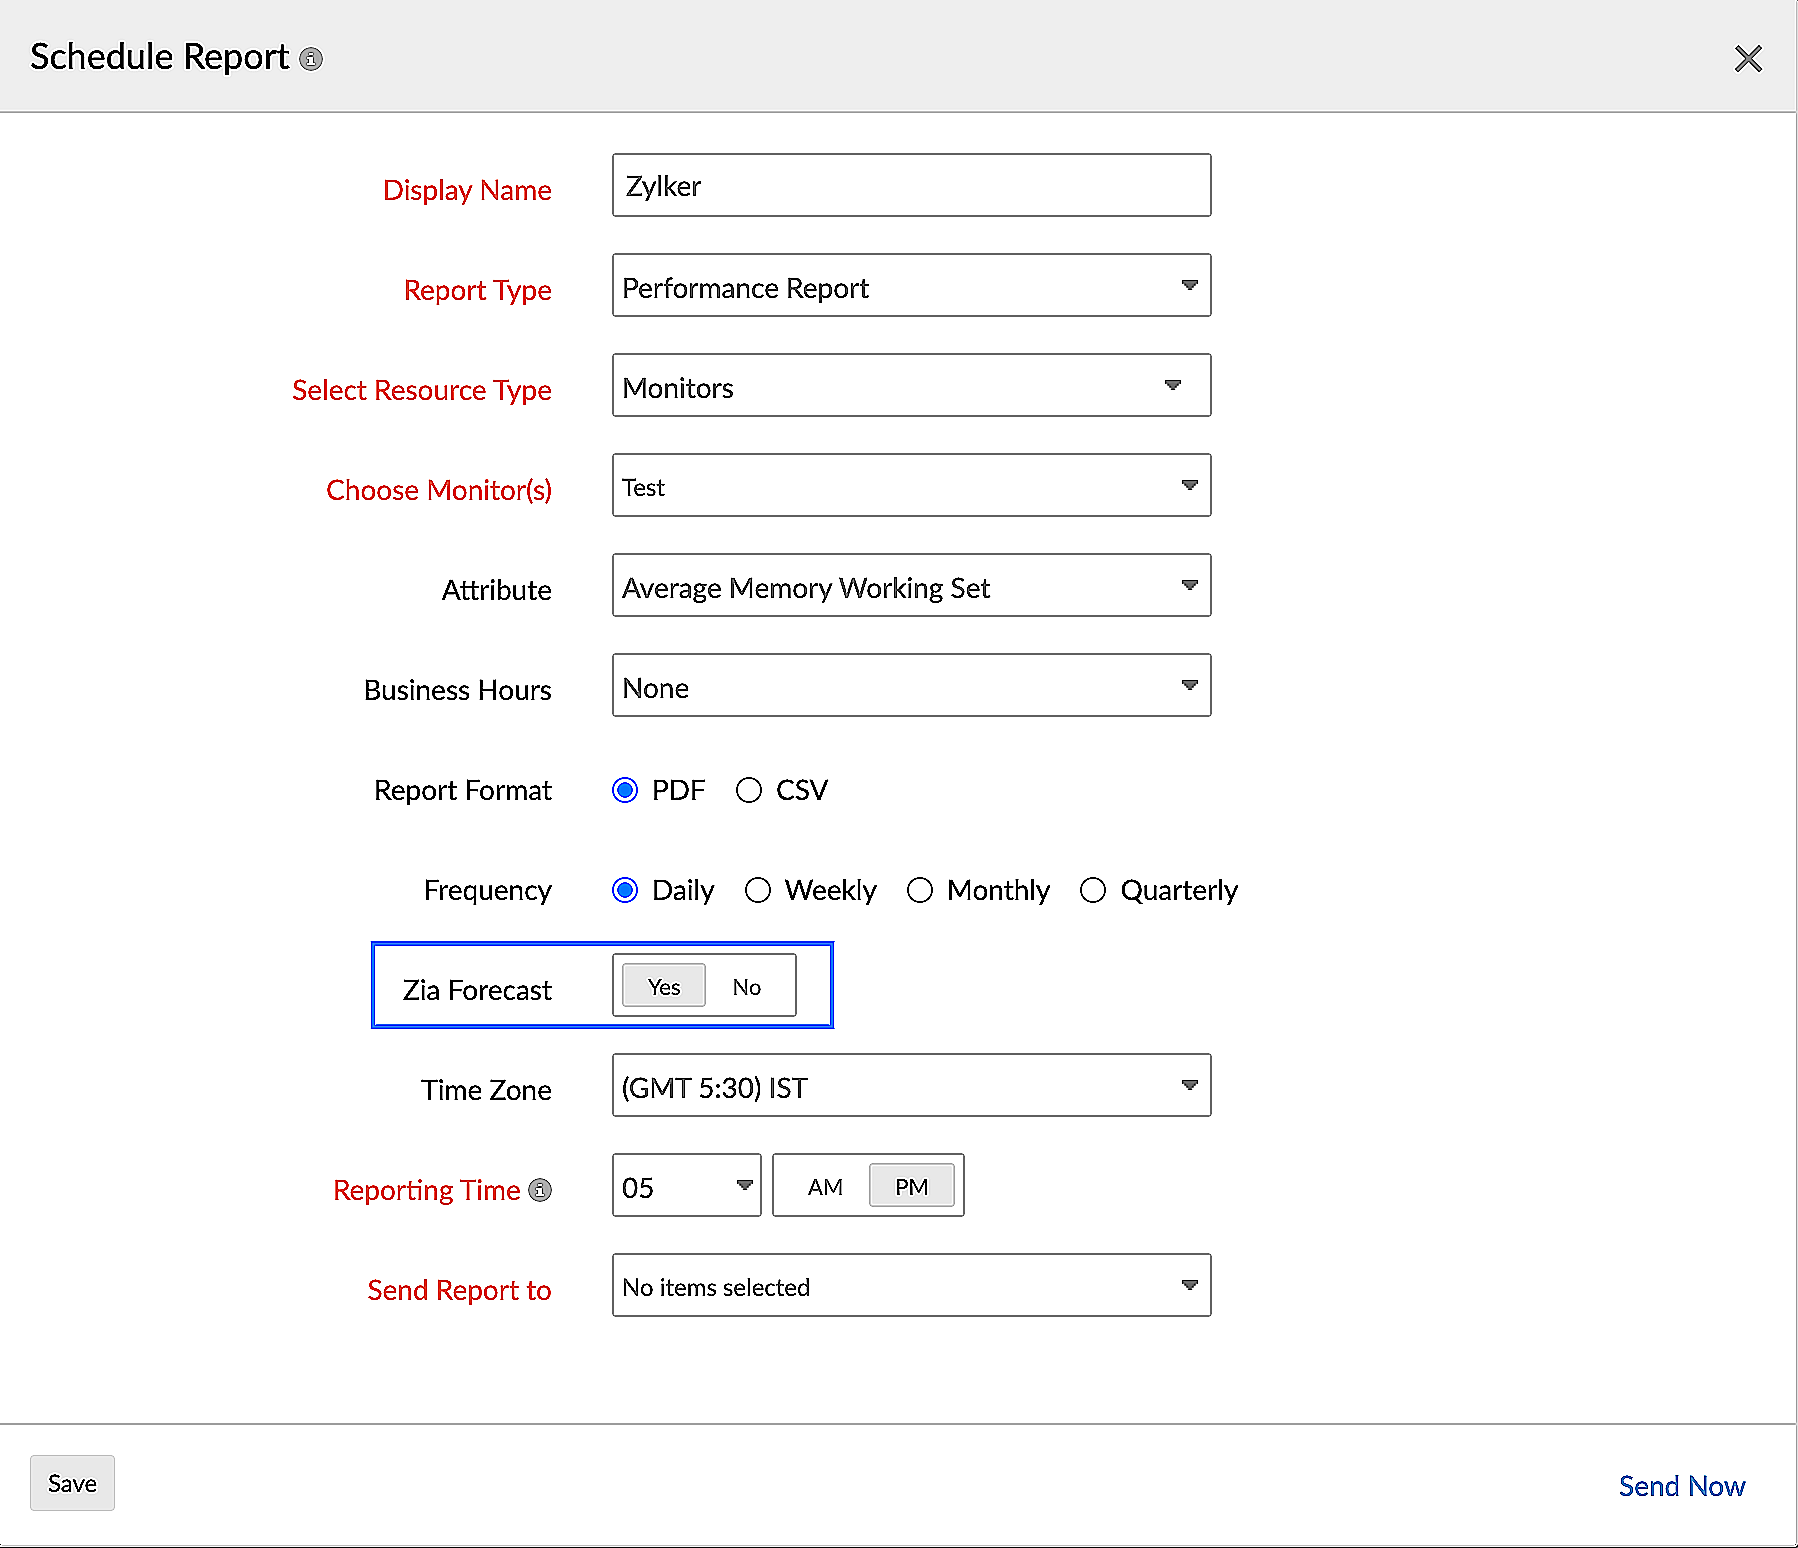
Figure 5. Zia Forecast in Schedule Report
In the tabulation of reports, the forecast values are differentiated with italics.
Public Reports
- Go to Admin > Share > Public Reports.
- Click Publish Report on the right side at the top bar.
- In the form, choose Public Report from the drop-down menu in the Report Type field.
- Next, select a Monitor Type that is supported by Zia-based Forecast after which you will be provided an option to either enable or disable the Zia-based forecast values in the report with the toggle button provided. This option will be disabled by default.
- Click Save.
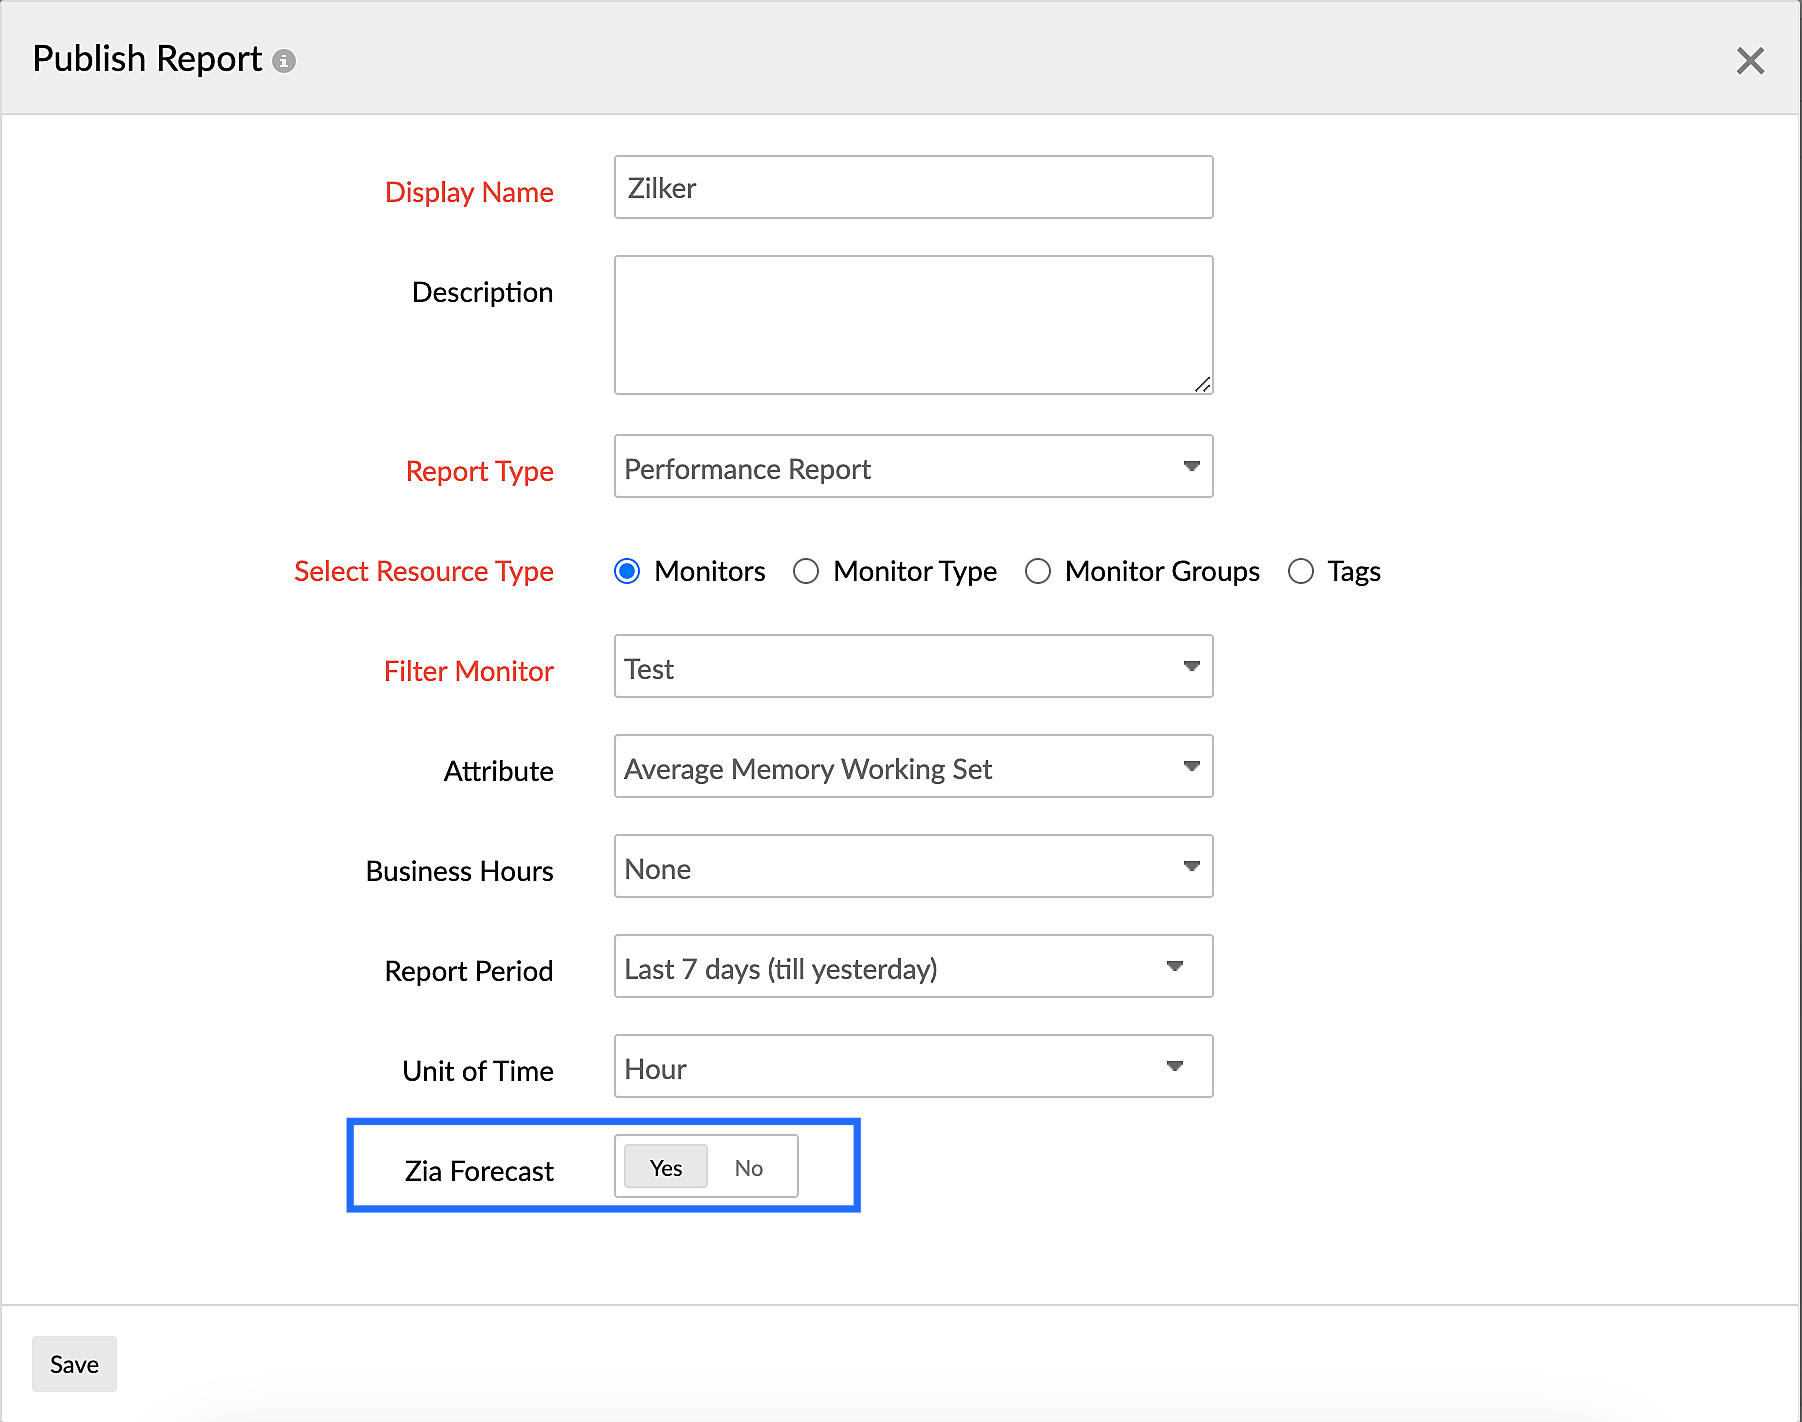
Figure 6. Zia Forecast in Publish Report
In the tabulation of reports, the forecast values are differentiated with italics.
- The resource should have provided at least five continuous data points for a monitor to support the forecast feature.
- When you choose the Report Period, please note that this feature will be applicable only for the following options:
- This week
- Last 7 days (till yesterday)
- Last 30 days (till yesterday)
- This month
- This quarter
- This year
The forecast feature is applicable for the following monitor types and attributes.
Azure
| Monitor Types | Attributes |
|---|---|
| Azure | Virtual Machine |
| Network Out | |
| Percentage CPU | |
| Disk Write Bytes | |
| Network In | |
| Disk Read Bytes | |
| NetApp Capacity Pools | Pool Allocated to Volume Size |
| Pool Consumed Size | |
| Total Snapshot Size for the Pool | |
| Cloud Services | Percentage CPU |
| Available Memory Bytes | |
| Virtual Networks | Failed Pings to a VM |
| Round trip time for Pings to a VM | |
| Bastions | Session Count |
| Used CPU | |
| Used Memory | |
| Network Connections | BitsInPerSecond |
| BitsOutPerSecond | |
| Managed Clusters | Disk Used Percentage |
| CPU Usage Percentage | |
| Memory RSS Percentage | |
| App Configuration | HTTP Incoming Request Count |
| HTTP Incoming Request Duration | |
| Throttled HTTP Request Count | |
| Network Watcher Connections | AverageRoundtripMs |
| RoundTripTimeMs | |
| Data Explorer Cluster | Instance Count |
| CPU | |
| Total Number of Throttled Commands | |
| Azure App Service | Http3xx |
| Http101 | |
| Http2xx | |
| AppConnections | |
| Http401 | |
| Http5xx | |
| Http4xx | |
| Http403 | |
| Handles | |
| RequestsInApplicationQueue | |
| CpuTime | |
| Requests | |
| BytesReceived | |
| AverageMemoryWorkingSet | |
| AverageResponseTime | |
| Http404 | |
| BytesSent | |
| Http406 | |
| Automation | TotalJob |
| TotalUpdateDeploymentRuns | |
| TotalUpdateDeploymentMachineRuns | |
| Automation Accounts | Memory percent |
| Storage percent | |
| CPU percent | |
| Server Farms | File Storage Used Percent |
| File Storage Percent | |
| File System Storage | |
| NAT Gateway | Dropped Packets |
| Packets | |
| Total SNAT Connection Count | |
| Storage | Transactions |
| Success Server Latency | |
| Uptime | |
| Success E2E Latency | |
| Container Apps | CPU Usage |
| Replica Count | |
| Cosmos DB | Memory percent |
| CPU percent | |
| Storage used | |
| String Apps | Tomcat Sessions Expired |
| Tomcat Sessions Active Current | |
| AzureDB for MYSQL Flexible Server | Host Memory Percent |
| IO Percent | |
| Host CPU Percent | |
| Web PubSub Services | Outbound Traffic |
| Connection Count | |
| Database for MySQL Servers | dtu_consumption_percent |
| dtu_used | |
| dtu_limit | |
| Net App Account Volume | Percentage Volume Consumed Size |
| Volume Allocated Size | |
| Stream Analytics Jobs | Runtime Errors |
| SU (Memory) Utilization % | |
| CPU Utilization % | |
| Route Servers | Data Processed by the Virtual Hub Router |
| Bgp Peer Status | |
| Managed Grafana | HTTP Request Count |
| CDN Profiles | ResponseSize |
| ByteHitRatio | |
| RequestCount |
Amazon web services
| Monitor Types | Attributes |
|---|---|
| Lightsail Database | Network Transmit Throughput |
| Network Receive Throughput | |
| Disk Queue Depth | |
| CPU Utilization (%) | |
| Database Migration Service (DMS) | Swap Usage |
| Memory Usage | |
| CPU Utilization | |
| Simple Email Service (SES) | Emails Sent in Last 24hrs |
| Email Usage in the Last 24 Hours | |
| Transit Gateway | Bytes Out |
| Packet Drop Count Blackhole | |
| Bytes Drop Count Blackhole | |
| Bytes Drop Count No Route | |
| Packet Drop Count No Route | |
| Packets Out | |
| Bytes In | |
| Packets In | |
| Route 53 Resolver | Outbound Query Volume |
| Inbound Query Volume | |
| Network load balancer | Consumed LCU Sum |
| Elastic Kubernetes Service (EKS) | Memory utilized by pods |
| Memory utilized by nodes | |
| CPU utilized by pods | |
| CPU units used by nodes | |
| CPU utilization by nodes | |
| VPC-VPN connection | Tunnel Data Received |
| Total Tunnel Data Sent | |
| Tunnel Data Sent | |
| Total Tunnel Data Received | |
| Route 53 Health Check | Time To First Byte |
| TCP Connection Time | |
| Time To First Byte | |
| Health Percentage | |
| Storage Gateway File | Cache Hit Percent |
| Cache Percent Used | |
| Cache Percent Dirty | |
| Elastic MapReduce | Total Load |
| HDFS Bytes Written | |
| S3 Bytes Read | |
| S3 Bytes Written | |
| HDFS Bytes Read | |
| Capacity Remaining | |
| HDFS Utilization | |
| Lightsail Instance | Network In |
| Network Out | |
| CPU Utilization (%) | |
| Storage Gateway | Cache Hit Percent |
| Upload Buffer Percent Used | |
| Working Storage Percent Used | |
| Cache Percent Used | |
| Cache Percent Dirty | |
| User Cpu Percent | |
| IO wait percent | |
| Cloud Search | Searchable Documents |
| Index Utilization | |
| Elastic Container Service (ECS) | Running Tasks |
| Memory Utilization | |
| CPU Utilization | |
| EC Memcached Node | Evictions Occurred |
| Current Connections | |
| Reclaimed Occurred | |
| Swap Usage | |
| Current Items | |
| CPU Usage | |
| Elastic Kubernetes Service Namespace | Memory utilized by pods |
| Memory Utilized | |
| CPU Utilized | |
| CPU utilized by pods | |
| Memory utilized by pods | |
| CPU utilized by pods | |
| Amazon FSX | Data Write Bytes |
| Data Write Operation | |
| Data Read Bytes | |
| Meta Data Operation | |
| Data Read Operation | |
| Gateway Load Balancer | Consumed LCU Sum |
| Elastic Kubernetes Service (EKS) | Memory Utilized |
| CPU Utilized | |
| Network Traffic | |
| Elastic Search | Free Storage Space |
| JVM GC Old Collection Time | |
| Cluster Used Space | |
| JVM GC Old Collection Count | |
| Read IOPS | |
| Elasticsearch Requests | |
| Disk Queue Depth | |
| System Memory Utilization | |
| Deleted Documents | |
| CPU Utilization | |
| CPU Credit Balance | |
| Relational Database Service (RDS) | Free Storage in % |
| CPU Surplus Credits Charged | |
| Volume Write IOPs | |
| Freeable Memory (%) | |
| CPU Credit Usage | |
| CPU Usage | |
| CPU Credit Balance | |
| Aurora Bin Log Replica Lag | |
| Bin Log Disk Usage | |
| CPU Surplus Credit Balance | |
| Burst Balance | |
| Swap Usage | |
| Transaction Logs Disk Usage | |
| Volume Read IOPs | |
| Disk Queue Depth | |
| Free Local Storage | |
| Freeable Memory | |
| Database Connections Sum | |
| Simple Storage Service (S3) | Maximum Object Size |
| Number of Folders | |
| Number of Objects in the Folder | |
| Total number of Objects in the Subfolders | |
| Minimum Object Size | |
| Total Number of Subfolders | |
| Number Of Objects Modified in Last 5 minutes | |
| Step Functions | Execution Time |
| Execution Throttled | |
| No. of Executions Timed Out | |
| No. of Executions Failed | |
| S3 Bucket | Bucket Size |
| Number of Objects | |
| Amazon MQ | Volume Write Ops |
| Total Dequeue Count | |
| Store Percent Usage | |
| Volume Read Ops | |
| Broker Heap Usage | |
| Total Enqueue Count | |
| CPU Usage (CloudWatch) | |
| Simple Queue Service (SQS) | Number Of Messages Sent |
| Number Of Messages Received | |
| NAT Gateway | Connection Established Count |
| Connection Attempt Count | |
| Active Connection Count | |
| Packets Drop Count | |
| Error Port Allocation | |
| Application Load Balancer (ALB) | Request Count Per Target |
| Rejected Connections | |
| Requests Count Sum | |
| Consumed LCU Sum | |
| Route 53 Hosted Zone | Request Count |
| Direct Connect - Virtual Interface | Virtual Interface Bps Ingress (Bits) |
| VirtualInterfacePpsIngress | |
| VirtualInterfaceBpsEgress | |
| VirtualInterfaceBpsIngress | |
| Virtual Interface Bps Egress (Bits) | |
| VirtualInterfacePpsEgress | |
| Lambda@Edge | Invocations |
| Errors | |
| Throttles | |
| Duration | |
| Success Percentage | |
| EC2 Capacity Reservation | Instance Utilization |
| Neptune Cluster | Volume Bytes Used |
| SPARQL Requests | |
| SPARQL Errors | |
| Gremlin Errors | |
| Gremlin Requests | |
| CPU Utilization (%) | |
| Redshift | Evictions Occurred |
| Current Connections | |
| Reclaimed Occurred | |
| Swap Usage | |
| Current Items | |
| CPU Usage | |
| EC2 instance | IOPS Usage |
| CPU Surplus Credits Charged | |
| CPU Surplus Credit Balance | |
| Burst Balance | |
| Number of Bytes Sent | |
| Number of Bytes Received | |
| CPU Usage (CloudWatch) | |
| CPU Credit Usage | |
| CPU Credit Balance | |
| AMQ Queue | In Flight Count |
| Lightsail Load Balancer | Request Count |
| Instance Response Time | |
| HTTP 4xx - Load Balancer | |
| HTTP 4xx - Instance | |
| Rejected Connection Count | |
| Elastic Container Service (ECS) | Container Instances |
| CPU Utilization Maximum | |
| CPU Reservation | |
| Memory Reservation | |
| Memory Utilization | |
| CPU Utilization | |
| Transit Gateway Attachment | Bytes Out |
| Packet Drop Count Blackhole | |
| Bytes Drop Count Blackhole | |
| Bytes Drop Count No Route | |
| Packet Drop Count NoRoute | |
| Packets Out | |
| Bytes In | |
| Packets In | |
| Web Application Firewall (WAF) | Counted Requests |
| Blocked Requests | |
| Passed Requests | |
| Amazon AppStream 2.0 | Capacity Utilization |
| EC2 Auto Scaling Group | Number of Bytes Sent |
| Number of Bytes Received | |
| CPU Usage (CloudWatch) | |
| AMQ Topic | Memory Usage |
| In Flight Count | |
| DDB cluster | CPU Surplus Credits Charged |
| Maximum Queue Depth For Request Throttled Due To Low Memory | |
| Volume Write IOPs | |
| Database Cursors(Max) Sum | |
| Database Connections(Max) Sum | |
| CPU Usage | |
| CPU Credit Balance | |
| CPU Credit Usage | |
| Database Cursors TimedOut | |
| CPU Surplus Credit Balance | |
| Swap Usage | |
| Transactions Open Max Sum | |
| Queue Depth For Request Throttled Due To Low Memory | |
| Volume Read IOPs | |
| Disk Queue Depth | |
| Database Connections Sum | |
| Number of Operations Throttled Due to Low Memory | |
| Database Cursors Sum | |
| Freeable Memory | |
| Transactions Open Sum | |
| SG Volume | Cache Hit Percent |
| Cache Percent Used | |
| Cache Percent Dirty | |
| Elastic Search Memcached | Evictions Occurred |
| Current Connections | |
| Reclaimed Occurred | |
| Swap Usage | |
| Current Items | |
| CPU Usage | |
| Amazon DMS Instance | Write Operations |
| Swap Usage | |
| Read Operations | |
| Disk Queue Depth | |
| Freeable Memory | |
| CPU Utilization | |
| Elastic Search Node | Free Storage Space |
| JVM GC Old Collection Time | |
| JVM GC Old Collection Count | |
| System Memory Utilization | |
| CPU Utilization | |
| Elastic File System (EFS) | File Metered Size |
| Burst Credit Balance | |
| Permitted Throughput | |
| Neptune Instance | SPARQL Requests |
| SPARQL Errors | |
| Gremlin Errors | |
| Gremlin Requests | |
| CPU Utilization (%) | |
| Loadbalancer | Surge Queue Length |
| Spill Over Count | |
| DDB Instance | CPU Surplus Credits Charged |
| Maximum Queue Depth For Request Throttled Due To Low Memory | |
| Volume Write IOPs | |
| Database Cursors(Max) Sum | |
| Database Connections(Max) Sum | |
| CPU Usage | |
| CPU Credit Balance | |
| CPU Credit Usage | |
| Database Cursors TimedOut | |
| CPU Surplus Credit Balance | |
| Swap Usage | |
| Transactions Open Max Sum | |
| Queue Depth For Request Throttled Due To Low Memory | |
| Volume Read IOPs | |
| Disk Queue Depth | |
| Database connections Sum | |
| Number Of Operations Throttled Due To Low Memory | |
| Database Cursors Sum | |
| Freeable Memory | |
| Transactions Open Sum |
Server
| Monitor Types | Attributes |
|---|---|
| Windows Backups | Used Space(GB) |
| MySQL Database | Slow Queries |
| InnoDB Tables in Use | |
| Queries | |
| Server | Used Space (%) |
| Overall Disk Usage | |
| Used Space | |
| Overall Disk Size | |
| Overall Disk Free Space |
VM
| Monitor Types | Attributes |
|---|---|
| VMware | Space Occupied by VM(Percentage) |
| Partition Used Space (GB) | |
| Free Space | |
| Snapshot Space (Percentage) | |
| Disk File Space | |
| Snapshot Space | |
| Disk File Space (Percentage) | |
| Occupied Space | |
| Snapshots Size | |
| Snapshot Space | |
| Free Space | |
| Disk File Space |
Network
| Monitor Types | Attributes |
|---|---|
| Network Device | Tx Utilized |
Others
| Monitor Types | Attributes |
|---|---|
| Capacity | Total Number of Monitors |
| Maximum Downtime | |
| Availability (%) | |
| MySQL Database | Total Errors |
| Throughput | |
| Status Check Monitor | Total Number of Monitors |
| Maximum Downtime | |
| Availability (%) | |
| GCP Cloudrun | Received Bytes |
| Outbound Packets Throttled | |
| Billable Instance Time | |
| Max Concurrent Requests | |
| Outbound Bytes Throttled | |
| Request Count | |
| Container CPU Utilization | |
| Container CPU Allocation | |
| Instance Count | |
| Container Memory Allocation | |
| Sent Bytes | |
| Inbound Bytes Throttled | |
| Request Latency | |
| Container Memory Utilization | |
| Inbound Packets Throttled | |
| Container Startup Latency |
-
On this page
- Zia-based Forecast: Alerts
- Dashboards
- Reports
