Event correlation in Site24x7 with Problems
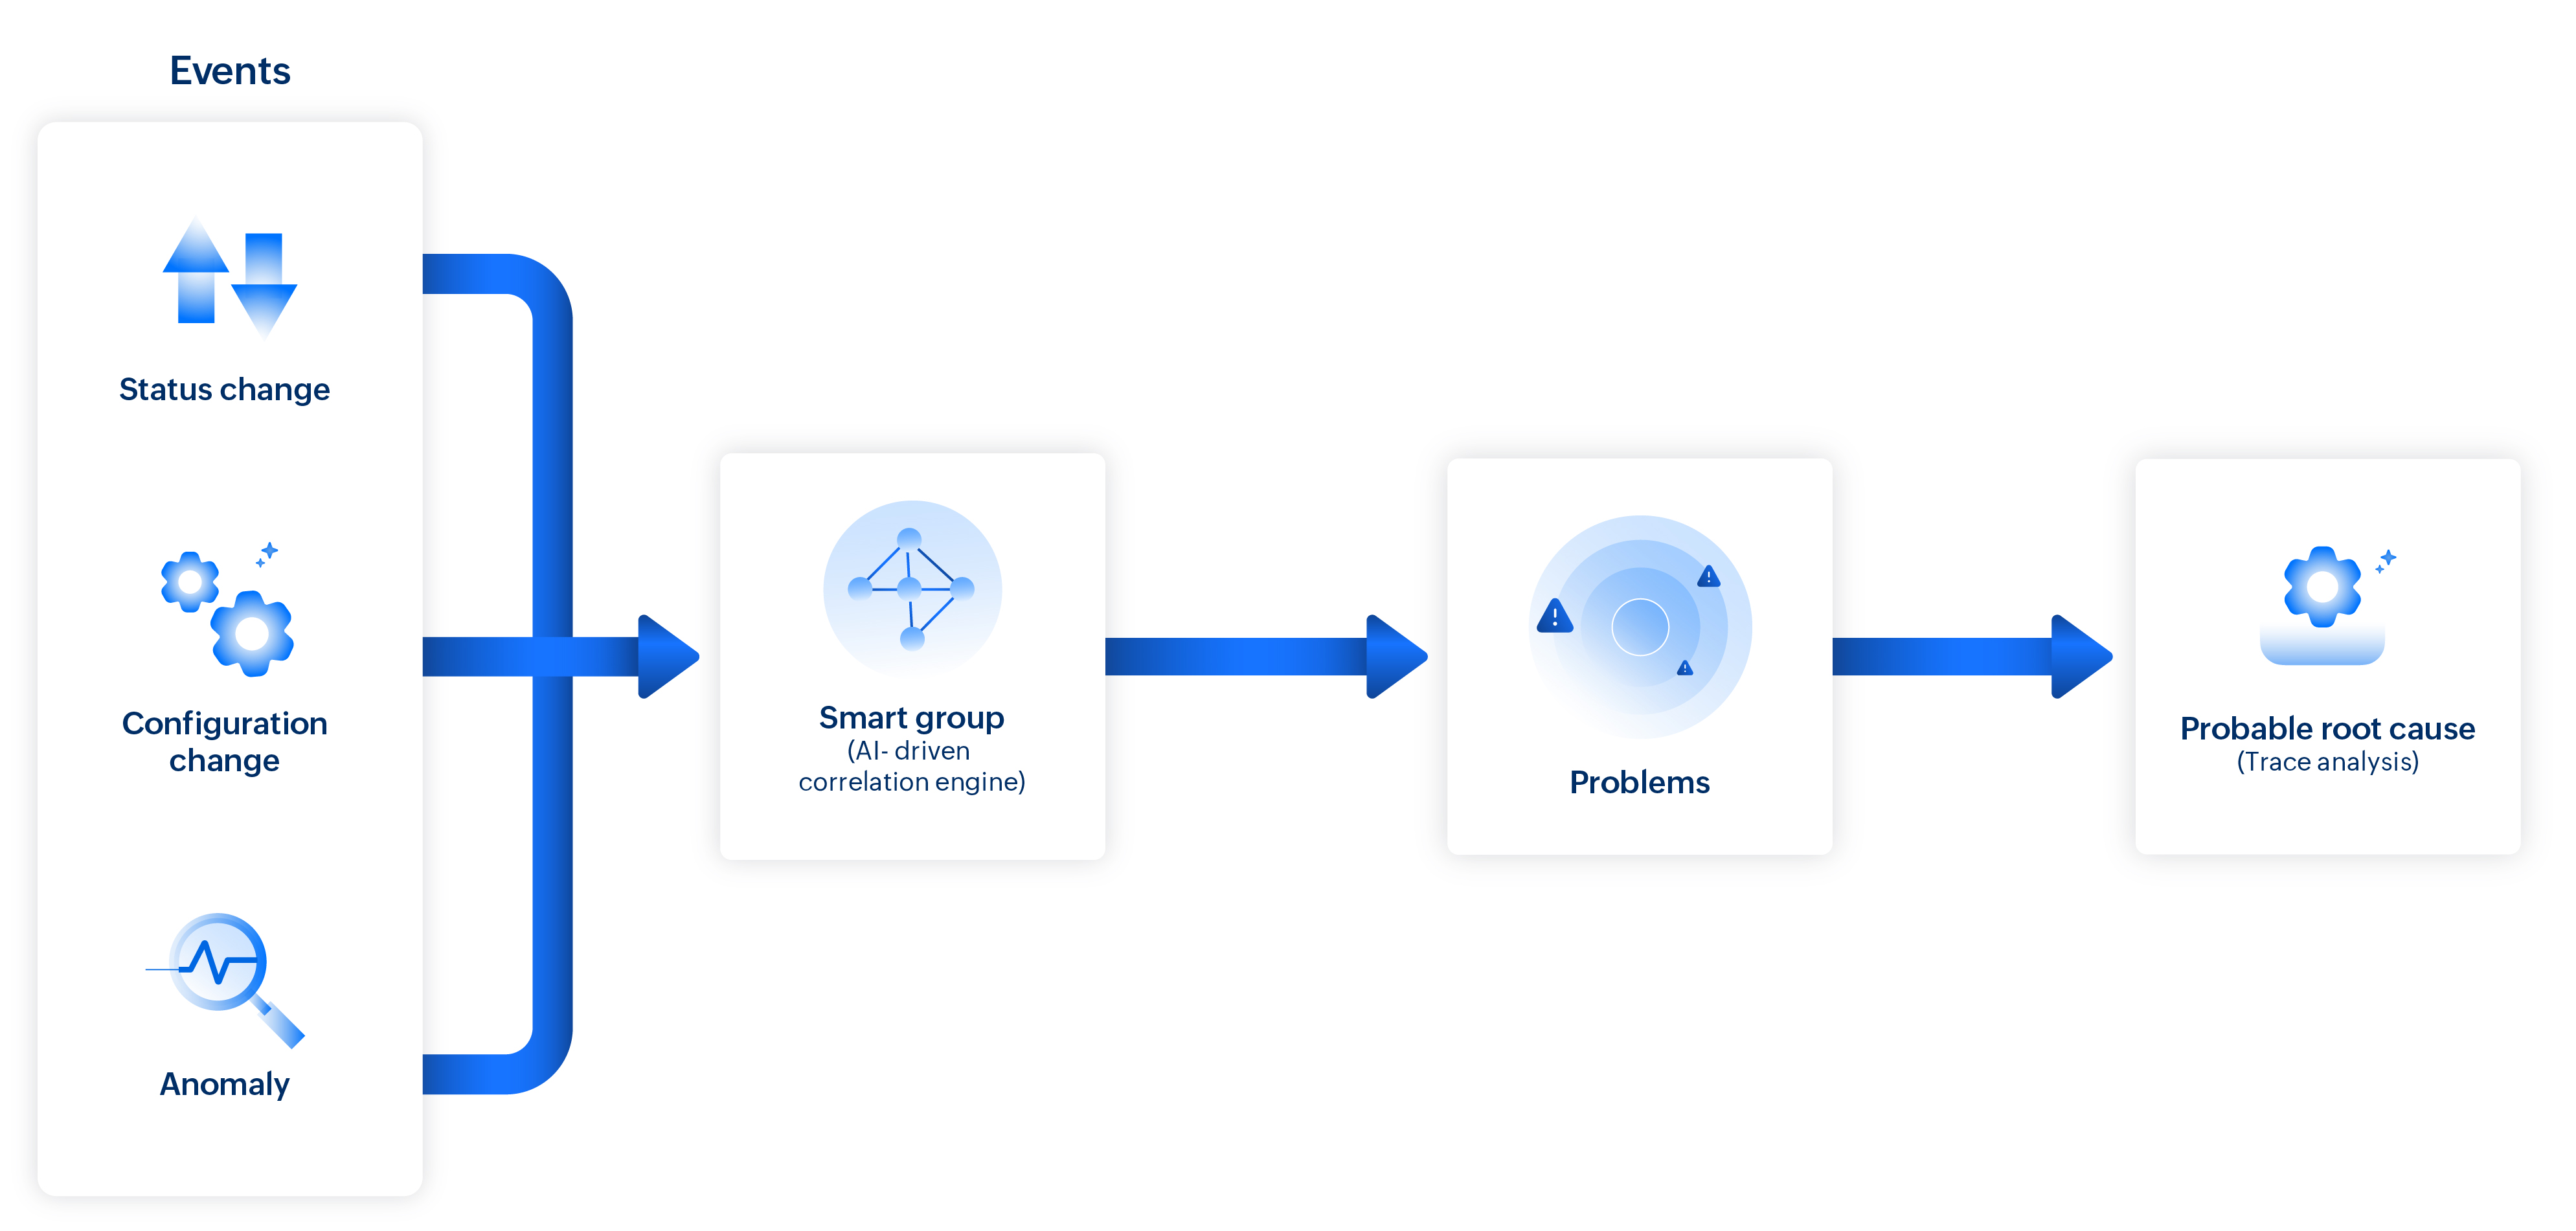
In Site24x7, an event is a change in the state (from Up, Down, Trouble, or Critical to another state) or performance (threshold breach, spike in response time, exception, etc.) of a monitored resource. Events that appear independent at first glance may actually be connected through a single underlying change, such as a configuration update or resource failure, creating a causation-based chain.
This pattern is identified by Site24x7 and related events are correlated into a single consolidated Problem. Along with event correlation, Problems expose a set of probable root cause events, help assess impacted components, and enable prioritization of resolution.
Preface
- Event: A single alert triggered by a change in state (from Up, Down, Trouble, or Critical to another state) or performance (threshold breach, response time spike, exception, etc.) of a monitored resource.
- Problem: Multiple related events that originate from a common underlying issue are correlated to form a single Problem.
- Root cause: The primary issue that triggers a chain of related events and leads to the creation of a Problem.
- Probable root causes: A list of likely sources identified through correlation and analysis, based on event patterns, dependencies, and behavior during the problem window.
- Trace Analysis: A deep drill-down capability (supported only for APM) that pinpoints the exact transaction, component, or method contributing to the issue.
- Smart Groups: Automatically organized groups of interdependent monitors, formed using topology, dependency mapping, tags, and monitor groups to enable meaningful event correlation.
What is event correlation?
Event correlation is the automated process of identifying patterns across multiple alerts from different monitor resources to uncover their underlying cause. Problems group events based on event correlation. In event correlation, Smart Groups—a blend of machine learning models, correlation methods, and AI-powered pattern recognition—helps to:
- Detect relationships among related alerts.
- Reduce noise by grouping dependent events.
- Prioritize key events by tracing them to their root cause.
What are Smart Groups?
Monitors with interdependencies or belonging to the same environment are automatically organized into Smart Groups. Using service dependency mapping, application discovery and dependency mapping (ADDM), network topology, application interactions, and dynamic relationships (such as Kubernetes), the system detects patterns among events based on their relevance and timing.
System-defined Smart Groups are auto-generated by Site24x7 and cannot be deleted. To include additional monitors in a Smart Group, they can be associated via Tags or Monitor Groups.
If a monitor has a specific tag or belongs to a monitor group linked to the Smart Group, it is automatically included. Removing the tag or monitor group association will automatically remove the monitor from the Smart Group.
View the smart groups by following the steps below:
- Log in to Site24x7.
- Navigate to Admin > Inventory > Smart Groups .
Each Smart Group shows more details like the list of monitors included in the group, the associated Problems, the Topology Map, Business View, Alert Logs, Outages, and so on.
How event correlation works
When infrastructure or performance issues such as a monitor going down or a spike in response time occur, Site24x7 gathers events and monitor statuses from the Smart Groups. Events are grouped based on their relevance and timing to determine whether they are symptoms of a larger underlying issue.
Through domain-aware correlation, the system maps the knowledge of specific environments, such as applications, to connect events with deeper context. Causal analysis then evaluates event timelines, dependencies, and behavioral patterns to trace back to the most likely root cause. This ensures that critical issues are surfaced as prioritized problems that need attention, while unrelated or low-impact events are filtered out phenomenally, minimizing the events count.
Root cause analysis
Once a problem is created through event correlation, the system performs root cause analysis to help identify the underlying issue quickly and accurately.
Root cause analysis is based on a combination of known issue patterns, system behavior, and historical data to determine the most likely cause. When multiple related events occur within the same time frame, the common cause is identified, and the Trace Analysis pinpoints the exact source of the events.
Understanding trace analysis
Trace Analysis is an in-depth analysis supported only for specific application monitors. During root cause analysis, for supported monitors like Application Performance Monitors, a drill-down to the code level pinpoints the exact component or method that triggered the issue. The identified sources of events are listed as probable causes.
How to correlate events
To view and analyze correlated problems, follow the steps below.
- Navigate to Alarms > toggle to Problems .
- On the left panel, you can:
- Filter problems that are currently active or those created in the last 24 hours by selecting the Current or Last 24 Hours tab.
- View the count of unacknowledged and acknowledged Problems in the Open and Acknowledged tabs. The priority of the problems is system-determined and you can filter problems based on their priority.
- Filter the problems based on the associated Smart Group and Environment.
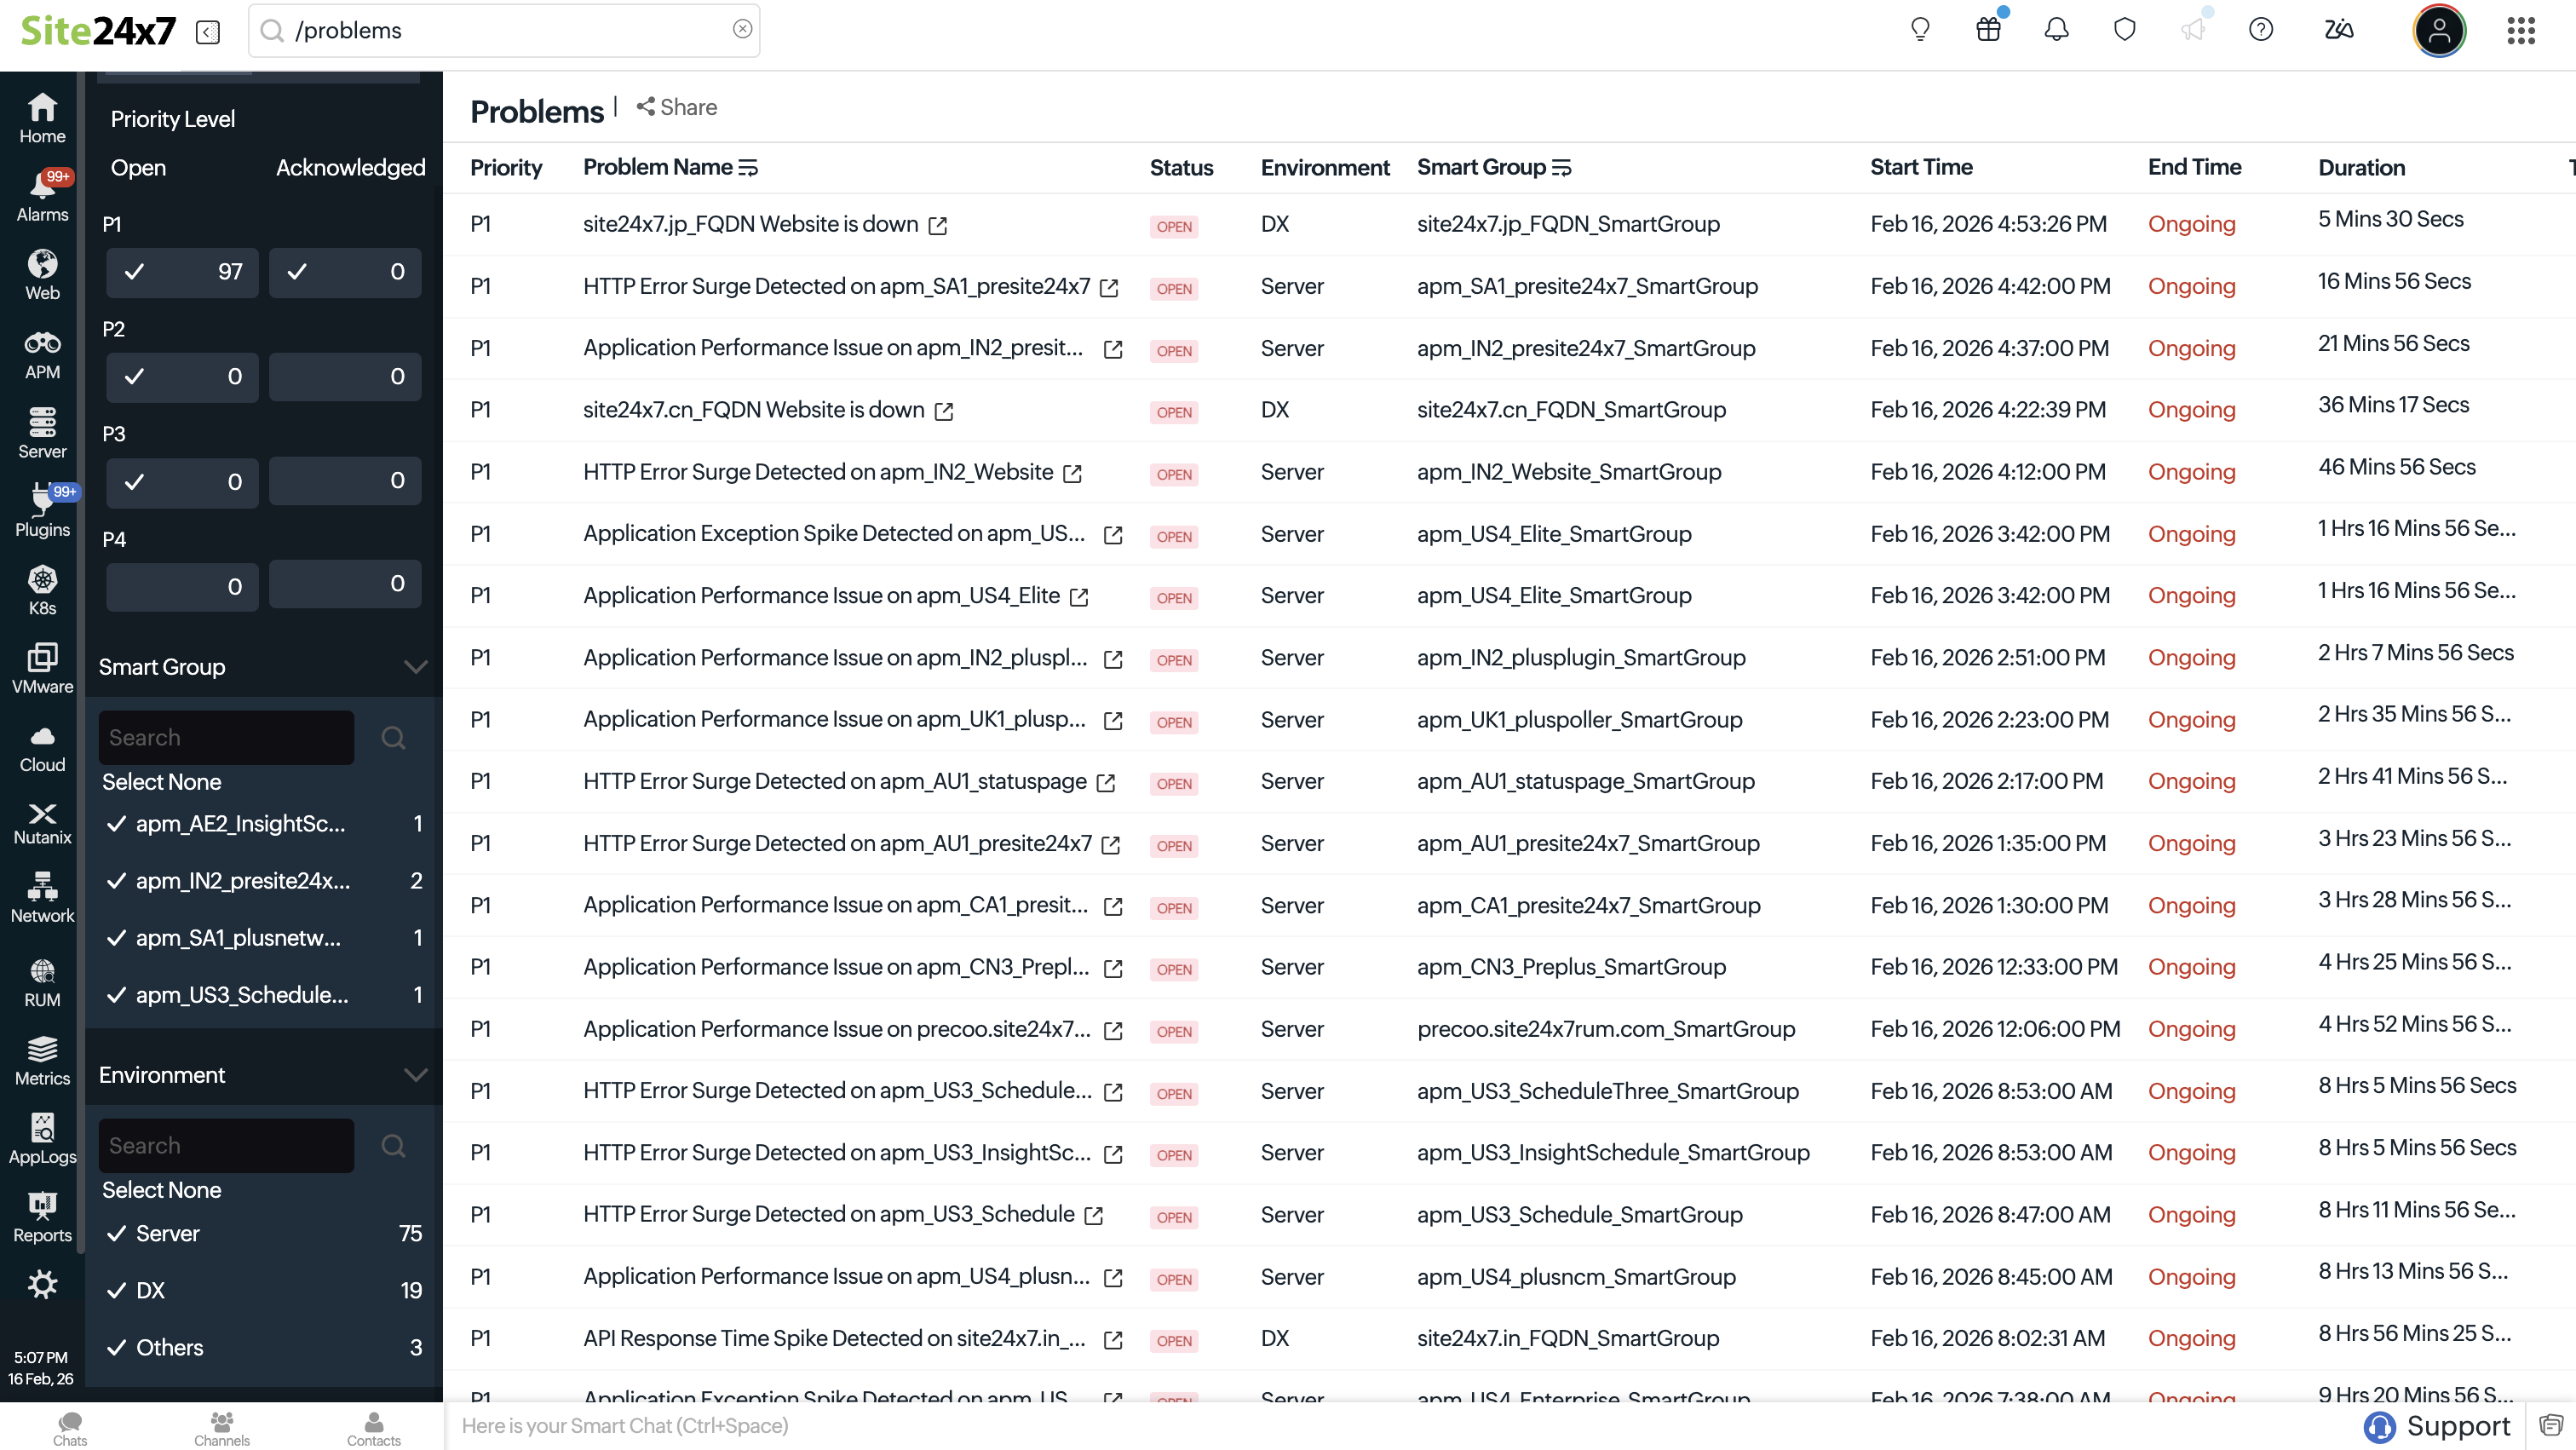
- The Problem list page shows Problems details:
- Priority: Displays how important the Problem is, based on the system's assessment.
- Problem Title: Displays the title of the Problem.
- Status: Displays whether the Problem is Open or Closed.
- Environment: Displays the top-level category where the Problem was detected.
- Smart Group: Displays the Smart Group that is associated with the current problem.
- Start Time: Displays the initiation time of the Problem.
- End Time: Displays the end time of the Problem.
- Duration: Displays the time span of how long the Problem has been active.
- Technician: Displays the name of the technician who is allocated to resolve the Problem or Unassigned if no technician has been assigned.
NoteOnce a technician is assigned, the Problem is considered acknowledged. Technicians cannot be assigned to closed Problems.
- Click share icon
 to download the Problem details as a CSV, export them as a PDF, or send them via email.
 - To delete a problem, click the hamburger icon
 and select Delete.
 - For further analysis of why a Problem happened, probable root causes, impacted monitors, and more, click that Problem.
Drill down into Problems
Once the events are correlated and the root cause is determined, you can learn more about the Problem by navigating through the following tabs for each Problem.
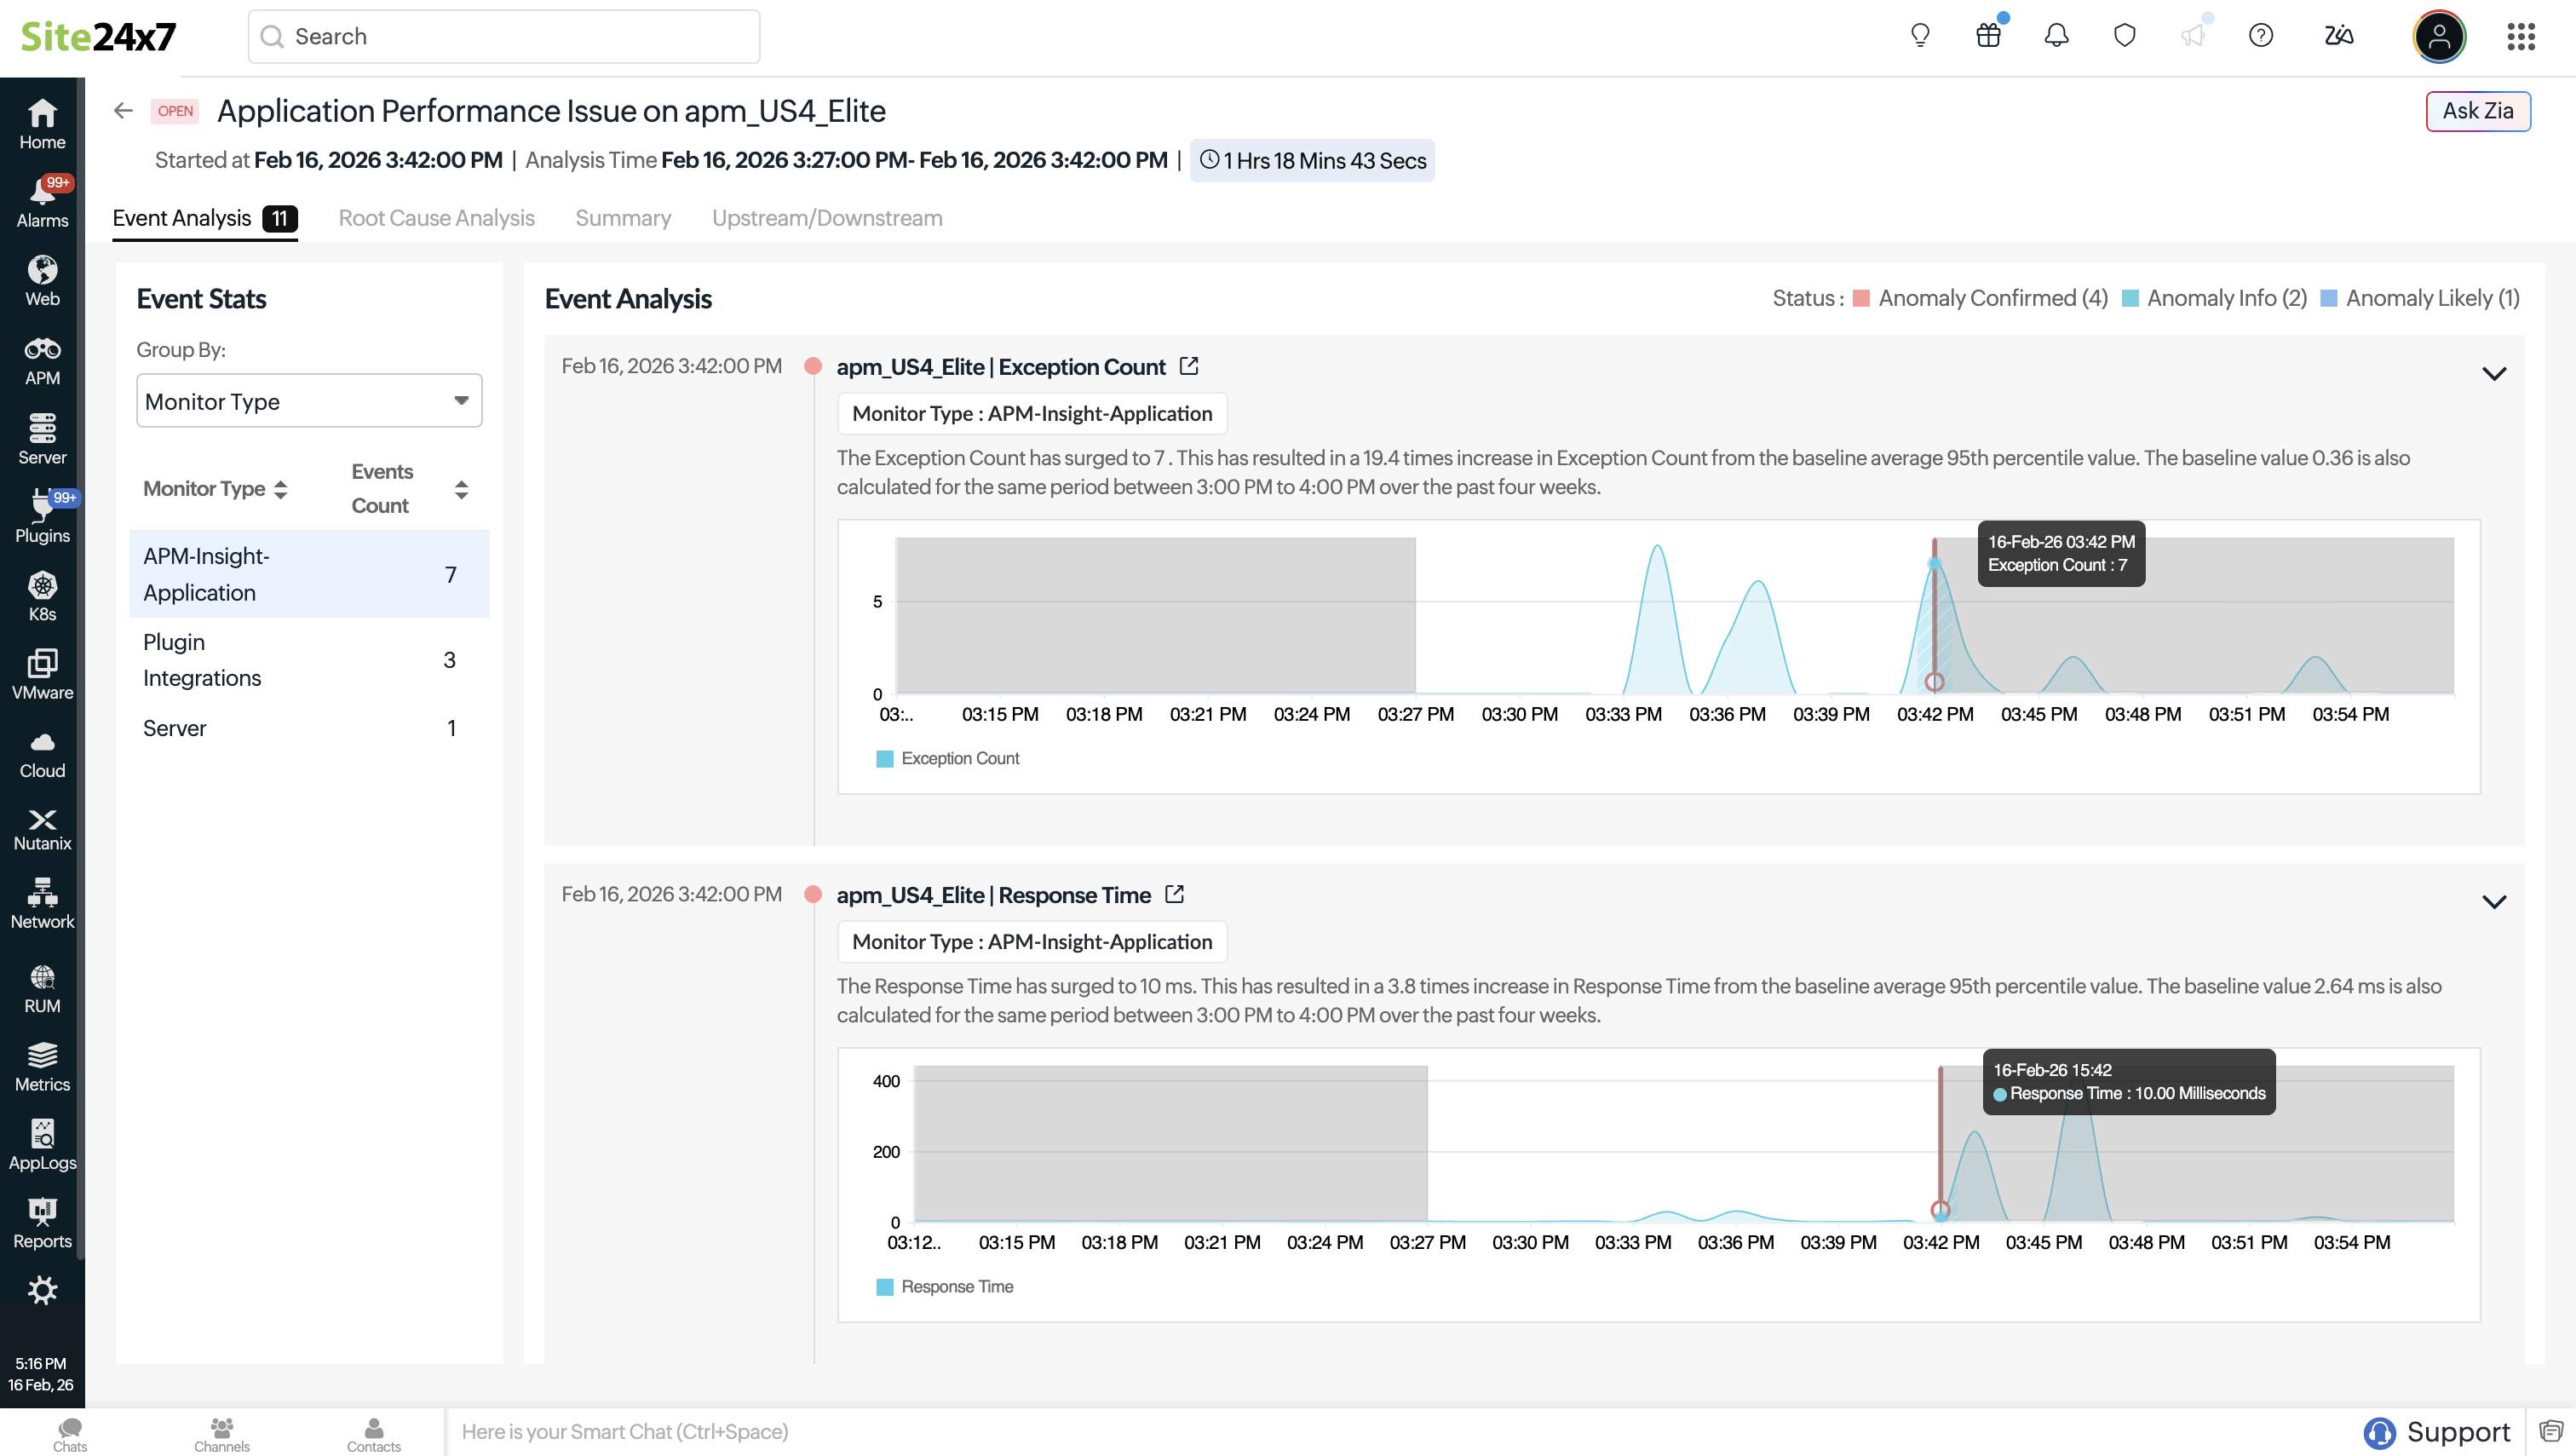
Event Analysis
The Event Analysis section shows a timeline of all events correlated to a problem. Each event displays key details such as timestamp, affected resource, and attributes, monitor type, and severity. The event is marked as the target event, representing the primary trigger, while related events add supporting context.
If available, events are compared against historical baselines to show deviations from normal behavior. You can group the events using the Group by drop-down menu. Events can be grouped by:
- All
- Monitor Type
- Monitors
- Attributes
- Probable Root Causes
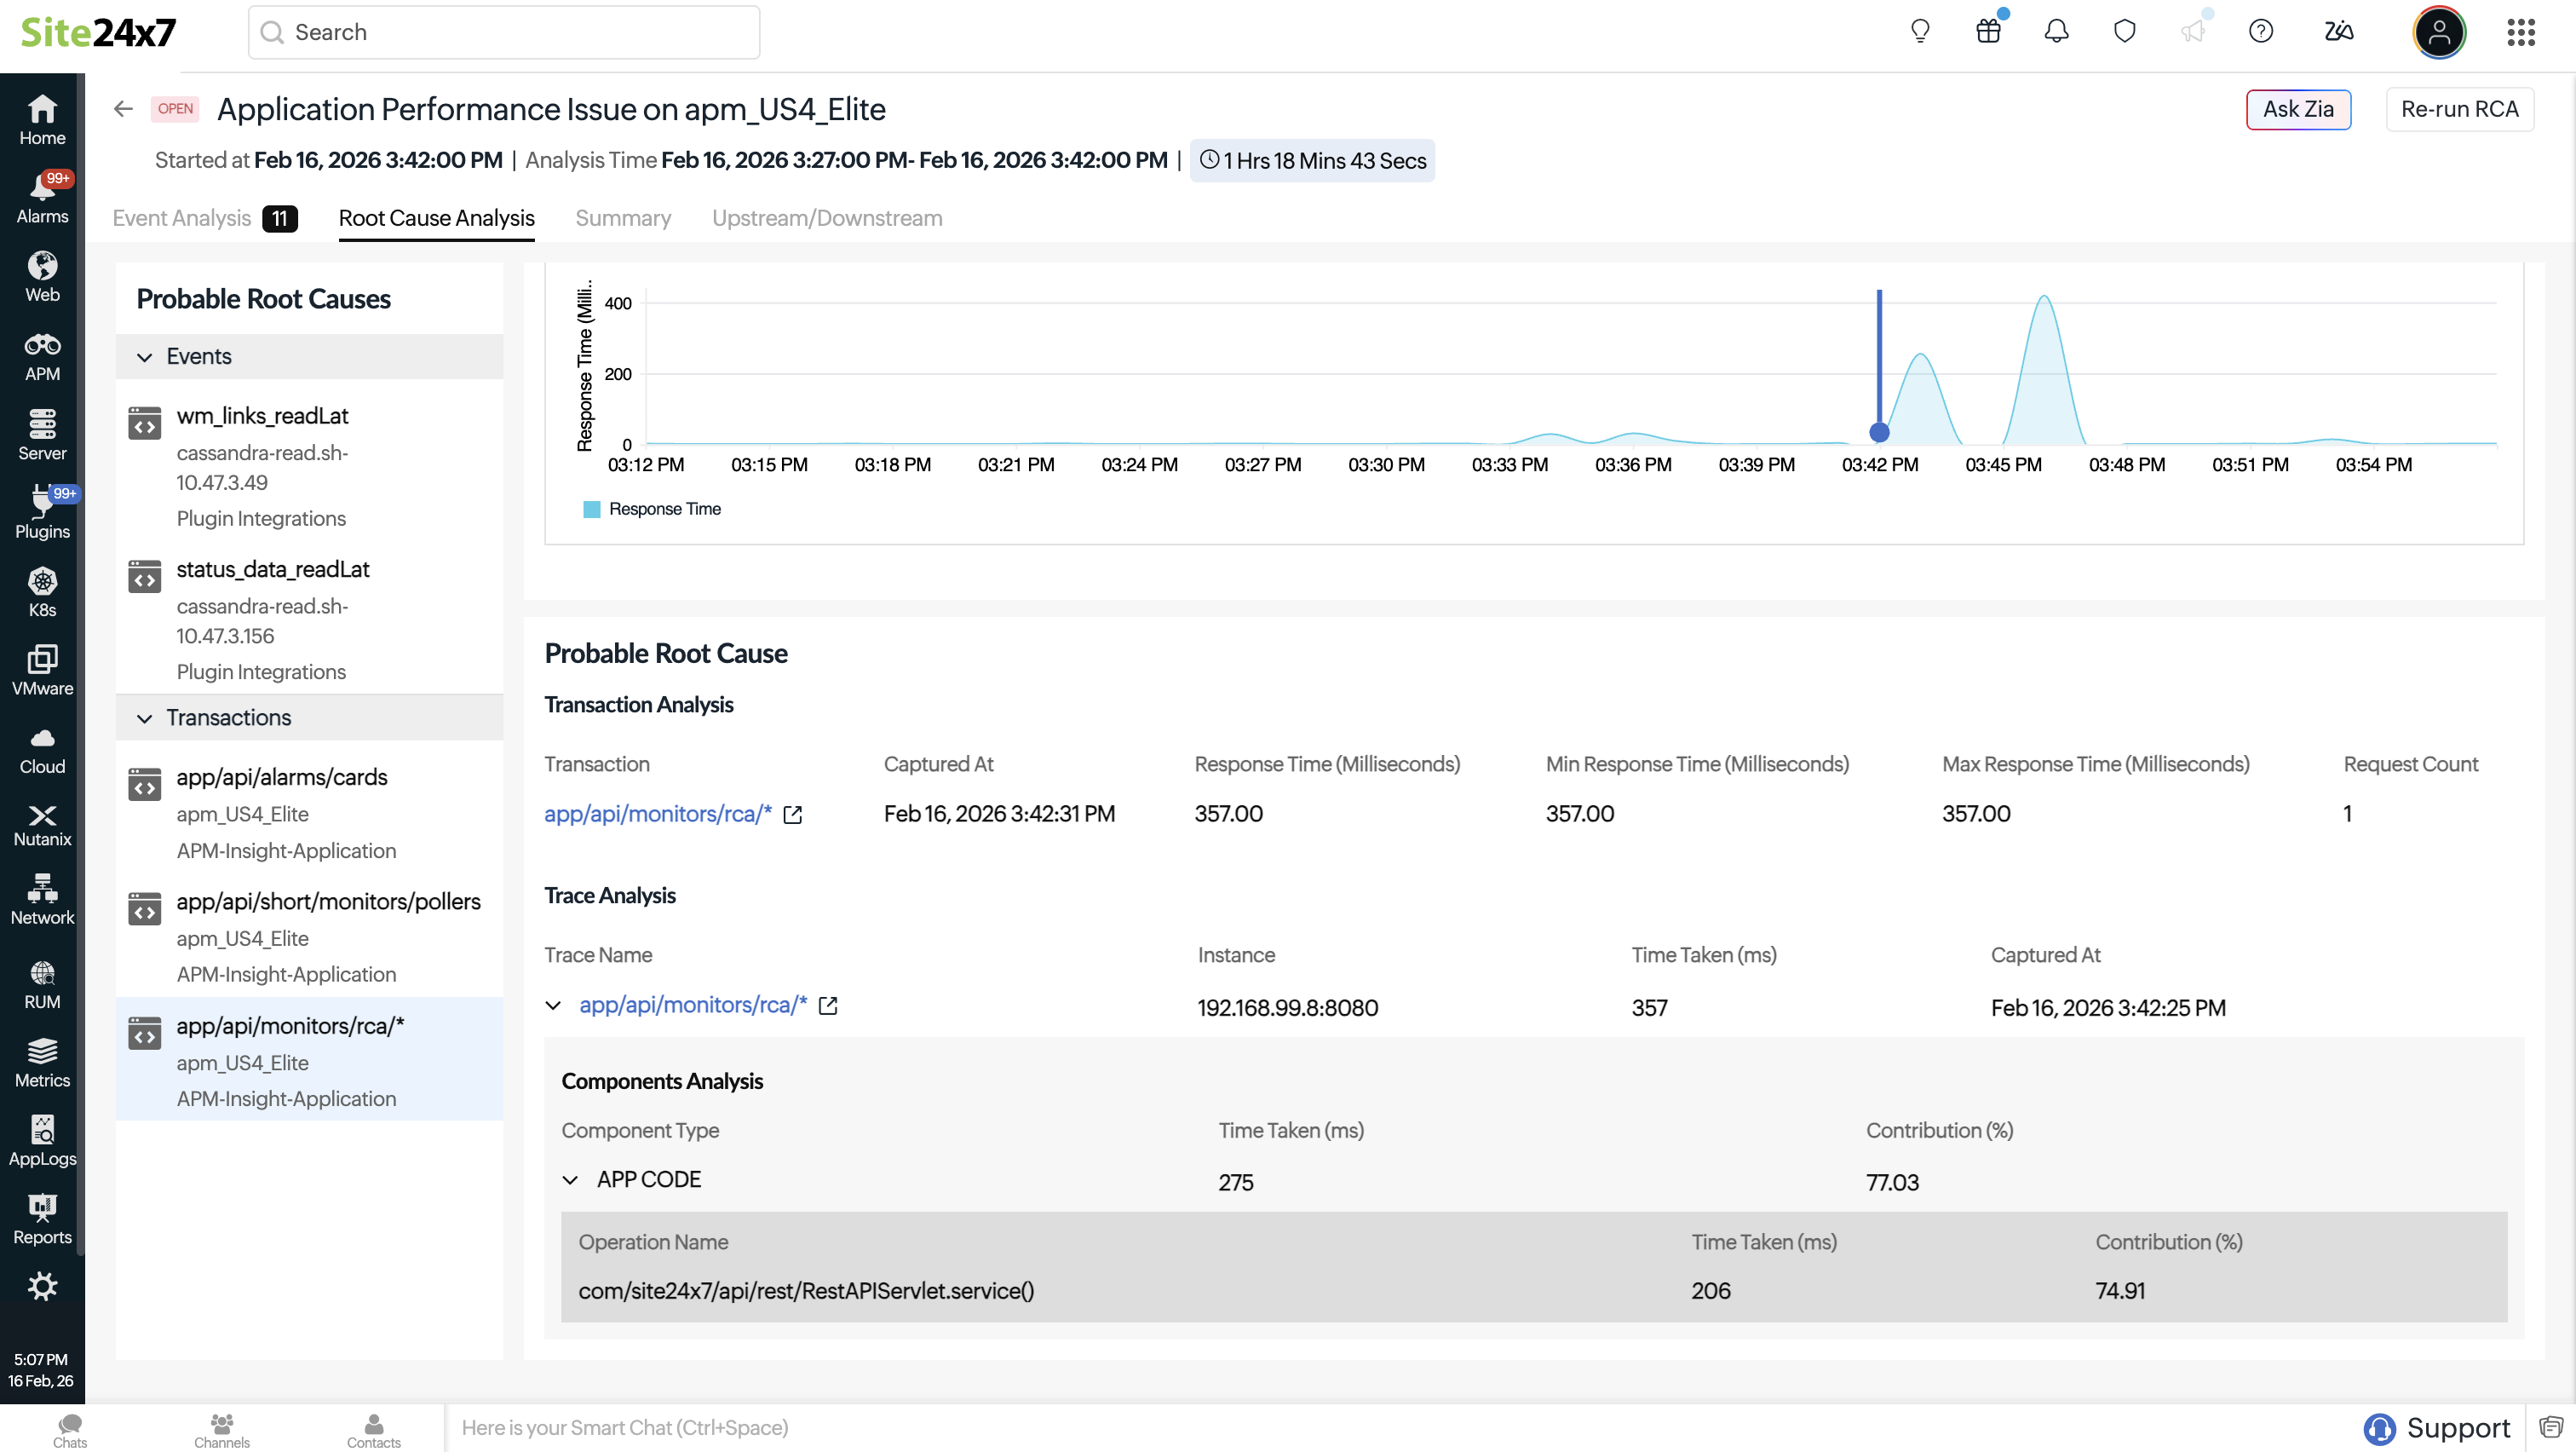
Root Cause Analysis
The Root Cause Analysis section identifies the most likely cause of a Problem by analyzing correlated events and performance data. It focuses on identifying why the Problem occurred by examining abnormal behavior across affected components, transactions, and metrics during the Problem window.
This section typically presents a list of probable root causes, such as transactions or application components that showed signifi cant deviation from normal behavior. Selecting a probable cause reveals contextual details including the affected monitor, monitor type, and the specific metric that contributed to the Problem.
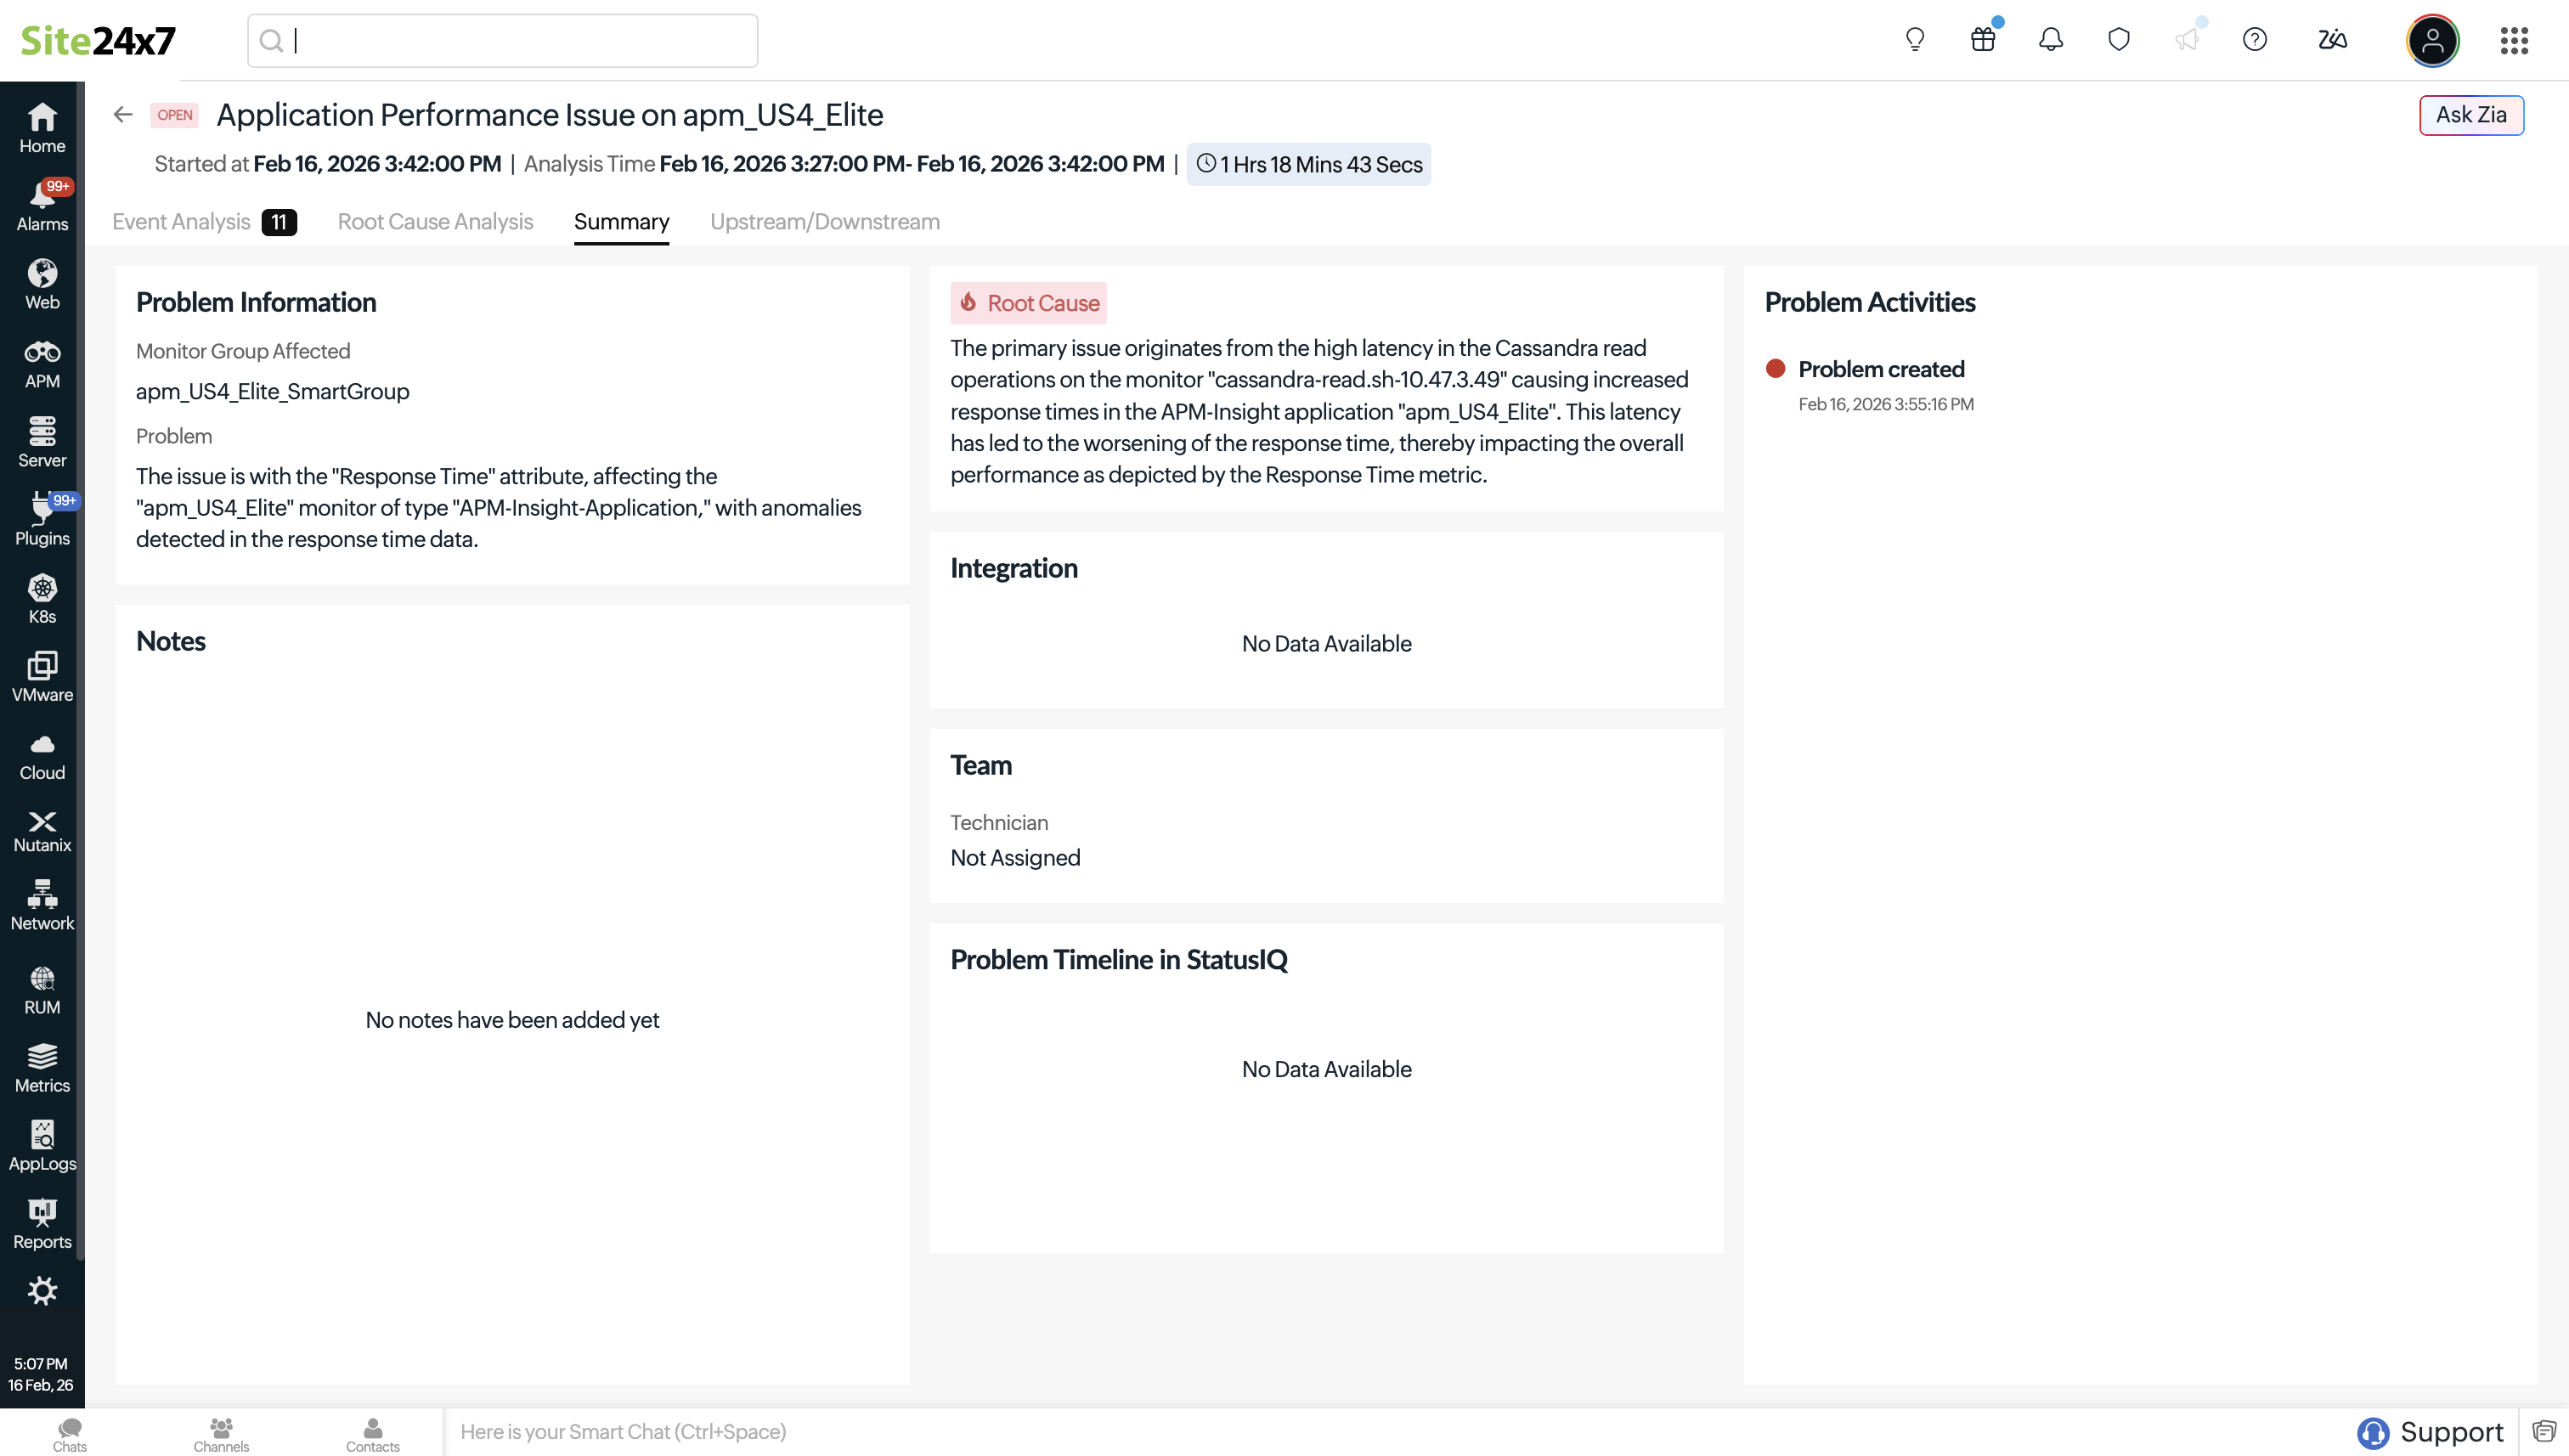
Summary
The Summary tab provides a quick overview of the Problem, from detection to resolution. It shows Problem details and the affected monitored group. The root cause summary explains the most likely cause identified through correlation and analysis.
Additionally, it provides details about the assigned technician and includes integration details elaborating on the external tools involved (such as the ticketing systems through which the Problem was shared).
For collaboration and documentation, the Notes section allows you to add observations and remediation details. The activity timeline highlights key lifecycle events, including when the Problem was created and resolved, giving you a clear view of the Problem’s progression at a glance.
Upstream/Downstream
The Upstream/Downstream section displays the relationship between the Smart Groups and the direction in which transactions, requests, or dependencies flow across different layers of the infrastructure.
- Upstream refers to the source layer that sends requests or dependencies to another Smart Group. For example, a Network Smart Group that routes traffic to an Application Smart Group, meaning network disruptions can directly impact application availability.
- Downstream refers to the destination layer that receives requests or depends on another Smart Group. For example, a Kubernetes Infrastructure Smart Group that supports a Kubernetes Deployment Smart Group, meaning infrastructure failures can affect deployed workloads.
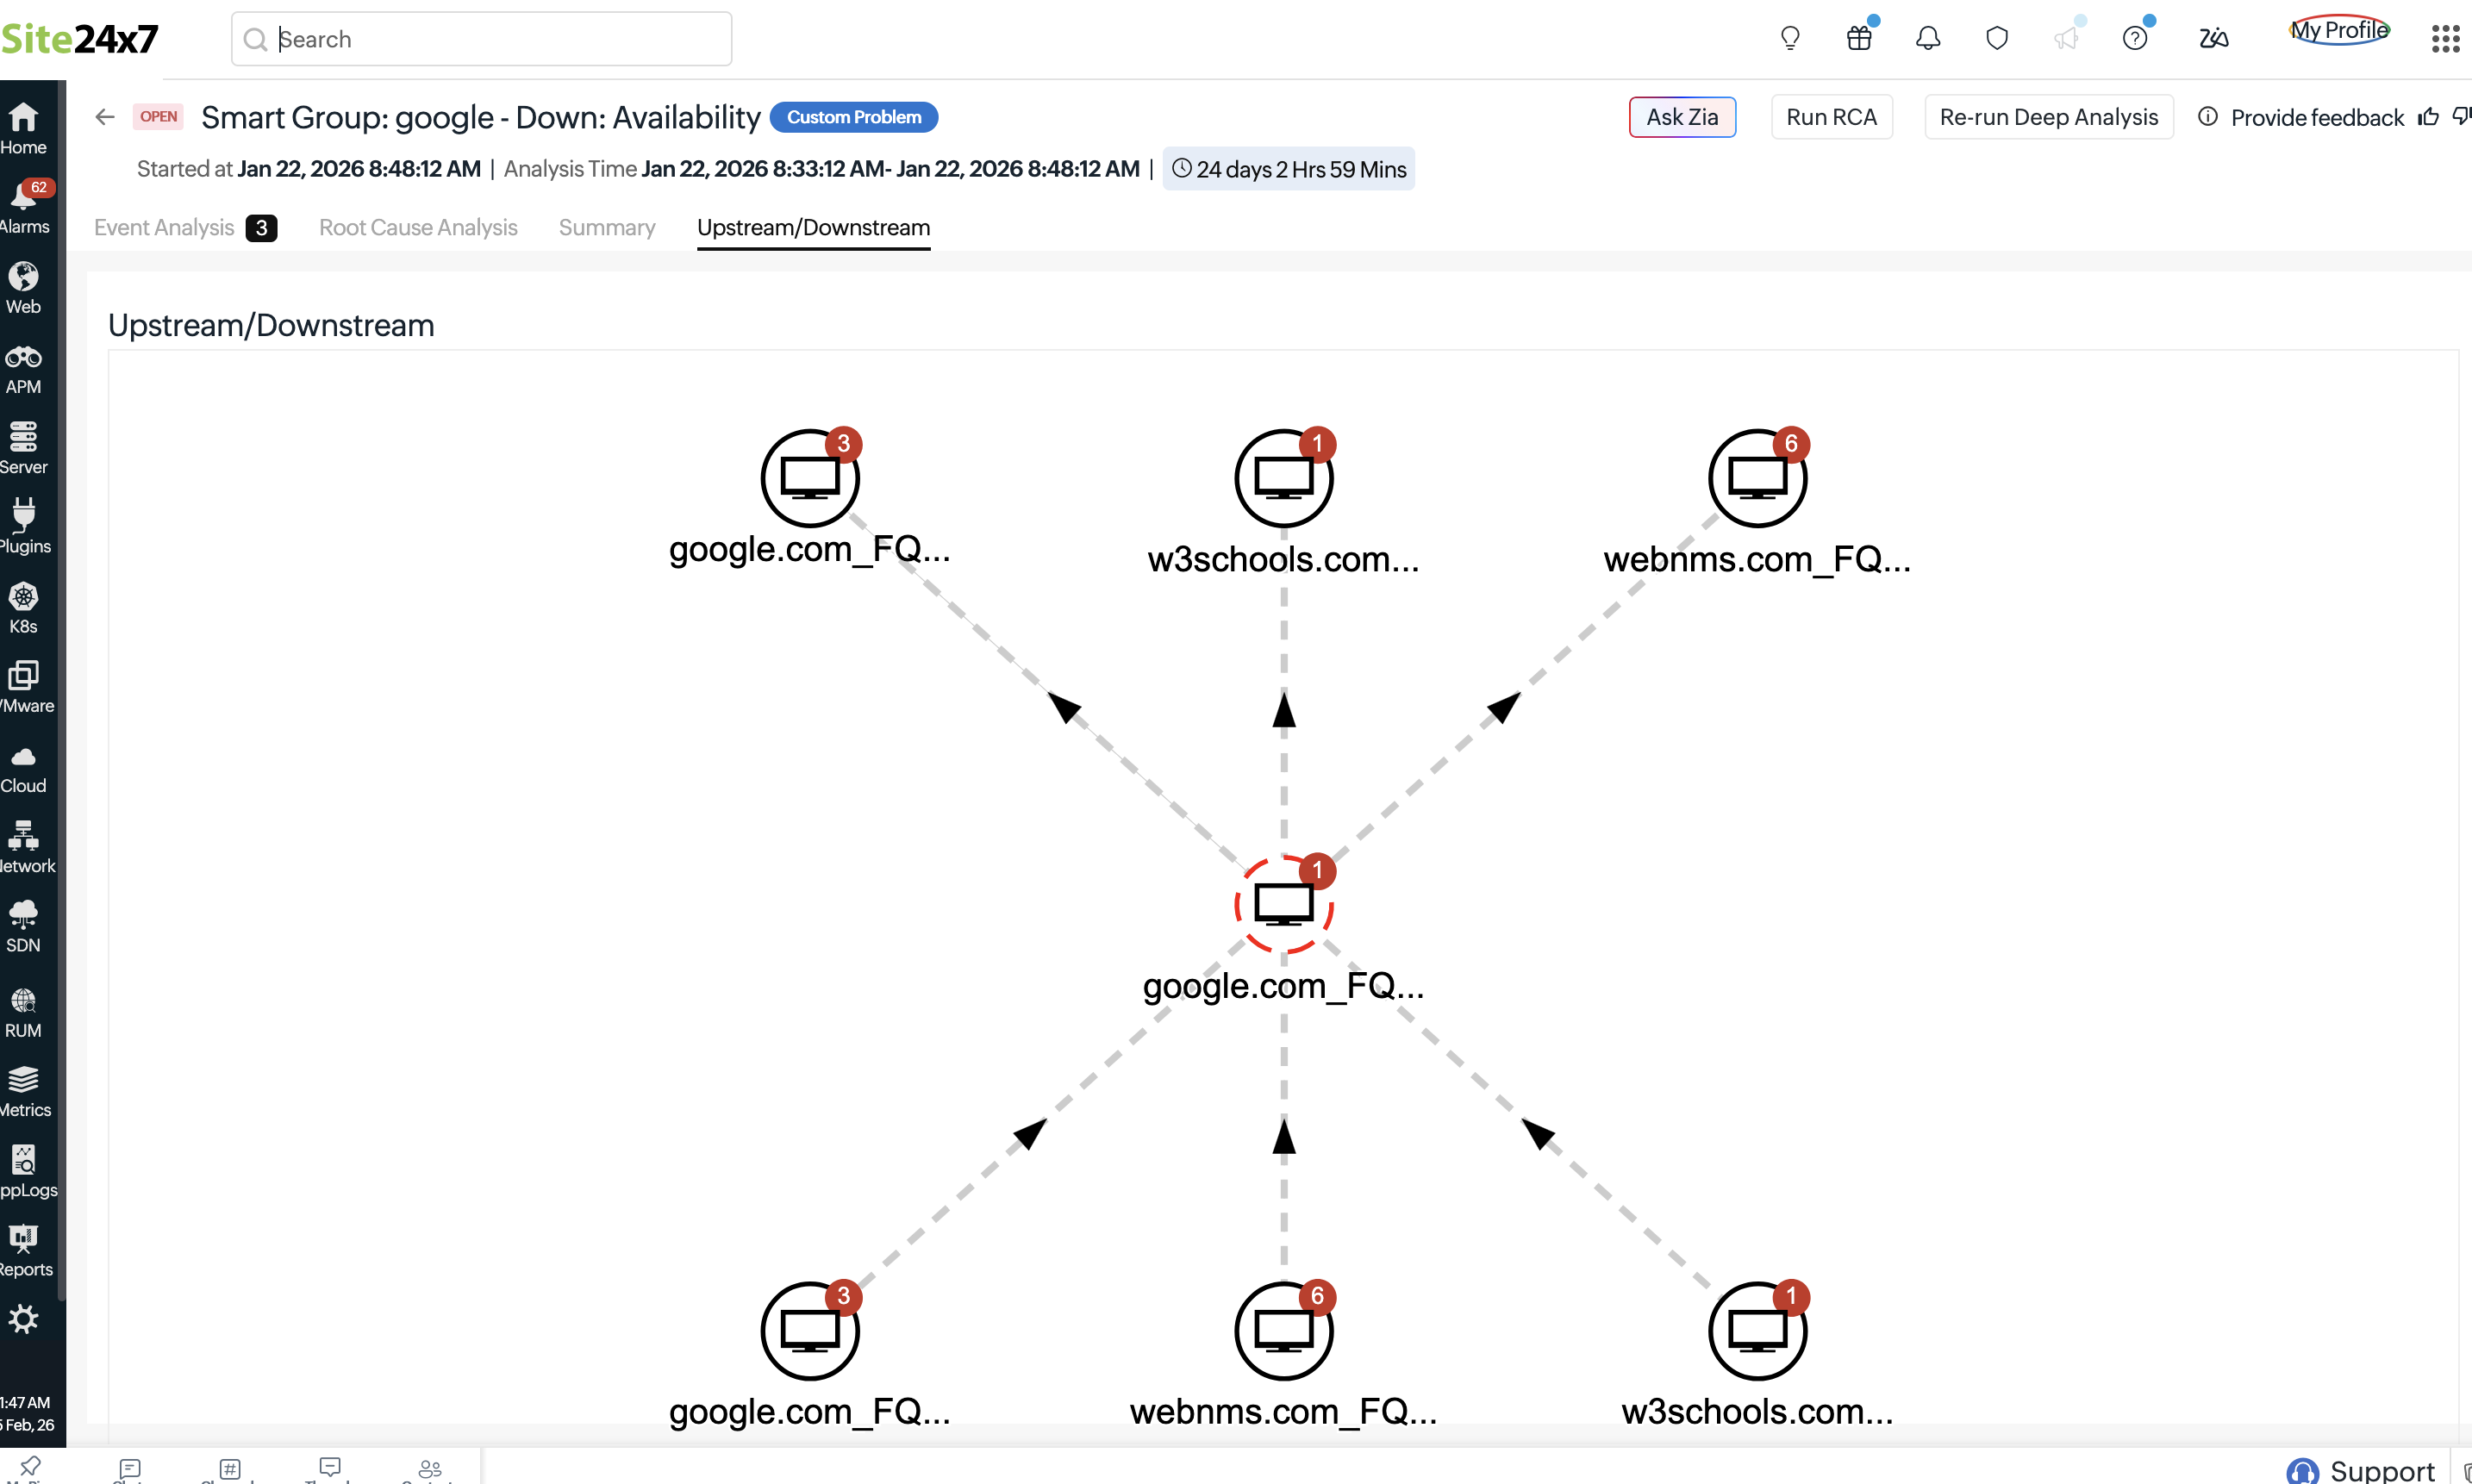
When configured, this setting displays a topology-map-like structure in Problems, helping visualize service dependencies and trace the flow of impact.