Monitoring VMware NSX-T Manager
VMware Network and Security Virtualization - Transformers (NSX-T) Manager serves as the centralized management and control hub for your virtual network, helping you oversee the configuration, management, and monitoring of networking and security services across your virtualized data center. NSX-T can:
- Autodiscover your entire NSX infrastructure, including NSX Gateway and NSX Node.
- Visualize logical networking, security, and services metrics in one view.
- Integrate closely with VMware vCenter to enforce policies on VMs and workloads.
Use case
- Centralized network policy management: Administrators can create and monitor networking and security policies from a unified visual console.
- Operational visibility and troubleshooting: Network teams need faster root cause analysis for connectivity or security issues. VMware NSX-T offers centralized visibility into VMware NSX component health, configuration status, and events, making troubleshooting quicker.
- Rapid application deployment: To deploy new applications quickly without waiting on network provisioning. Logical networks, routing, and security policies are software-defined and monitored effortlessly.
Prerequisites
- Install version 6.8.2 or later of Site24x7's On-Premise Poller.
Adding a VMware NSX-T Manager as a monitor
To add a NSX-T, follow the steps below:
- Log into your Site24x7 account.
- Navigate to VMware > NSX-T Resources. Click the plus icon + beside NSX-T Manager.
- Select Install On-Premise Poller if you don't have an existing On-Premise Poller set up to monitor your NSX-T Resources. Then, follow the steps to add an On-Premise Poller. Once added, select the required On-Premise Poller as given in the next step.
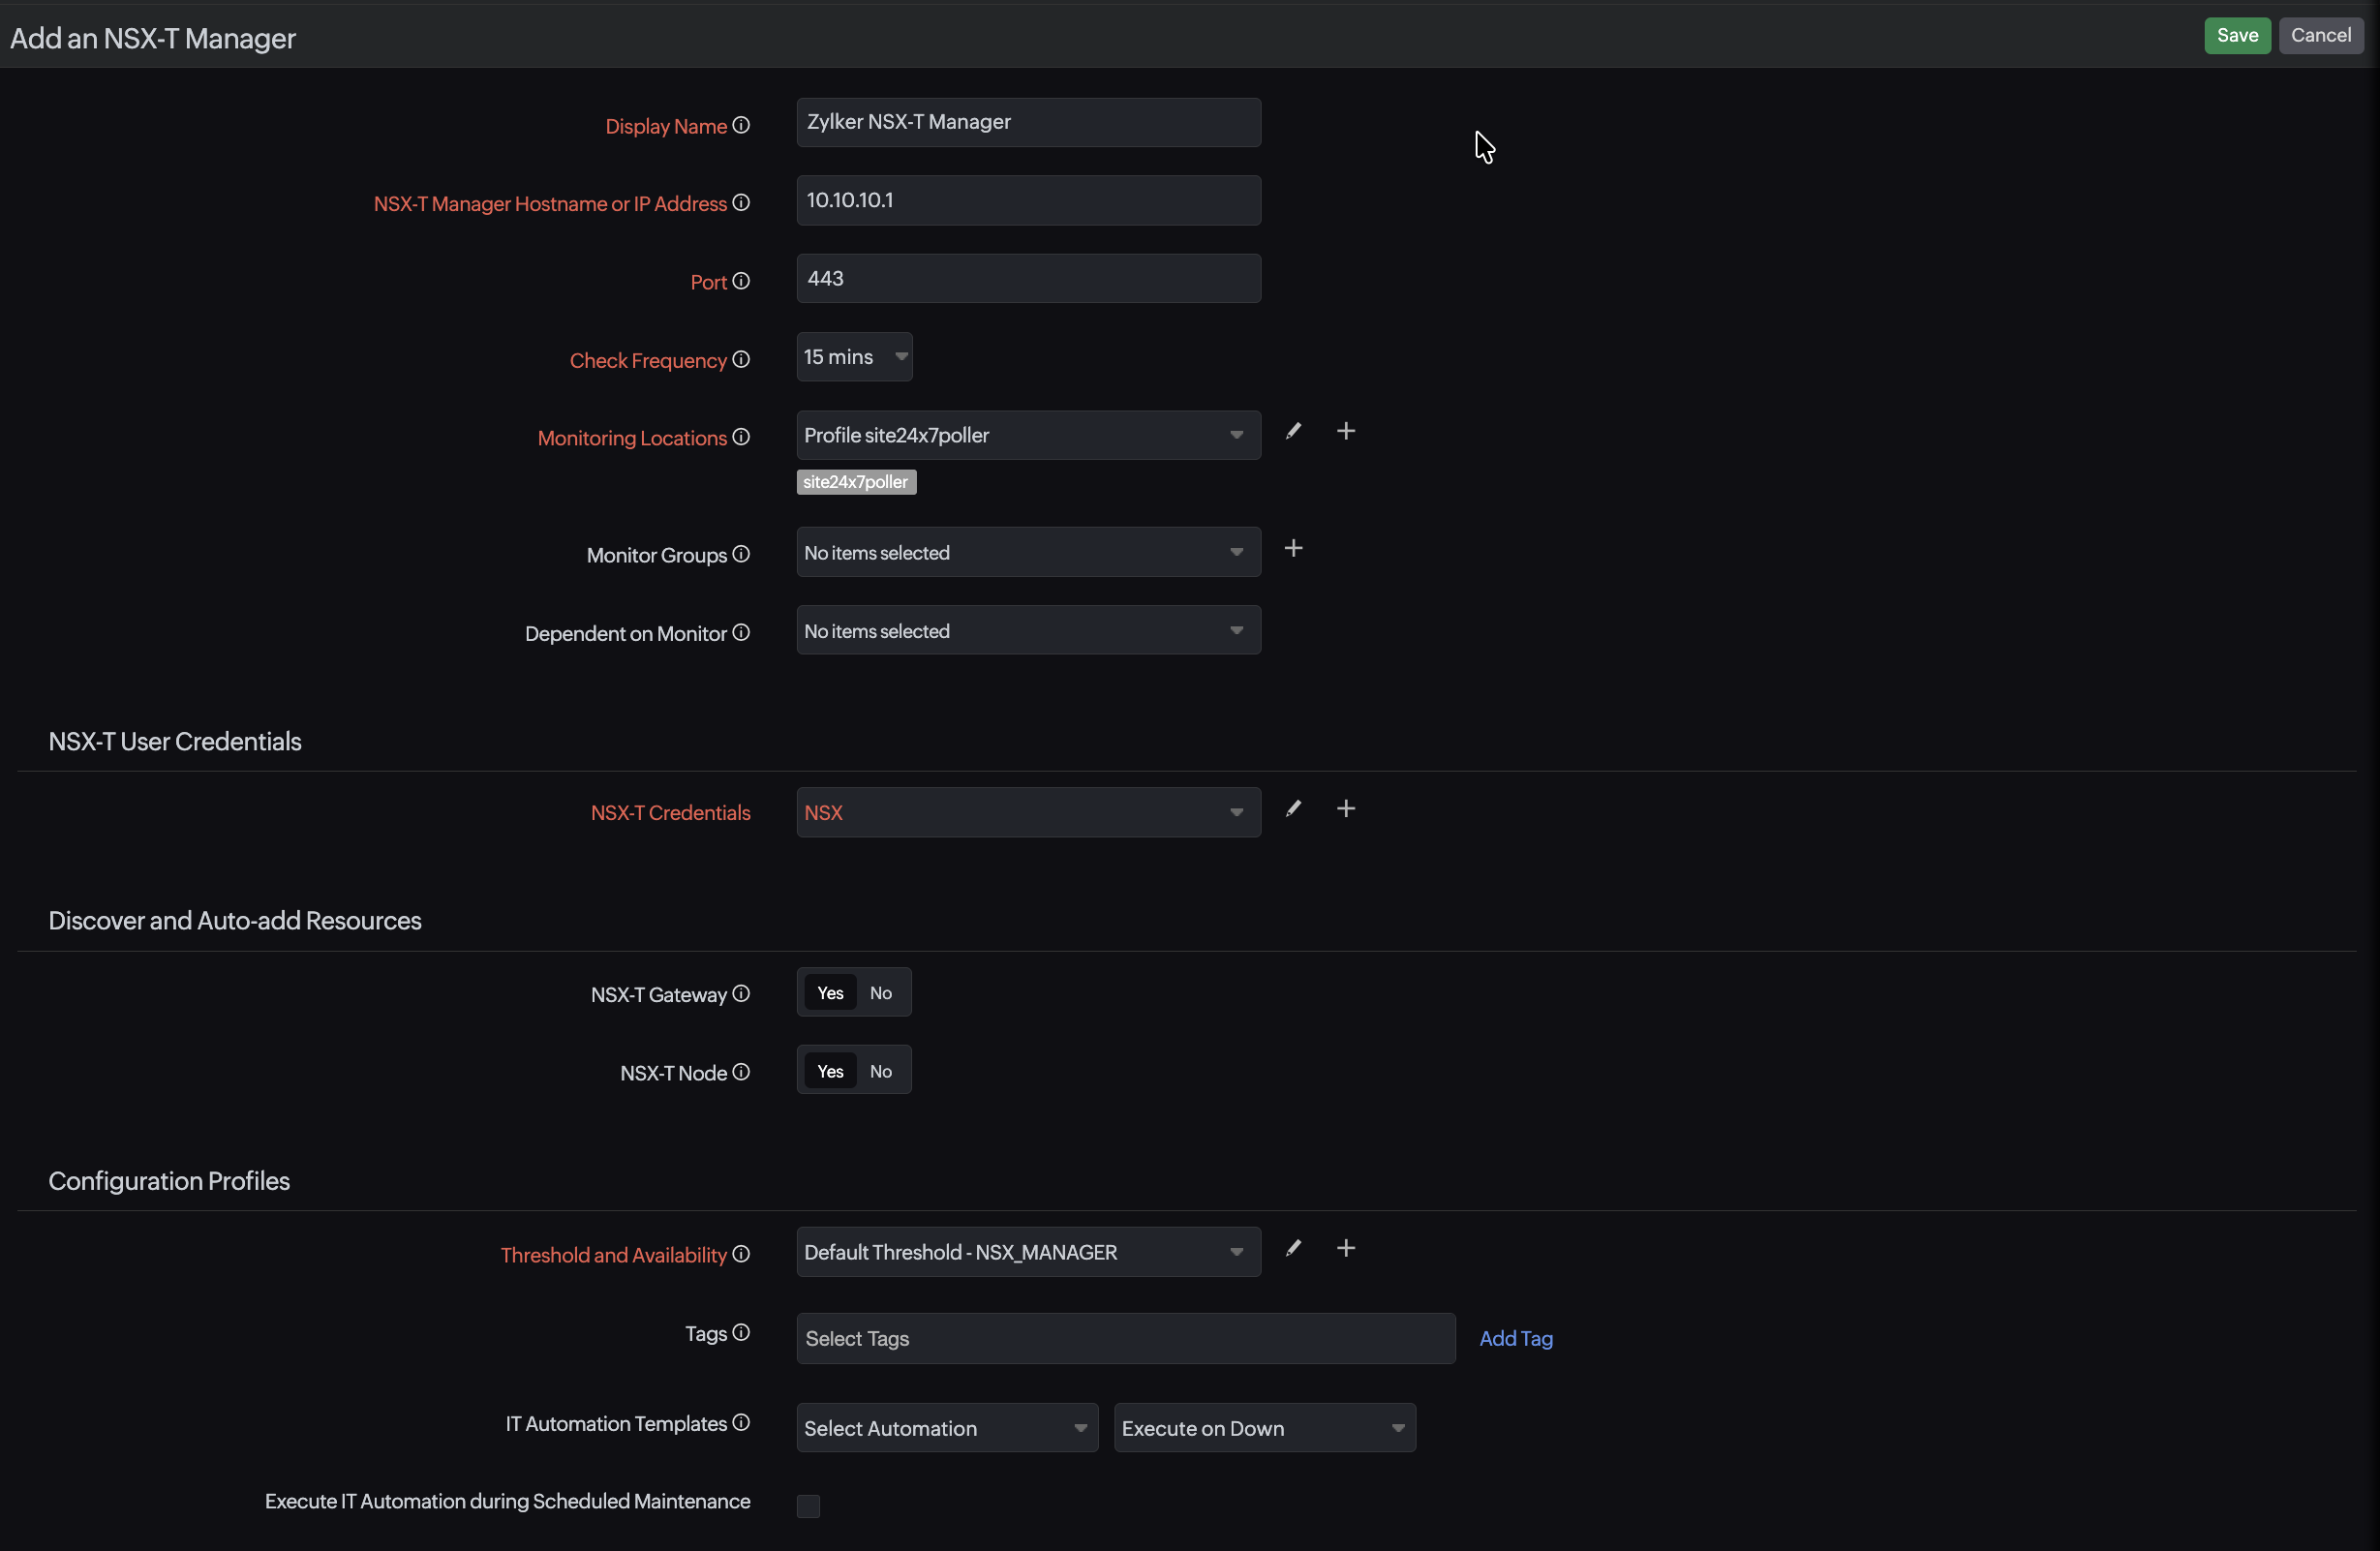
- If you already have an On-Premise Poller installed, click Choose On-Premise Poller and select the required one. Then, click Next. On the Add NSX-T Manager page, specify the following information to add the NSX-T Manager monitor:
- Display Name: Specify a name to identify the NSX-T.
- Hostname or IP Address: Specify the IP address or domain name of the VMware NSX-T Manager.
- Port: Specify the port number where the VMware NSX-T manager is running.
- Check Frequency: Choose a polling frequency from the drop-down menu list.
- Monitoring Locations: Select the location from the drop-down menu from where the VMware NSX-T environment should be monitored. To know more, refer to Location Profile.
- Dependent on monitor: From the drop-down menu, select the monitor on which this monitor has to depend on. You can add up to five monitors as dependents. Site24x7 will suppress alerts for the configured VMware NSX-T monitor if the dependent monitor is already down.
- NSX-T User Credentials: Select the appropriate credentials stored in the Site24x7 Credential Profile or add new ones by clicking the plus icon + beside the field.
- Discover and Auto-add resources: Toggle to Yes or No to enable monitoring for the resources associated to this VMware NSX-T Manager.
- NSX-T Gateway: Toggle to Yes to enable monitoring for all the Gateways in the NSX-T Manager. The discovered Gateway will be listed under VMware > NSX-T Resources > NSX-T Gateway.
- NSX-T Node: Toggle Yes to enable monitoring for all the nodes. The discovered node will be listed under VMware > NSX-T Resources > NSX-T Node. By enabling these options, you will be able to add all the resources in one go.
Note: You can also monitor the associated Node in depth, with various performance metrics and also save the time of manually adding them separately for monitoring.
- Specify the following details for Configuration Profiles:
- Threshold and Availability: Select a threshold profile from the drop-down menu, use the default threshold profile available, or create a new one. Get notified when the resources cross the configured threshold and availability.
- Tags: Associate your monitor with a predefined Tag or multiple Tags to help organize and manage your monitors creatively.
- IT Automation Templates: Select an automation to be executed when there is a change in the state of a NSX-T Manager. The defined action gets executed when there is a state change and selected user groups are alerted.
- Specify the details for Alert Settings:
- User Alert Group: Select the user group that needs to be alerted during an outage. You can add multiple users to a group.
- On-Call Schedule: Select an On-Call Schedule from the drop-down menu to stay updated via notifications in case of any incident or outage.
- Notification Profile: Select a Notification Profile from the drop-down menu or select the default profile available. Notification profile helps to configure when and who gets notified in case of downtime.
- Third-Party Integration: Associate your monitor with a preconfigured third-party service. It lets you push your monitor alarms to selected services and facilitate improved incident management.
- Services: To set up an integration, navigate to Admin > Third Party Integration.
- Click Save.
Once you have completed these steps, your NSX-T Manager will be successfully added to Site24x7.
Verify the added VMware NSX-T Manager
Once you have successfully added the NSX-T Manager, all the NSX-T Node and NSX-T Gateway will be discovered. To view the discovered monitors follow the below step:
- Navigate to VMware > NSX-T Resources > Monitors.
- All the child and parent monitors will be displayed in one consolidated view.
Editing the VMware NSX-T Manager monitor details
To edit the details for the VMware NSX-T Manager monitor:
- Navigate to VMware > NSX-T Resources > Monitors.
- Click the hamburger icon corresponding to the monitor's name and click Edit.
- Update the details and click Save.