
SAP NetWeaver ABAP monitoring
Site24x7’s SAP NetWeaver ABAP Monitor enables you to monitor the availability, performance, and health of your SAP NetWeaver ABAP environment. Monitor system information, host resources, work processes, dialog performance, background processing, buffers, enqueue operations, spool processes, background jobs, RFC queues, locks, alerts, and other key SAP metrics from a unified view.
Prerequisites
Before adding an SAP NetWeaver ABAP monitor, ensure the following prerequisites are met:
- Incorporate SAP Java Connector (JCo)
- SAP Java Connector (JCo) must be added to the On-Premise Poller’s classpath.
- SAP JCo does not have a redistribution license. Download the required SAP JCo files and manually add them to the On-Premise Poller.
- Copy the
sapjco3.jarJava library to the following location:Linux:
/opt/Site24x7OnPremisePoller/lib/jars
Windows:
C:\Program Files (x86)\Site24x7OnPremisePoller\lib\jars
- Copy the corresponding native library to the following location:
Linux:
Copy
libsapjco3.soto:/opt/Site24x7OnPremisePoller/lib/native
Windows:
Copy
sapjco3.dllto:C:\Program Files (x86)\Site24x7OnPremisePoller\lib\native
- For Linux, add the following line in
StartServer.shat line 7:export LD_LIBRARY_PATH="$EUM_HOME/lib/native":$LD_LIBRARY_PATH
- Configure the SAP Gateway port
The SAP Gateway port must be open for both inbound and outbound traffic in the firewall. The default SAP Gateway port is 3300.
To verify the RFC port:
- Open SAP Management Console.
- Expand the SAP instance.
- Select Access Points.
- Check the port listed for the RFC protocol.
- Configure SAP user authorizations
The SAP user profile used for monitoring must have the following authorization objects:
- S_RFC: RFC access
- S_XMI_LOG: Monitoring and diagnostics
- S_XMI_PROD: Production monitoring
- To view the authorizations assigned to a user, execute transaction code
SU56in SAP Logon.
Add a monitor
- Navigate to Apps > Enterprise Applications > SAP ABAP and click the + icon.
- From the Add SAP ABAP Monitor page, add an On-Premise Poller or choose from an existing On-Premise Poller that has network access to the SAP ABAP system.
Note: SAP ABAP monitoring is supported from Poller version 6.9.3 and above.
- Fill in the following details to add the SAP ABAP application server monitor:
- Display Name: Specify a name to identify the SAP ABAP monitor.
- Host Name/IP Address: Provide the hostname or IP address of the server where the SAP ABAP application server is running.
- Client: Specify the SAP client number used to connect to the SAP ABAP system.
- System Number: Specify the two-digit SAP system number of the application server instance.
- Router String: Specify the SAProuter connection string used to connect to the SAP ABAP system through an SAProuter, if applicable.
- Check Frequency: Choose a polling frequency from the drop-down menu.
- Location Profile: Select the location profile from where the SAP ABAP application server can be monitored from the drop-down menu. To learn more, refer to the Location Profile help document.
- Associate with Monitor Group(s): Select a monitor group from the drop-down menu to logically group your monitors. To learn how to create a group for your monitors, refer to the Monitor Groups help document.
- In the User Credentials section, choose the appropriate credentials stored in the Site24x7 credential profile or add new ones.
To add a new credential:
- Click the + icon next to the SAP Credentials field.
- In the resulting Add Credential pop-up, provide a Credential Name to identify the credential. SAP ABAP will be auto-selected as the Credential Type.
- Provide the Username and Password of the associated SAP ABAP Application Server account.
- Click Save.
- Specify the following details for Configuration Profiles, Alert Settings, and Third-Party Integrations:
- Tags: Associate your monitor with predefined tags to organize and manage your monitors creatively. Learn how to add tags.
- IT Automation Templates: Select an automation to be executed when the SAP ABAP application server's status is down, trouble, or up; when there's any status change; or when there's any attribute change. The defined action gets executed when there is a state change, and the selected user groups get alerted. To automate corrective actions upon a failure, refer to the IT automation help document.
- User Alert Group: Select the user group that needs to be alerted during an outage. To add multiple users to a group, see the user alert group help document.
- Notification Profile: Choose a notification profile from the drop-down list or select the default profile available. A notification profile helps you configure who gets notified and when in the event of downtime. Refer to the notification profile help document to create a customized notification profile.
- Third-Party Integrations: Associate your monitor with preconfigured third-party services. This lets you push your monitor alarms to selected services and facilitate improved incident management.
- Click Save.
Performance metrics
System Information
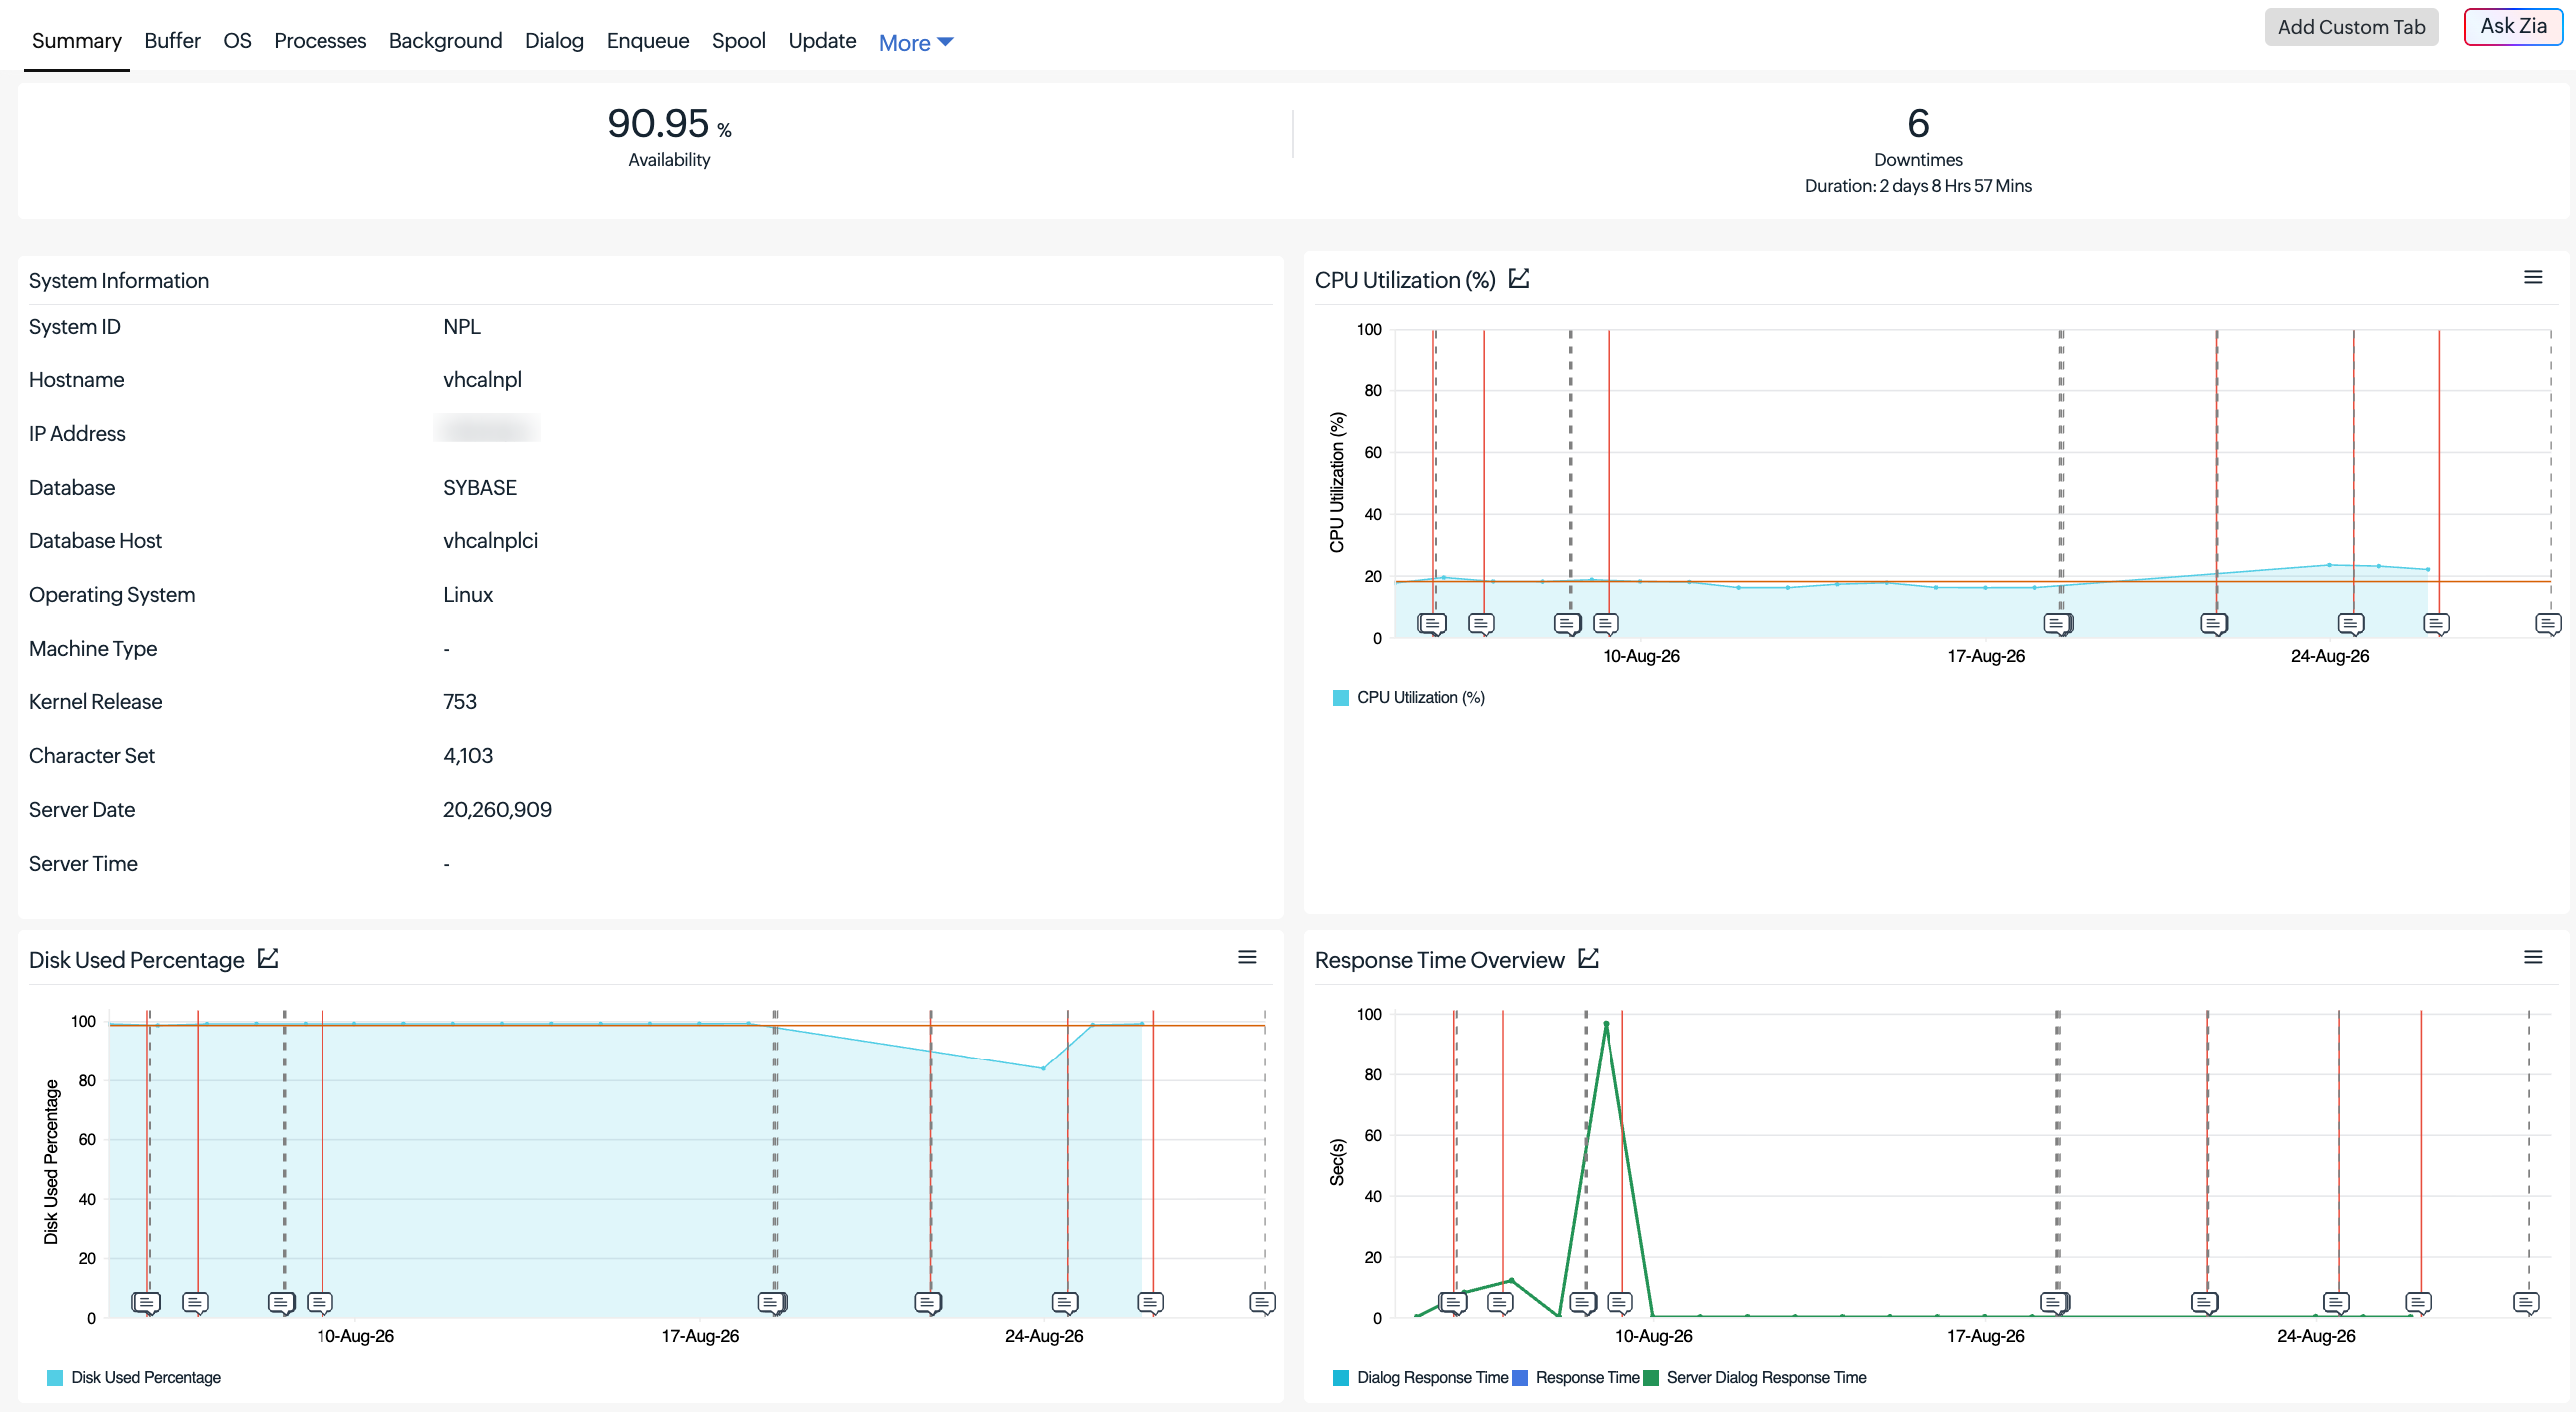
| Display name | Description |
|---|---|
| Database Host | Hostname of the database server backing the SAP system |
| Kernel Release | SAP kernel release/patch level running on the application server |
| Server Date | Current date reported by the SAP server |
| Character Set | Character set configured for the SAP system |
| Machine Type | Hardware/VM machine type of the server |
| Server Time | Current time reported by the SAP server |
| System ID | SAP System ID (SID) |
| Database | Database platform used by the SAP system |
| Hostname | Hostname of the monitored SAP application server |
| IP Address | IP address of the monitored SAP application server |
| OS Name | Operating system running on the SAP application server host |
| Alert Count | Number of active CCMS alerts raised on the SAP system at poll time |
| System Log Frequency | Frequency of entries written to the SAP system log |
| tRFC Count | Number of transactional RFC (tRFC) calls recorded |
OS / Host Resources
Read directly from the OS layer (via SAP's OS Collector) for the host running the SAP instance — independent of any specific work process type.
| Display name | Description |
|---|---|
| CPU Utilization | CPU utilization of the host running the SAP instance |
| Disk Used Percentage | Disk space utilization percentage on the host |
| Disk Free Space | Free disk space available on the host |
| Page In | Number of memory pages swapped in from disk |
| Page Out | Number of memory pages swapped out to disk |
Work Processes — Overview
| Display name | Description |
|---|---|
| Total Work Processes | Total number of configured work processes of all types |
| Long Running Dialog Work Processes | Number of dialog work processes running longer than the configured threshold |
| Dialog Work Processes Total | Total number of configured Dialog work processes |
| Dialog Work Processes Running | Number of Dialog work processes currently running |
| Dialog Work Processes Waiting | Number of Dialog work processes currently waiting |
| Dialog Work Processes Stopped | Number of Dialog work processes currently stopped |
| Background Work Processes Total | Total number of configured Background work processes |
| Background Work Processes Running | Number of Background work processes currently running |
| Background Work Processes Waiting | Number of Background work processes currently waiting |
| Background Work Processes Stopped | Number of Background work processes currently stopped |
| Enqueue Work Processes Total | Total number of configured Enqueue work processes |
| Enqueue Work Processes Running | Number of Enqueue work processes currently running |
| Enqueue Work Processes Waiting | Number of Enqueue work processes currently waiting |
| Enqueue Work Processes Stopped | Number of Enqueue work processes currently stopped |
| Spool Work Processes Total | Total number of configured Spool work processes |
| Spool Work Processes Running | Number of Spool work processes currently running |
| Spool Work Processes Waiting | Number of Spool work processes currently waiting |
| Spool Work Processes Stopped | Number of Spool work processes currently stopped |
| U1 Work Processes Total | Total number of configured Update (V1) work processes |
| U1 Work Processes Running | Number of Update (V1) work processes currently running |
| U1 Work Processes Waiting | Number of Update (V1) work processes currently waiting |
| U1 Work Processes Stopped | Number of Update (V1) work processes currently stopped |
| U2 Work Processes Total | Total number of configured Update2 (V2) work processes |
| U2 Work Processes Running | Number of Update2 (V2) work processes currently running |
| U2 Work Processes Waiting | Number of Update2 (V2) work processes currently waiting |
| U2 Work Processes Stopped | Number of Update2 (V2) work processes currently stopped |
Dialog Work Process metrics
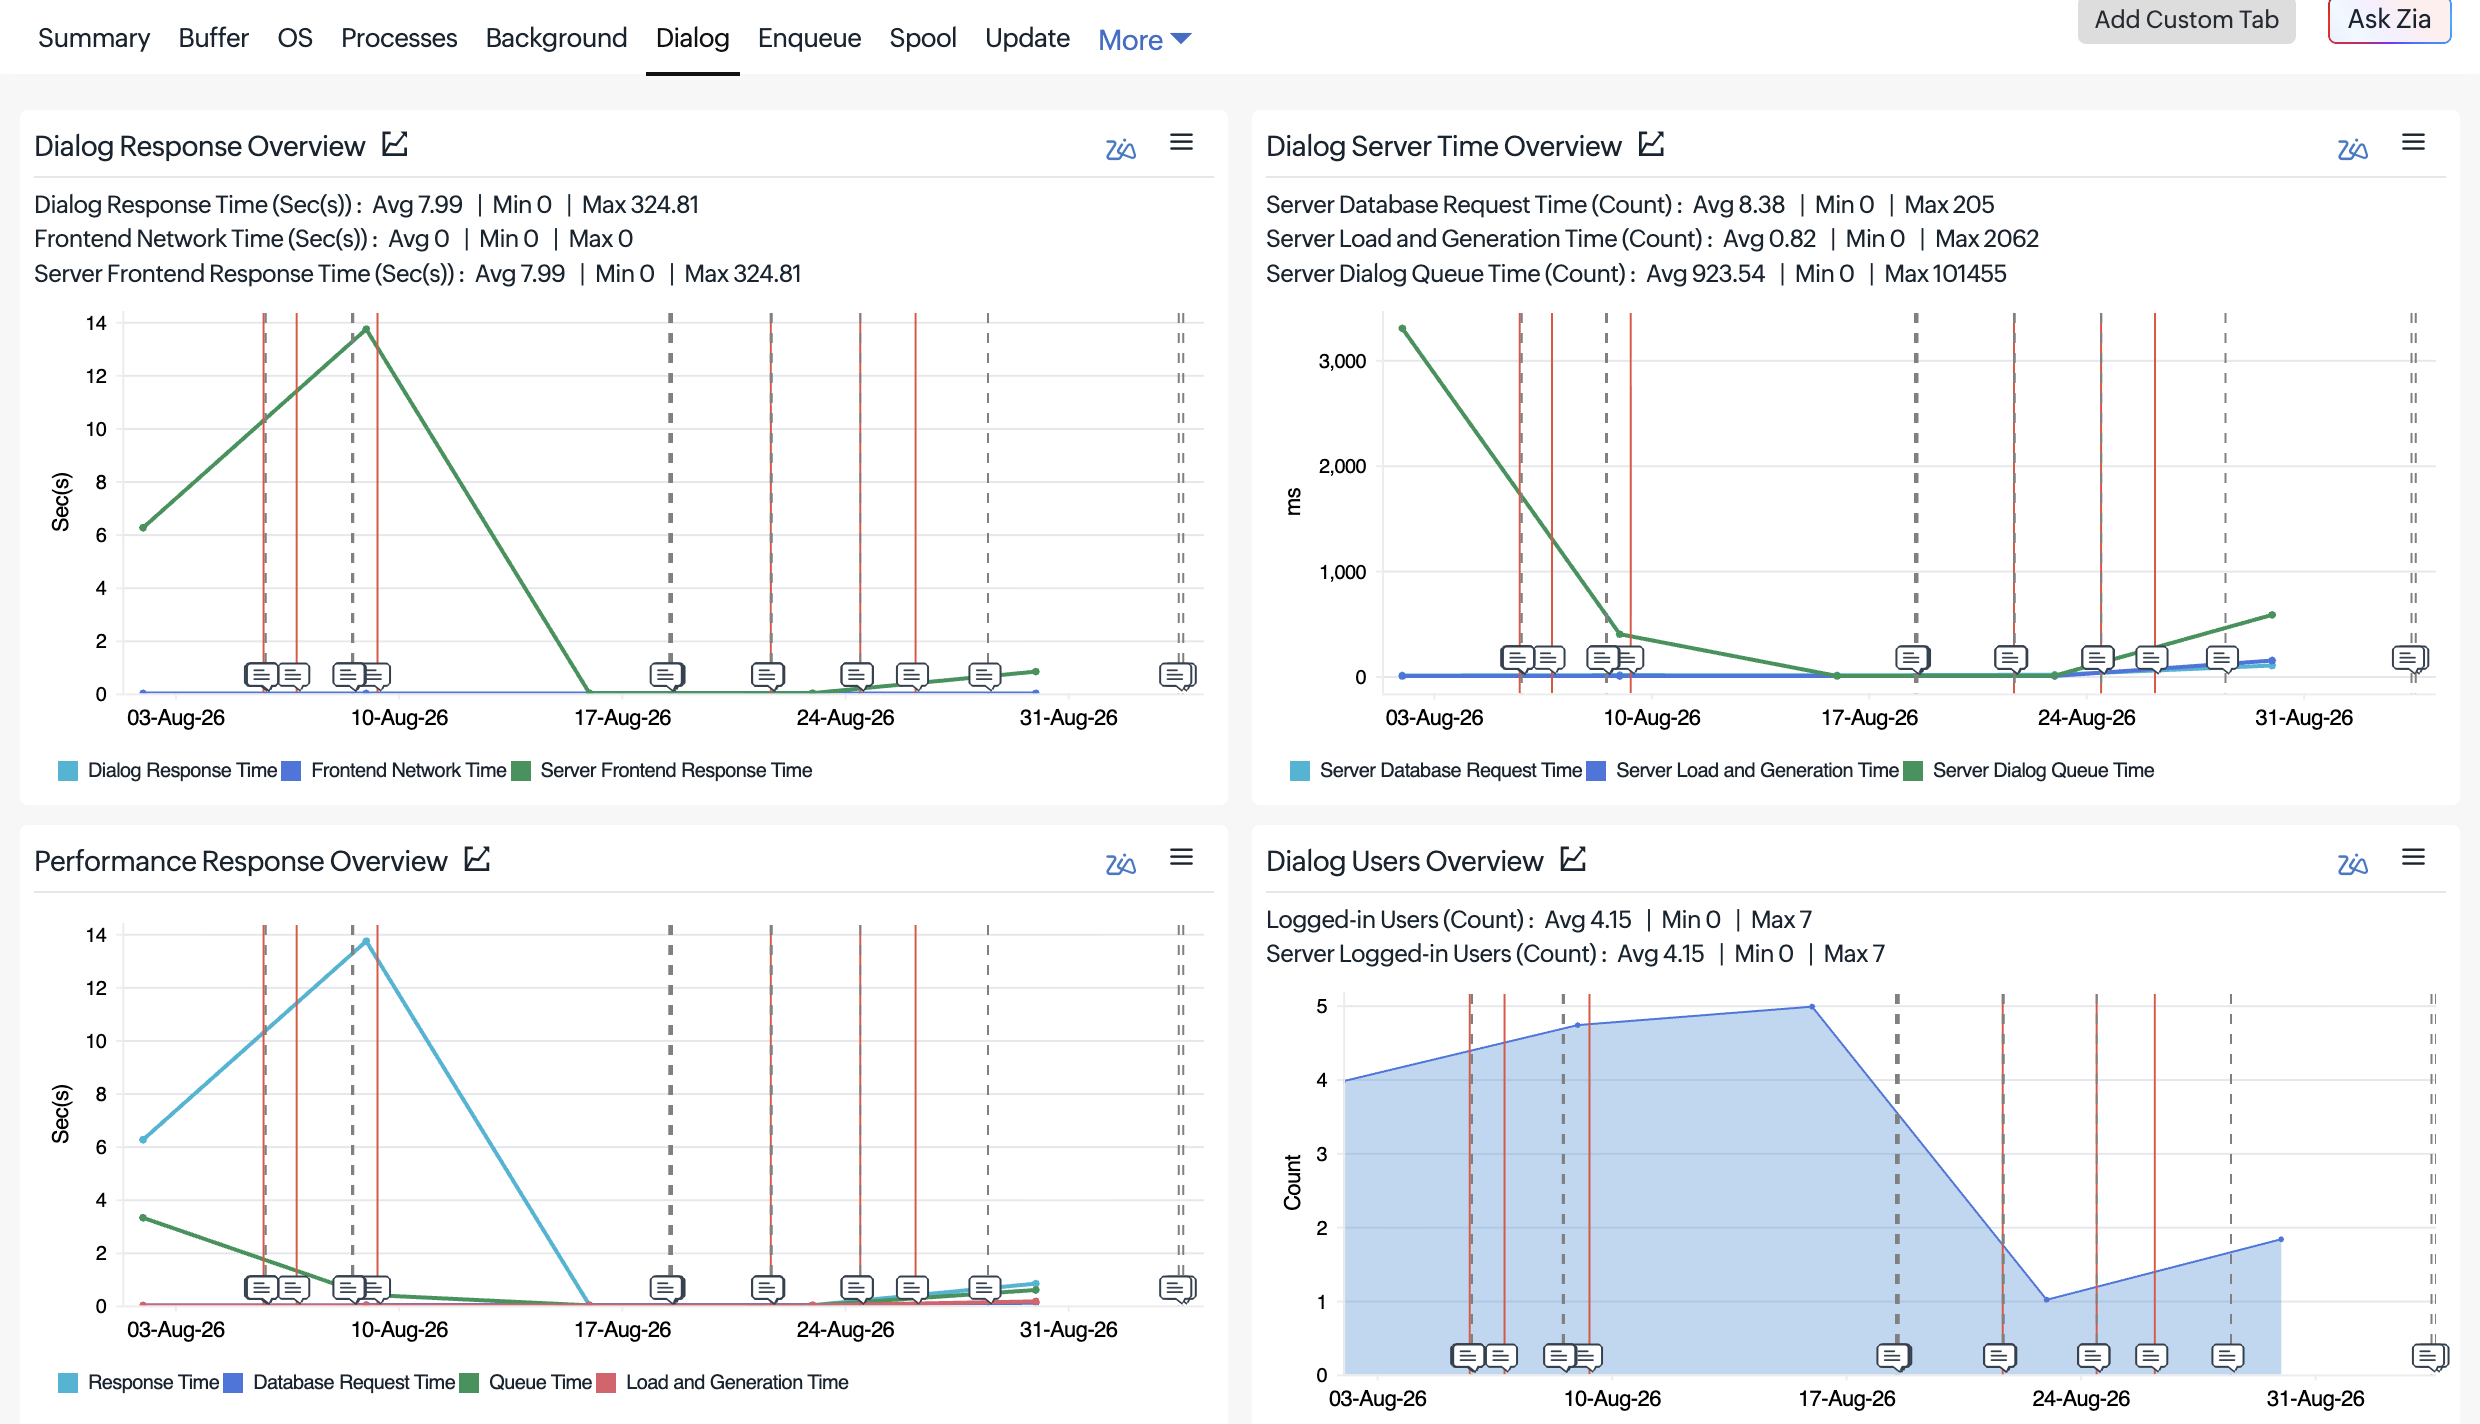
Collected specifically for the Dialog work process type, as experienced by end users running SAPGUI dialog steps on this application server instance.
| Display name | Description |
|---|---|
| Dialog Response Time | Average dialog response time as perceived by the application server |
| Logged-in Users | Number of users currently logged in via dialog |
| Frontend Network Time | Network time between the front end (SAPGUI) and the application server |
Server (Instance-Level) Dialog metrics
Same metric family as the Dialog Work Process metrics above, but aggregated at the application server (instance) level across *all* dialog work processes on that instance rather than a single dialog task. This is taken in addition to the per-task dialog figures so instance-wide dialog degradation can be spotted even when it isn't visible from any single session's view.
| Display name | Description |
|---|---|
| Server Dialog Response Time | Response time for dialog steps at the instance/server level |
| Server Database Request Time | Time spent on database requests during dialog processing |
| Server Dialog Queue Time | Time dialog requests spend waiting in the dispatcher queue |
| Server Load and Generation Time | Time spent generating/loading ABAP programs |
| Server Frontend Response Time | End-to-end response time including the front-end round trip |
| Server Logged-in Users | Number of users logged in at the server (instance) level |
Performance Monitor (ST03) metrics
These mirror SAP's built-in Workload Monitor (transaction ST03/ST03N) and are pulled via a separate RFC path from the OS-level and dialog-level metrics above. ST03 aggregates across *all* task types (dialog, background, update, spool, RFC, etc.) rather than just dialog or just the OS layer, so these act as a system-wide cross-check against the dialog-only and OS-only figures — and they match the numbers SAP Basis admins already know from ST03, which makes correlating with existing SAP-side troubleshooting practices easier.
| Display name | Description |
|---|---|
| CPU Utilization | CPU utilization as measured by the SAP performance monitor (ST03), across all task types |
| Page In | Paging-in activity as measured by the performance monitor, across all task types |
| Page Out | Paging-out activity as measured by the performance monitor, across all task types |
| Response Time | Overall average response time across all task types (not just dialog) |
| Database Request Time | Average database request time across all task types |
| Queue Time | Average time requests wait in the dispatcher queue, across all task types |
| Load and Generation Time | Average program load/generation time across all task types |
| Roll Time | Average roll-in/roll-out time (context switching) |
| Extended Memory Utilization | Extended memory currently in use |
| Heap Memory Utilization | Heap memory currently in use |
Background Processing
| Display name | Description |
|---|---|
| Background Job Count | Total number of background jobs currently scheduled/running |
| Background Work Processes | Number of active background work processes |
| Ended Background Work Processes | Number of background work processes that have ended |
| Background Work Process Errors | Count of errors encountered in background work processes |
| Background Work Process Error Frequency | Frequency of errors occurring in background work processes |
| Server Background Queue Length | Length of the background job queue specific to this server |
| Background Queue Length | Length of the background job queue across the entire system |
| Background Work Process Utilization | Overall utilization percentage of background work processes |
Buffers
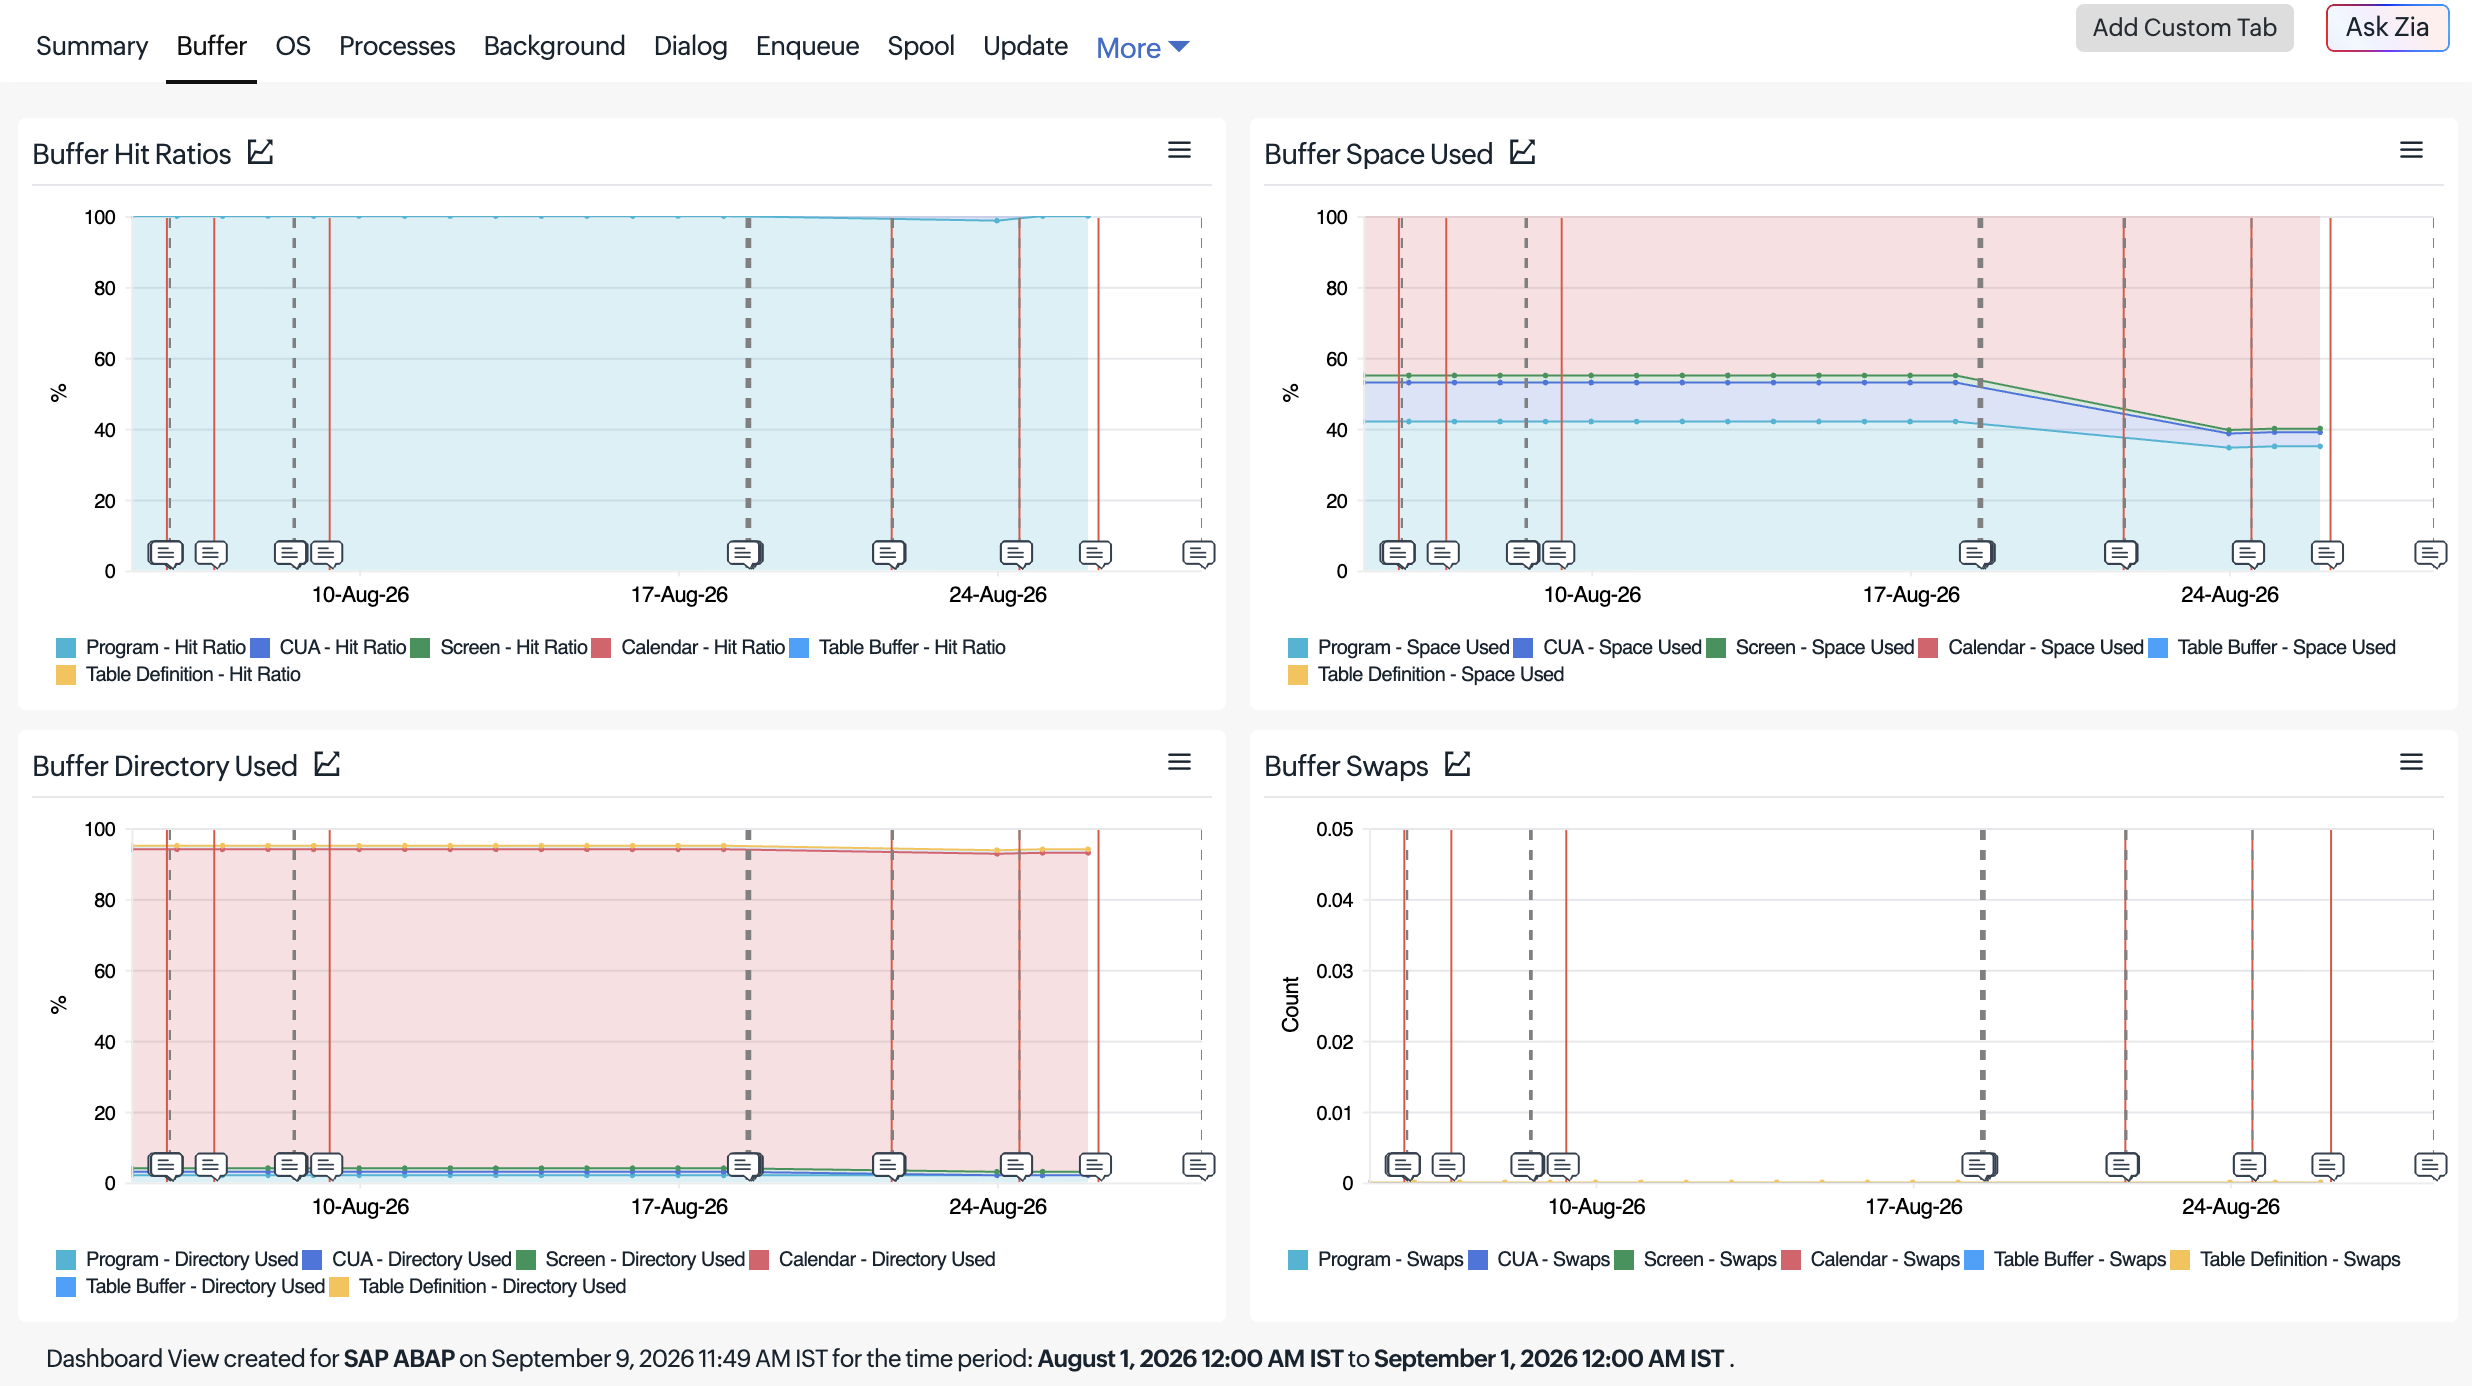
Each buffer type below reports the same 4 metrics: Hit Ratio, Space Used, Directory Used, Swaps.
| Display name | Description |
|---|---|
| Program - Hit Ratio | Percentage of Program buffer accesses satisfied from cache |
| Program - Space Used | Amount of Program buffer memory space currently used |
| Program - Directory Used | Number of directory entries used in the Program buffer's administration area |
| Program - Swaps | Number of Program buffer swap operations (objects displaced due to buffer pressure) |
| CUA - Hit Ratio | Percentage of CUA buffer accesses satisfied from cache |
| CUA - Space Used | Amount of CUA buffer memory space currently used |
| CUA - Directory Used | Number of directory entries used in the CUA buffer's administration area |
| CUA - Swaps | Number of CUA buffer swap operations |
| Screen - Hit Ratio | Percentage of Screen buffer accesses satisfied from cache |
| Screen - Space Used | Amount of Screen buffer memory space currently used |
| Screen - Directory Used | Number of directory entries used in the Screen buffer's administration area |
| Screen - Swaps | Number of Screen buffer swap operations |
| Calendar - Hit Ratio | Percentage of Calendar buffer accesses satisfied from cache |
| Calendar - Space Used | Amount of Calendar buffer memory space currently used |
| Calendar - Directory Used | Number of directory entries used in the Calendar buffer's administration area |
| Calendar - Swaps | Number of Calendar buffer swap operations |
| Table Buffer - Hit Ratio | Percentage of Table Buffer accesses satisfied from cache |
| Table Buffer - Space Used | Amount of Table Buffer memory space currently used |
| Table Buffer - Directory Used | Number of directory entries used in the Table Buffer's administration area |
| Table Buffer - Swaps | Number of Table Buffer swap operations |
| Table Definition - Hit Ratio | Percentage of Table Definition buffer accesses satisfied from cache |
| Table Definition - Space Used | Amount of Table Definition buffer memory space currently used |
| Table Definition - Directory Used | Number of directory entries used in the Table Definition buffer's administration area |
| Table Definition - Swaps | Number of Table Definition buffer swap operations |
Enqueue
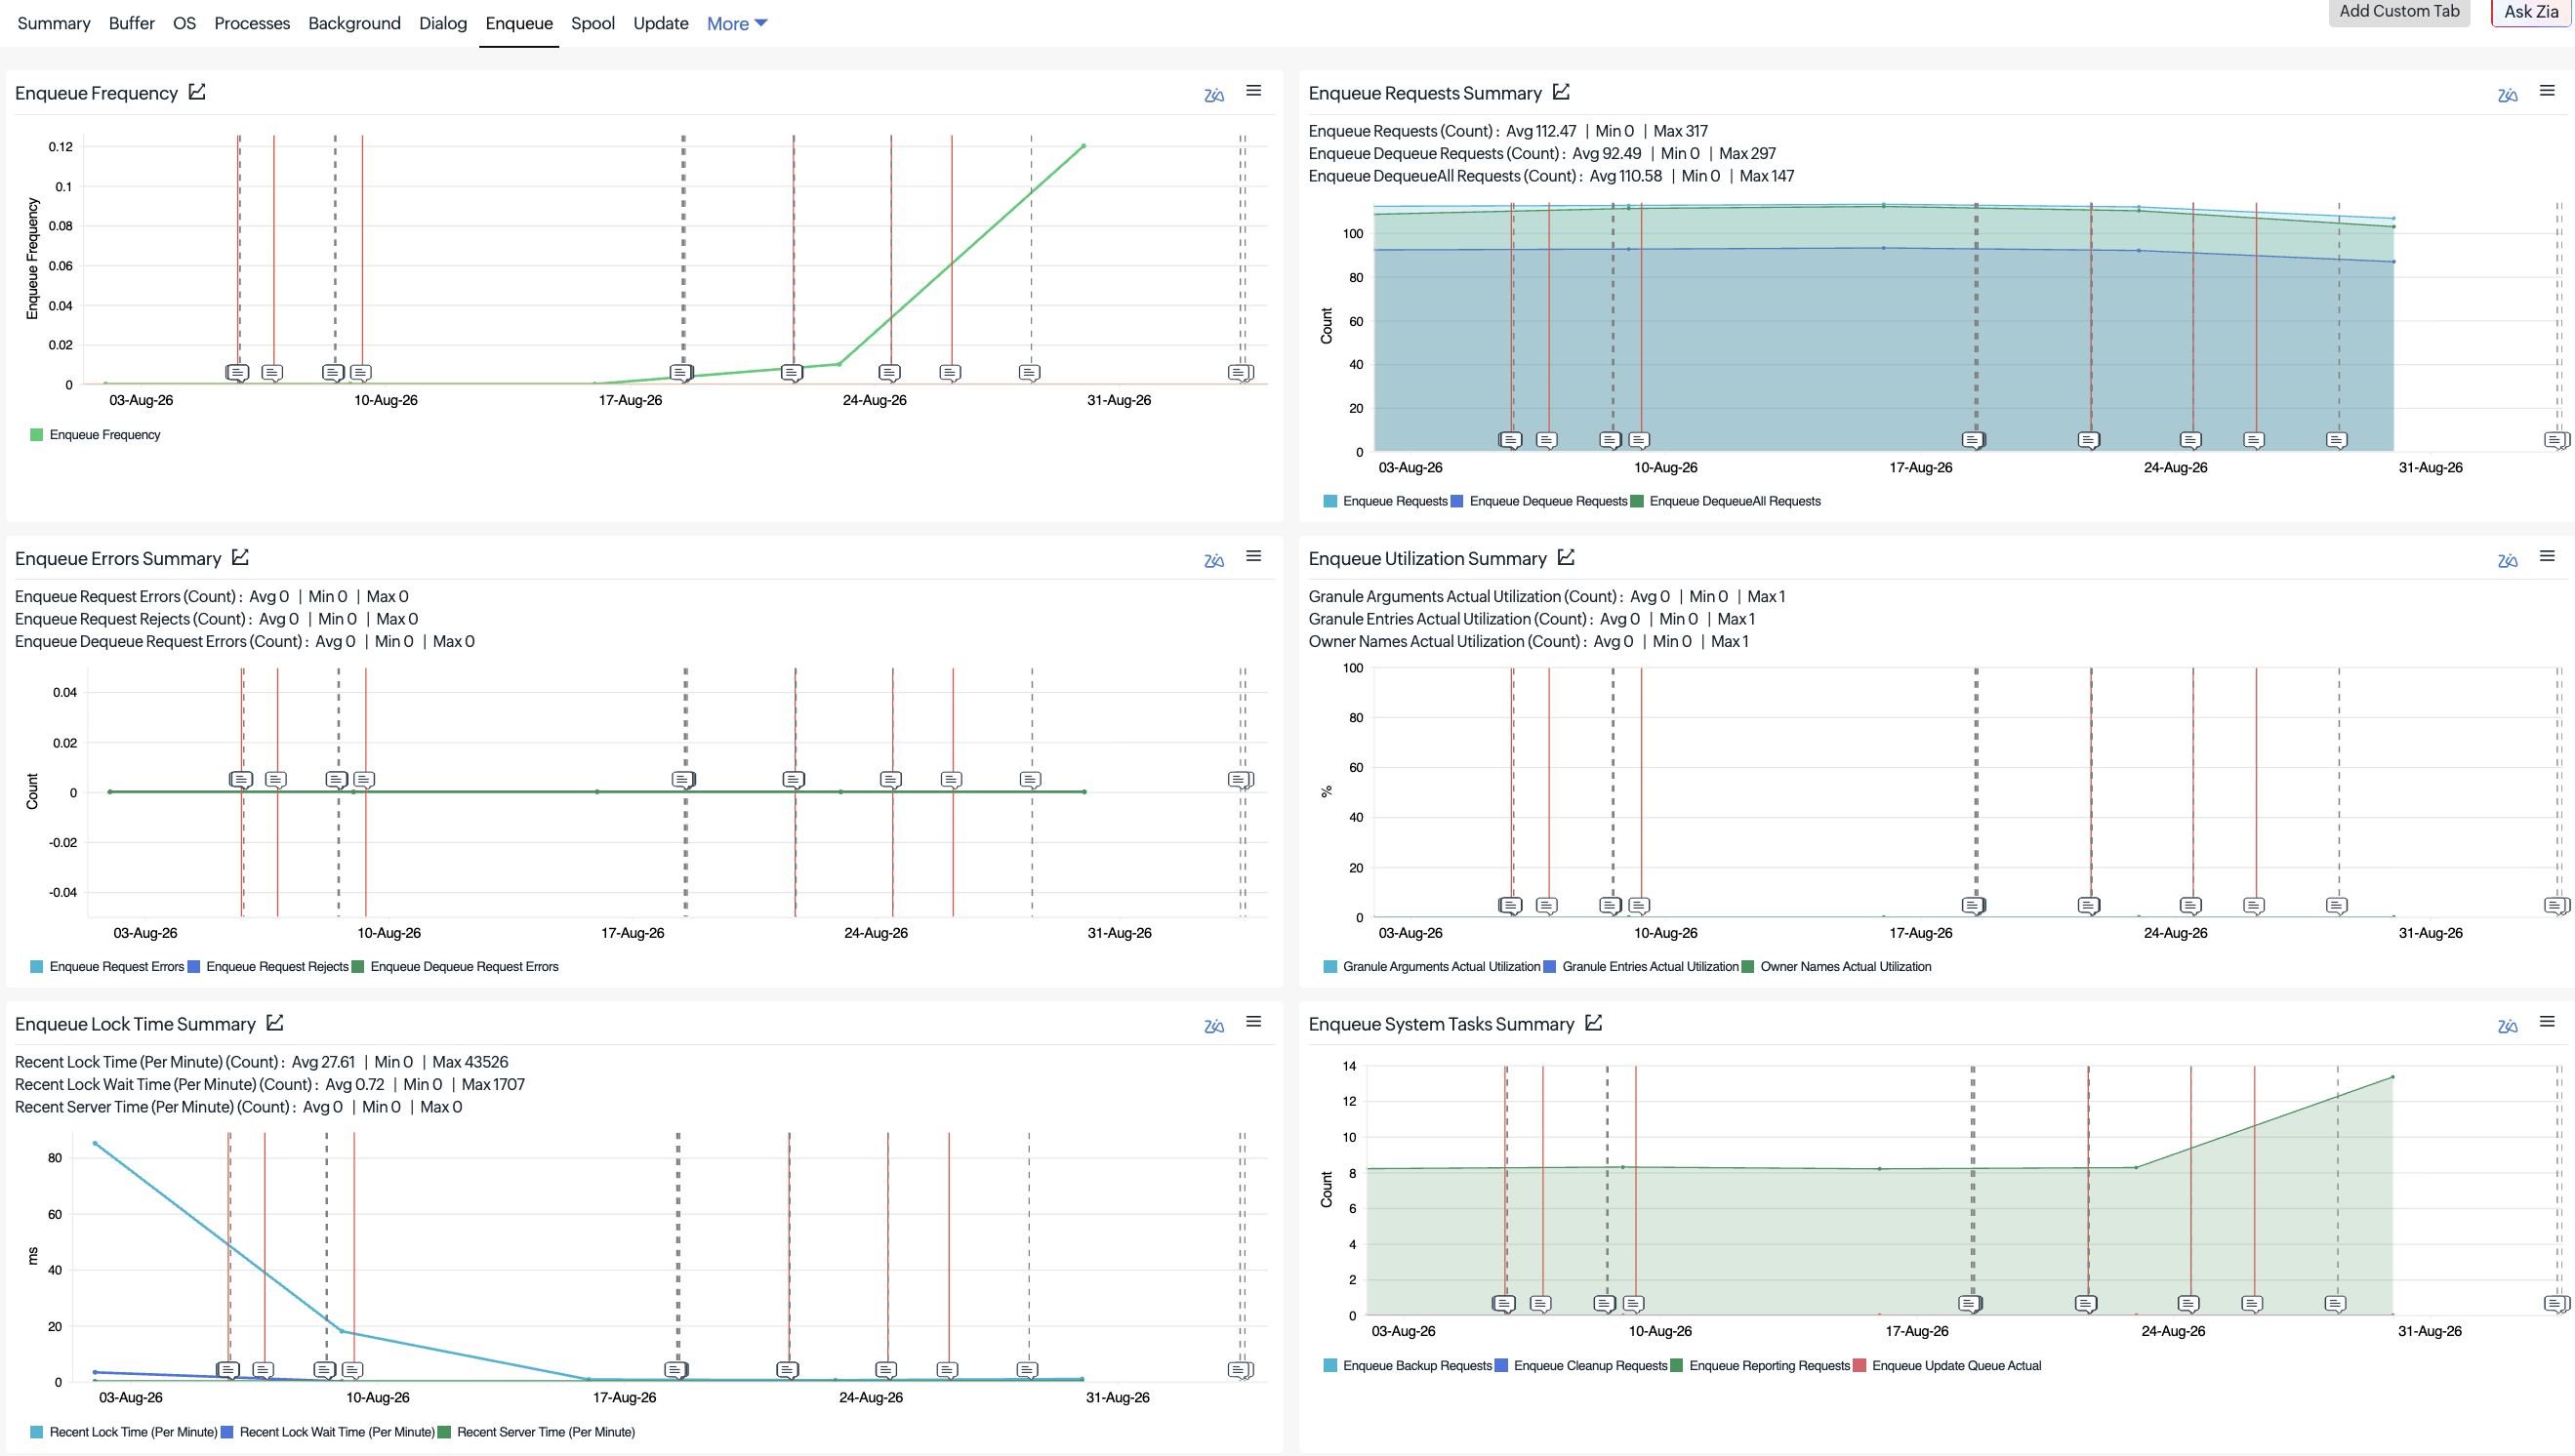
| Display name | Description |
|---|---|
| Enqueue Frequency | Frequency of enqueue (lock) requests |
| Enqueue Requests | Total number of lock (enqueue) requests |
| Enqueue Dequeue Requests | Total number of unlock (dequeue) requests |
| Enqueue DequeueAll Requests | Number of "dequeue all" requests (releasing all locks for a user/session) |
| Enqueue Request Errors | Number of failed enqueue requests |
| Enqueue Request Rejects | Number of enqueue requests rejected (e.g., due to lock conflicts) |
| Enqueue Dequeue Request Errors | Number of failed dequeue requests |
| Enqueue Backup Requests | Number of lock table backup requests |
| Enqueue Cleanup Requests | Number of lock table cleanup requests |
| Enqueue Reporting Requests | Number of lock reporting requests |
| Enqueue Update Queue Actual | Current size of the update queue tied to the enqueue server |
| Granule Arguments Actual Utilization | Current utilization of lock argument granules |
| Granule Entries Actual Utilization | Current utilization of lock entry granules |
| Owner Names Actual Utilization | Current utilization of the lock owner name table |
| Qout Scheduler Name | Name/identifier of the outbound queue scheduler entry |
| Client | SAP client associated with the scheduler entry |
| Group Info | Server group information for the scheduler entry |
| Date | Date the scheduler entry was recorded |
| Host | Host running the outbound queue scheduler |
| State | Current state of the scheduler entry |
| Time | Time the scheduler entry was recorded |
Qin Scheduler
| Display name | Description |
|---|---|
| Qin scheduler | Name/identifier of the inbound queue scheduler entry |
| Client | SAP client associated with the scheduler entry |
| Group Info | Server group information for the scheduler entry |
| Date | Date the scheduler entry was recorded |
| Host | Host running the inbound queue scheduler |
| State | Current state of the scheduler entry |
| Time | Time the scheduler entry was recorded |
Background Job
| Display name | Description |
|---|---|
| Background Job | Name of the discovered background job |
| Background Job Name | Name/identifier of the background job row |
| Delay Sec | Delay (in seconds) between the scheduled start and actual start of the job |
| Job Count | Number of job runs counted for this background job definition |
| Runtime Sec | Runtime of the background job, in seconds |
| Current Status | Current status code of the background job |
| Last Run Date | Date the background job last ran |
| Last Run Status | Last-run status code of the background job |
| User | User that scheduled/owns the background job |
Process Chain
| Display name | Description |
|---|---|
| Process Chain Name | Name/identifier of the process chain row |
| Log ID | Log ID of the latest process chain run |
| Datum | Date the process chain log entry corresponds to |
| Chain ID | Identifier of the process chain |
| Type | Type of the process chain |
| Variant | Variant used for the process chain run |
| Analyzed Status | Analyzed status code of the process chain run |
| Analyzed | Whether the process chain run has been analyzed |
| Reported Status | Status reported for the process chain run |
| Synchronous | Whether the process chain run was executed synchronously |
| Manual Abort | Whether the process chain run was manually aborted |
Qout Queue
| Display name | Description |
|---|---|
| Qout Queue Name | Name/identifier of the outbound queue entry |
| Qdestrfc | RFC destination associated with the outbound queue entry |
| Qstate | Current state of the outbound queue entry |
| Error Message | Error message recorded for the outbound queue entry |
Qin Queue
| Display name | Description |
|---|---|
| Qin Queue Name | Name/identifier of the inbound queue entry |
| Queue Count | Number of entries in the inbound (qRFC) queue |
| Qname | Name of the inbound queue |
| Qstate | Current state of the inbound queue entry |
| Error Message | Error message recorded for the inbound queue entry |
tRFC
Columns marked *(hidden)* are not shown by default but are present in the data / expandable row detail.
| Display name | Description |
|---|---|
| aRFC Destination | RFC destination the call was routed to |
| Function ID | Name of the ABAP function module invoked by the RFC call |
| State | Current state of the tRFC call (e.g., pending, executed, error) |
| User | SAP user that initiated the tRFC call |
| Transaction Code | Transaction code associated with the RFC call |
| Date | Date the RFC call was recorded (rendered with the generic "Date" label, not the "aRFC Datum" property key) |
| Time | Time the RFC call was recorded |
| TID Count | Number of transaction IDs (TIDs) associated with the call |
| Inbound Process ID *(hidden)* | Process ID handling the inbound side of the call |
| Process ID *(hidden)* | Process ID handling the RFC call |
| Error Message *(hidden, expandable)* | Error message shown when expanding the row |
Job Error Log
| Display name | Description |
|---|---|
| Job Name | Name of the background job associated with the error log entry |
| Job Count | Number of job runs counted for this background job definition |
| User | User that owns/scheduled the background job |
| Start Date | Date the job run started |
| Start Time | Time the job run started |
| Log Lines *(expandable)* | Log entries for the failed run, each rendered as "{date} {time} - {text}" |
Alerts
| Display name | Description |
|---|---|
| Segment | CCMS monitoring segment the alert belongs to |
| Object | Monitored object the alert was raised on |
| Short Name | Short name of the alert |
| Message | Alert message text |
| Severity | Severity level of the alert |
| Status | Current status of the alert |
| Value | Value associated with the alert (e.g., the metric reading that triggered it) |
| Date | Date the alert was recorded |
| System ID | SAP System ID (SID) the alert originated from |
| Index | Index of the alert entry |
Other common tabs
- Outages tab: View the monitor’s Down, Trouble, and Critical history, including the outage period, duration, reason, and latest comment. You can also add an outage.
- Notes tab: Add and view notes for the monitor. This tab also displays key inventory and configuration details.
- Log Report tab: View data collection records for the selected period, including the collection time, polling location, monitor status, and captured SAP ABAP metrics.
- Alert Logs tab: View and search alert logs associated with the SAP ABAP monitor for the selected time range.
- Audit Logs tab: View and search audit activities associated with the monitor, with an option to include related audit activities.
Other enterprise application servers
Explore monitoring support for other enterprise application servers available in Site24x7:
IBM WebSphere | JBoss | GlassFish | IBM i