MongoDB Atlas monitoring
Monitor your MongoDB Atlas projects, clusters, and nodes from a single console with Site24x7. Track connections, operations, replication lag, cache, CPU, memory, and disk metrics, so you can detect and resolve database issues before they affect your applications.
Use cases
Site24x7 MongoDB Atlas monitoring helps you identify and troubleshoot database performance issues through the following use cases:
- Track cluster state, availability, and node health across all your Atlas projects, and get alerted when a node is down or in a critical state.
- Identify slow queries and inefficient query patterns by using slow query logs, suggested indexes, and query targeting ratios.
- Detect replication lag and oplog growth early to prevent data inconsistency between replica set members.
- Plan capacity by monitoring storage, disk usage, cache fill ratio, and memory trends.
- Audit your Atlas environment by reviewing API keys, roles, backup status, encryption at rest, and termination protection of each cluster.
Benefits
Monitoring MongoDB Atlas with Site24x7 provides the following benefits:
- Monitor projects, clusters, and nodes without installing an agent.
- Discover clusters automatically, or add them manually.
- View database-, operation-, and host-level metrics for every node in one place.
- Reduce mean time to resolution (MTTR) with threshold-based alerts on key database metrics.
Supported components
Site24x7 creates the following monitors for MongoDB Atlas.
| Monitor | Description |
|---|---|
| MongoDB Atlas | Monitors your Atlas organization, including its projects, API keys, and clusters. |
| MongoDB Atlas Cluster | Monitors the health, throughput, and storage of a cluster. |
| MongoDB Atlas Node | Monitors the performance of each node in a cluster. |
Prerequisites
Create a service account in MongoDB Atlas with the Organization Read Only permission:
- In MongoDB Atlas, navigate to Identity & Access > Applications > Service Accounts.
- Click Add new > Service Account.
- On the Create Service Account page, provide the following details:
- Name: Enter a name for the service account.
- Description: Enter a description for the service account.
- Client Secret Expiration: Select the expiration period for the client secret.
- Organization Permissions: Select Organization Read Only.
- Click Create.
- Copy the generated Client ID and Client Secret for configuring MongoDB Atlas monitoring in Site24x7.
If the Require IP Access List for the Atlas Administration API setting is enabled under Organization Settings in MongoDB Atlas, you must allow-list the IP addresses of your Site24x7 monitoring location before using the service account. Otherwise, MongoDB Atlas will reject API requests from Site24x7. Refer to the IP addresses for your data center and monitoring location.
Additional prerequisites for slow queries
To view data in the Slow Queries tab of the MongoDB Atlas Node monitor, the service account must have the Project Data Access Read Only role for each project you want to monitor.
The Organization Read Only permission alone does not provide access to Atlas Performance Advisor data.
To assign the required project-level permission:
- Log in to MongoDB Atlas and open the project you want to monitor.
- Navigate to Security > Project Identity & Access > Users.
- Click Invite to Project.
- In the search box, enter the Client ID of the service account created for Site24x7 monitoring.
- Select the service account from the search results.
- Under Give your members access permissions below, click Select Roles.
- Select Project Data Access Read Only (this means the user can access a cluster’s data and indexes).
- Click Invite to Project to assign the permission.
- To verify the permission, navigate to Project Identity & Access > Applications > Service Accounts. The Project Permissions column for the service account should display Project Data Access Read Only.
- Repeat these steps for every MongoDB Atlas project whose clusters you want to monitor.
- Inviting an existing service account to a project does not invalidate its credentials. The credentials remain active until they expire or are manually revoked.
Adding your MongoDB Atlas organization as a monitor in Site24x7
- Log in to Site24x7.
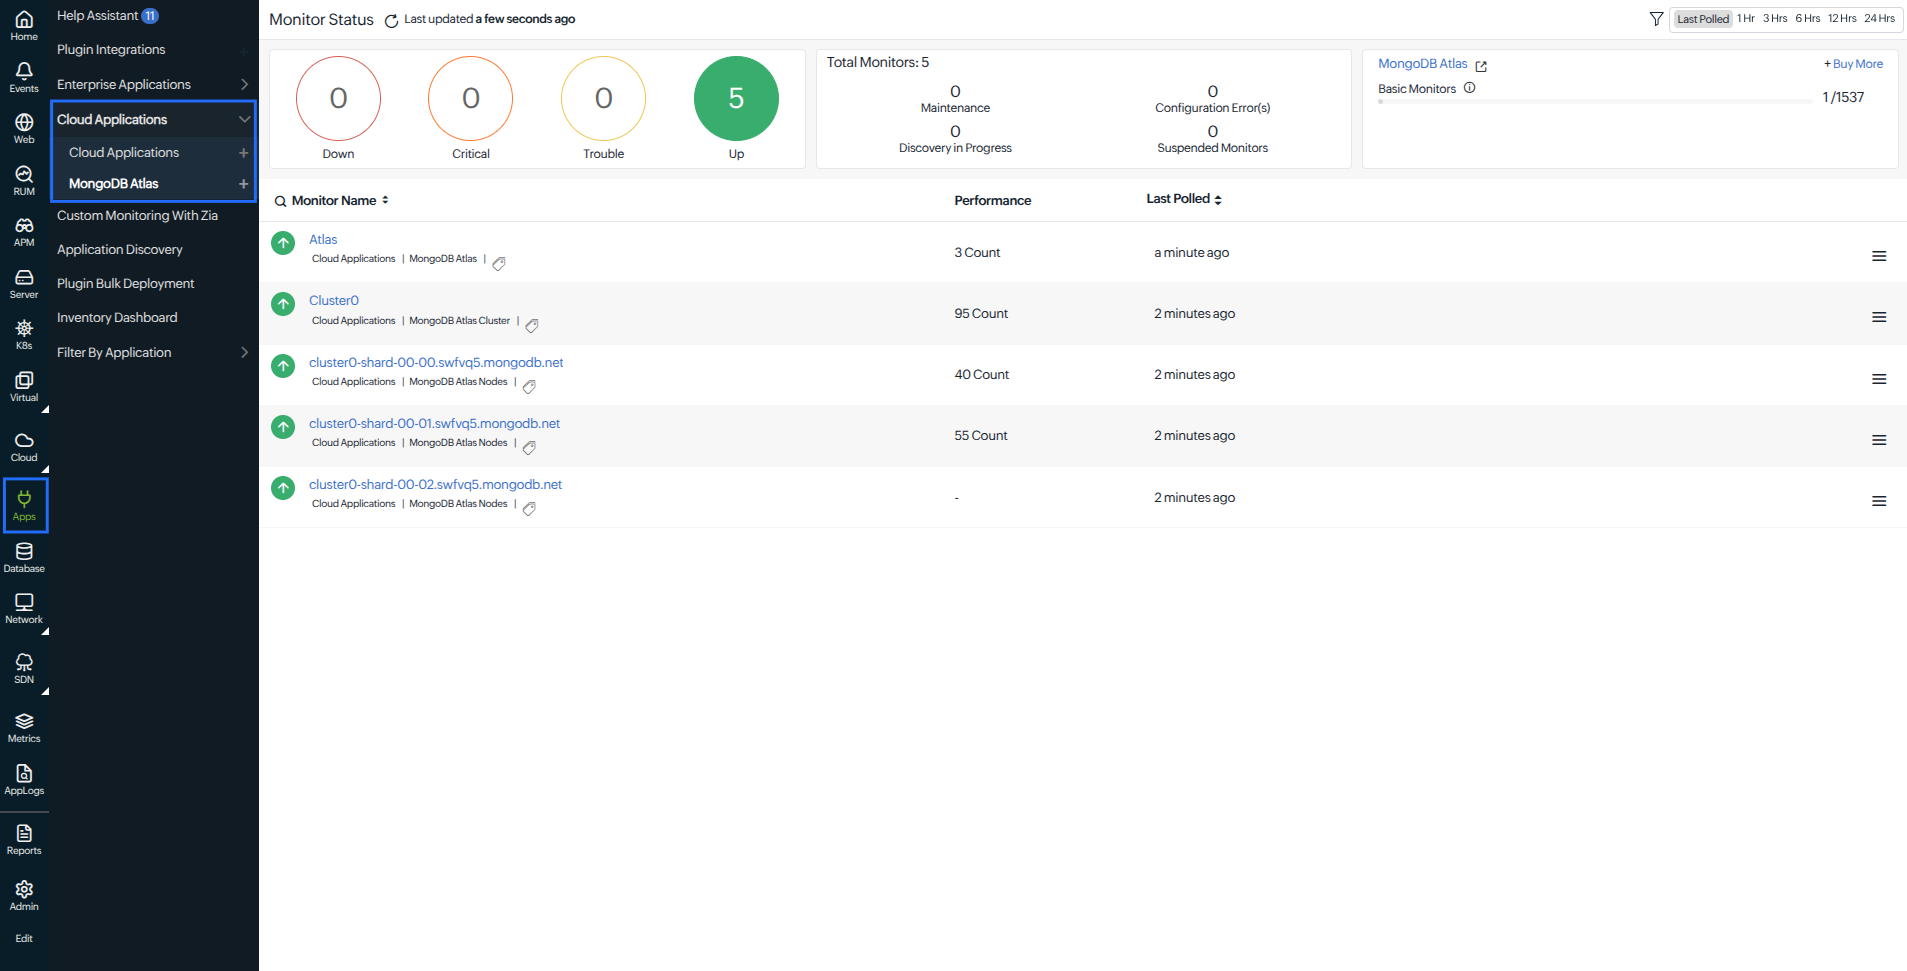
- Go to Apps > Cloud Application > MongoDB Atlas.
- Click the MongoDB Atlas icon. The Add MongoDB Atlas Monitor form opens.
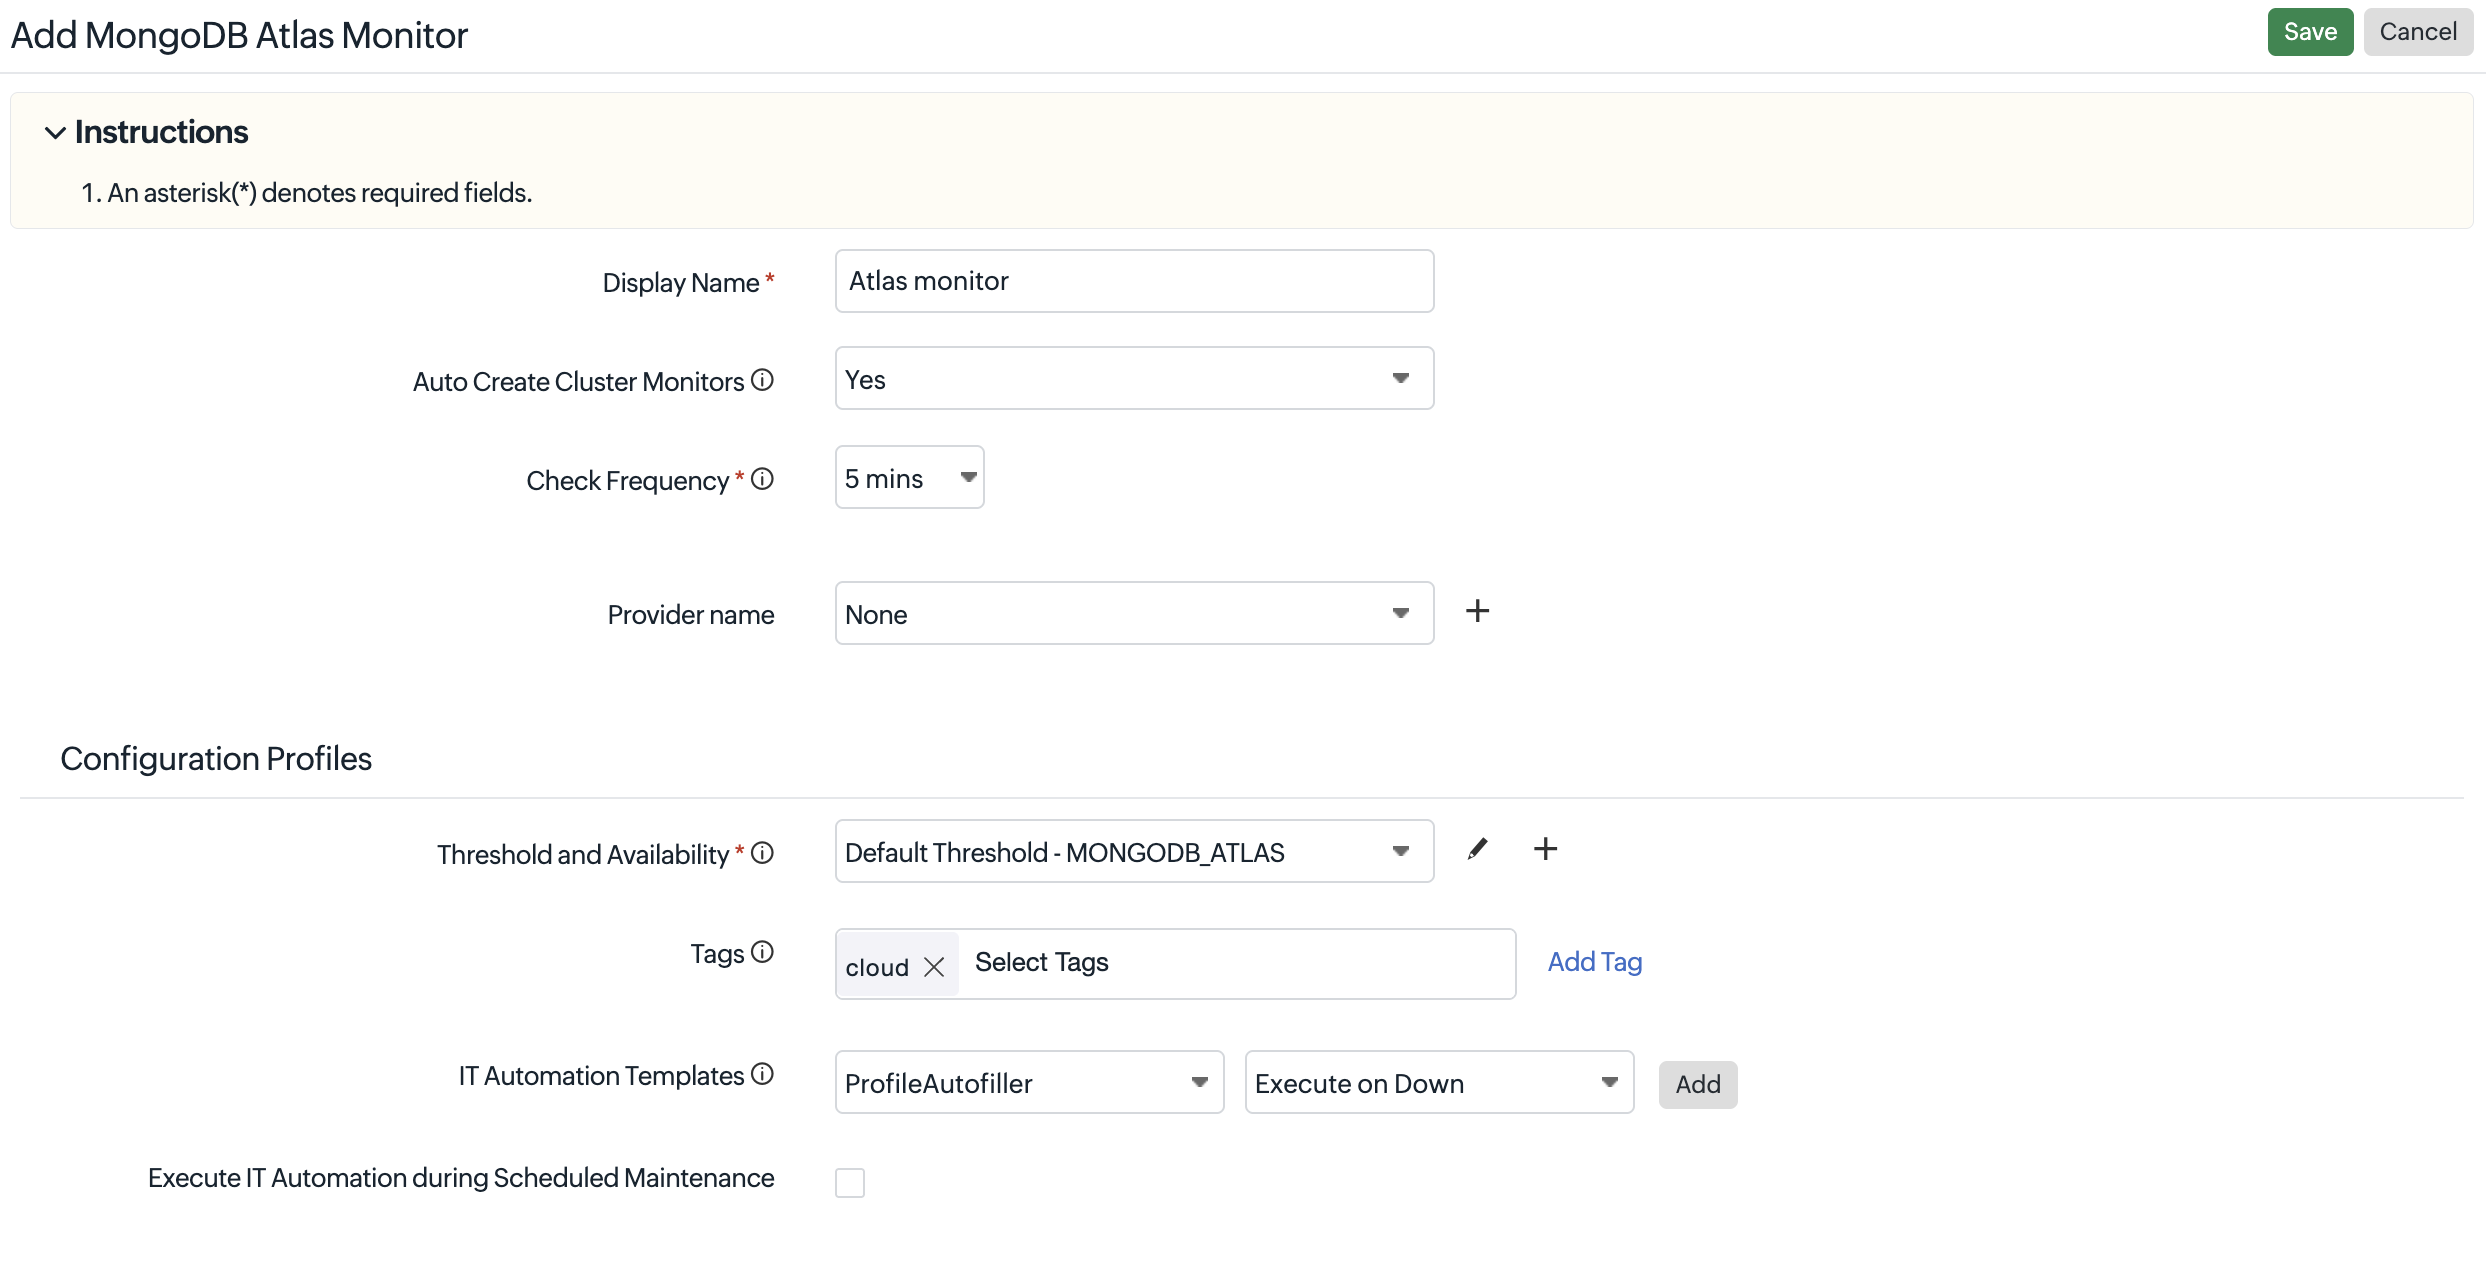
- Configure the fields in the Monitor details, Configuration Profiles, and Alert Settings sections below.
- Click Save. A Successfully Added message appears and the monitor shows up in the monitor list.
Monitor details
| Field | Description |
|---|---|
| Display Name | Name for the monitor. |
| Auto Create Cluster Monitor |
|
| Check Frequency | How often Site24x7 polls MongoDB Atlas.
Note: The default is five minutes. |
| Provider Name | Select an existing OAuth provider from the drop-down menu, or click the + icon to add a new OAuth provider. |
Configuration Profiles
| Field | Description |
|---|---|
| Threshold and Availability |
|
| Tags | Associate your monitor with predefined tags. Learn how to add tags. |
| IT Automation Templates | Select an automation to be executed when the MongoDB Atlas monitor’s status changes to Down, Trouble, or Up, or when there is any status or attribute change. The configured action is executed when the specified condition is met.
Note: To automate corrective actions, refer to the IT Automation help document. |
| Execute IT Automation during Scheduled Maintenance | Select the check box to run the automation even when the monitor is under scheduled maintenance. |
Alert Settings
| Field | Description |
|---|---|
| User Alert Group | Select one or more user alert groups to notify. Hover over a group to see its contacts and their alert modes, such as email or voice call. Click Add User Alert Group to create a new group. |
Add an OAuth provider
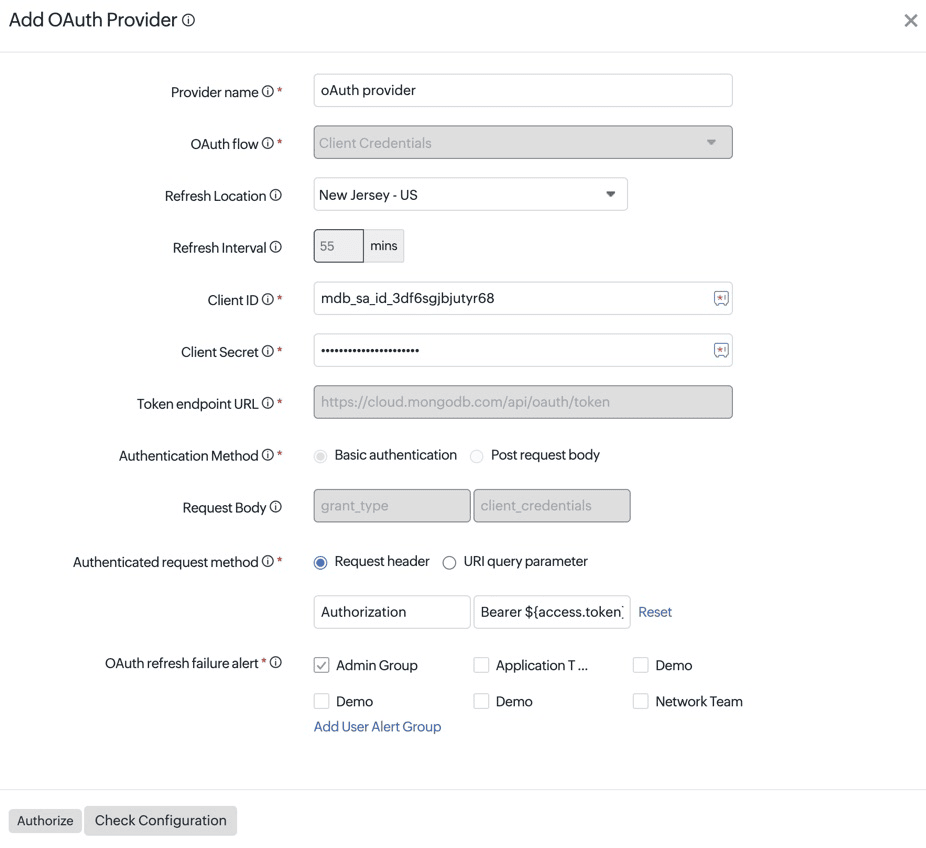
Click the + icon next to Provider Name. The Add OAuth Provider dialog opens.
| Field | Description |
|---|---|
| Provider name | Name for the OAuth configuration. |
| OAuth flow | Client credentials. Pre-selected and not editable. |
| Refresh Location | Monitoring location that requests the access token. Select the location you allow-listed in MongoDB Atlas. |
| Refresh Interval | How often the access token is refreshed. Pre-filled as 55 mins and not editable. |
| Client ID | Client ID of the Atlas service account. |
| Client Secret | Client Secret of the Atlas service account. |
| Token endpoint URL | Pre-filled as https://cloud.mongodb.com/api/oauth/token. |
| Authentication Method | Basic authentication or Post request body. Pre-filled. |
| Request Body | Pre-filled with grant_type = client_credentials. |
| Authenticated request method | Request header (default) or URI query parameter. By default, the token is sent as Authorization: Bearer ${access.token}. Click Reset to restore the default. |
| OAuth refresh failure alert | Select the user alert groups to notify when the token refresh fails. |
Click Check Configuration to test the connection. A successful check returns the HTTP response headers and the response body, which contains the access token. Then click Authorize to complete the setup. Select the new provider in the Provider Name list and click Save.
The response headers from Atlas include rate limit details (ratelimit-limit, ratelimit-remaining, ratelimit-reset). The MongoDB Atlas Admin API enforces a request rate limit, which constrains how often Site24x7 can collect data. To poll more frequently across many clusters or nodes, request a higher API rate limit from MongoDB support.
Discover and add clusters manually
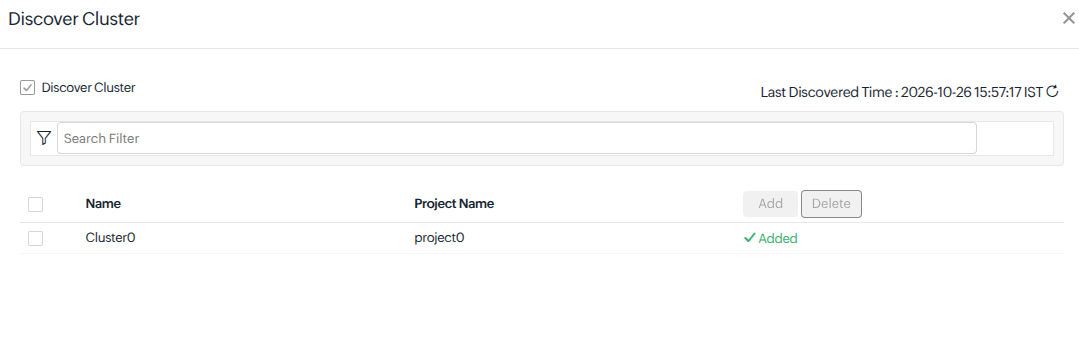
If you set Auto Create Cluster Monitor to No, add clusters yourself:
- Open the MongoDB Atlas monitor and go to the Clusters tab.
- Click Discover Cluster. Site24x7 discovers the clusters in your organization. This may take a few moments.
- In the Discover Cluster dialog, select the clusters to monitor. Each row shows the cluster Name and its Project Name. The dialog also shows the Last Discovered Time and a Search Filter.
- Click Add. To remove a cluster from monitoring, select it and click Delete.
Monitors created in Site24x7
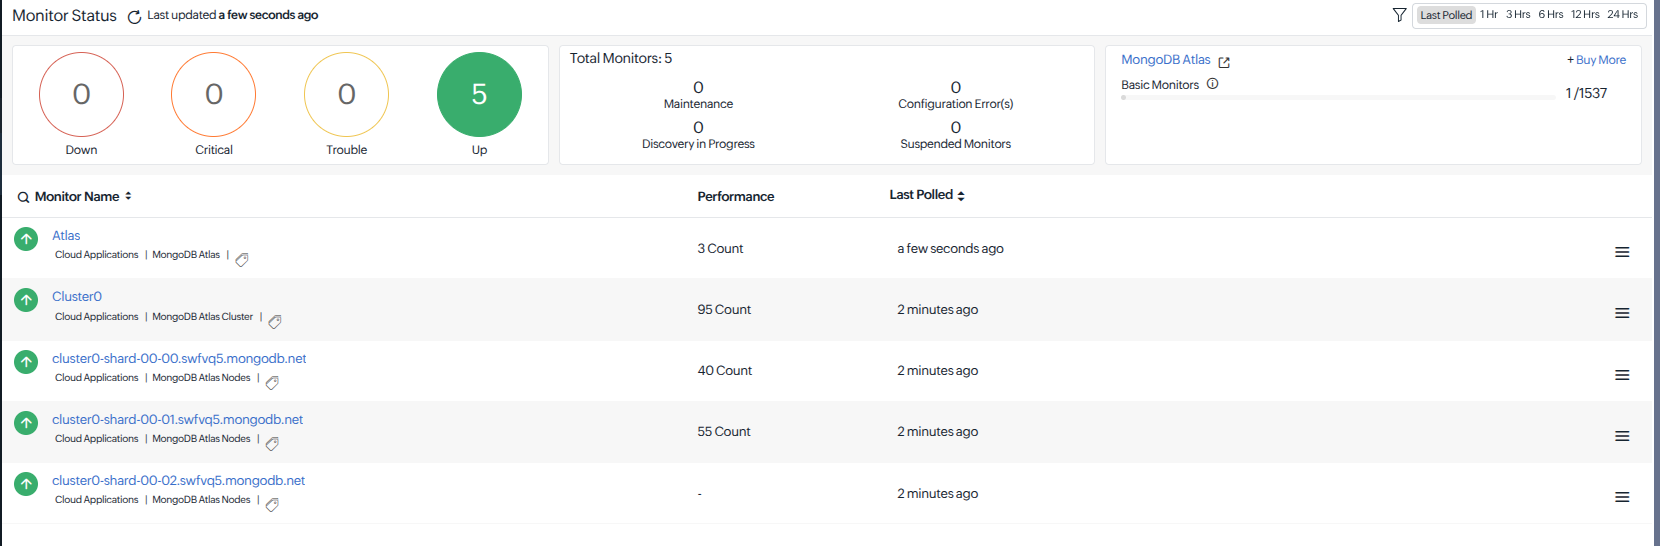
After you add the organization, Site24x7 lists the following under Apps > Cloud Application > MongoDB Atlas. The status circles (Down, Critical, Trouble, Up) summarize them.
- The organization monitor (type MongoDB Atlas), for example, Atlas.
- One cluster monitor per cluster (type MongoDB Atlas Cluster), for example, Cluster0.
- One node monitor per node (type MongoDB Atlas Node), named after the node hostname, for example, cluster0-shard-00-00.xxxx.mongodb.net.
The list shows each monitor's performance count and when it was last polled. Click a monitor name to open it.
View your MongoDB Atlas monitor
- Go to Apps > Cloud Application > MongoDB Atlas.
- Click the monitor name to open it.
The monitor has the following tabs:
Summary
The Summary tab provides an overview of the MongoDB Atlas organization’s availability, downtime, and projects.
| Field | Description |
|---|---|
| Availability | Percentage of time the MongoDB Atlas monitor was available during the selected period. |
| Downtimes | Number of downtime occurrences during the selected period. |
| Events Timeline | Displays monitor status changes, including Down, Critical, Trouble, Maintenance, and Suspended, during the selected period. |
| Total Projects | Displays a graph showing the total number of MongoDB Atlas projects in the organization over time. |
| Projects | Displays a list of MongoDB Atlas projects with their Project ID, Total Clusters, Project Name, and Action. |
- Click the pencil icon under the Action column to configure thresholds for an individual project.
- To configure thresholds for multiple projects simultaneously, click Threshold Configuration.
API Keys
The API Keys tab provides details about the API keys configured in the MongoDB Atlas organization.
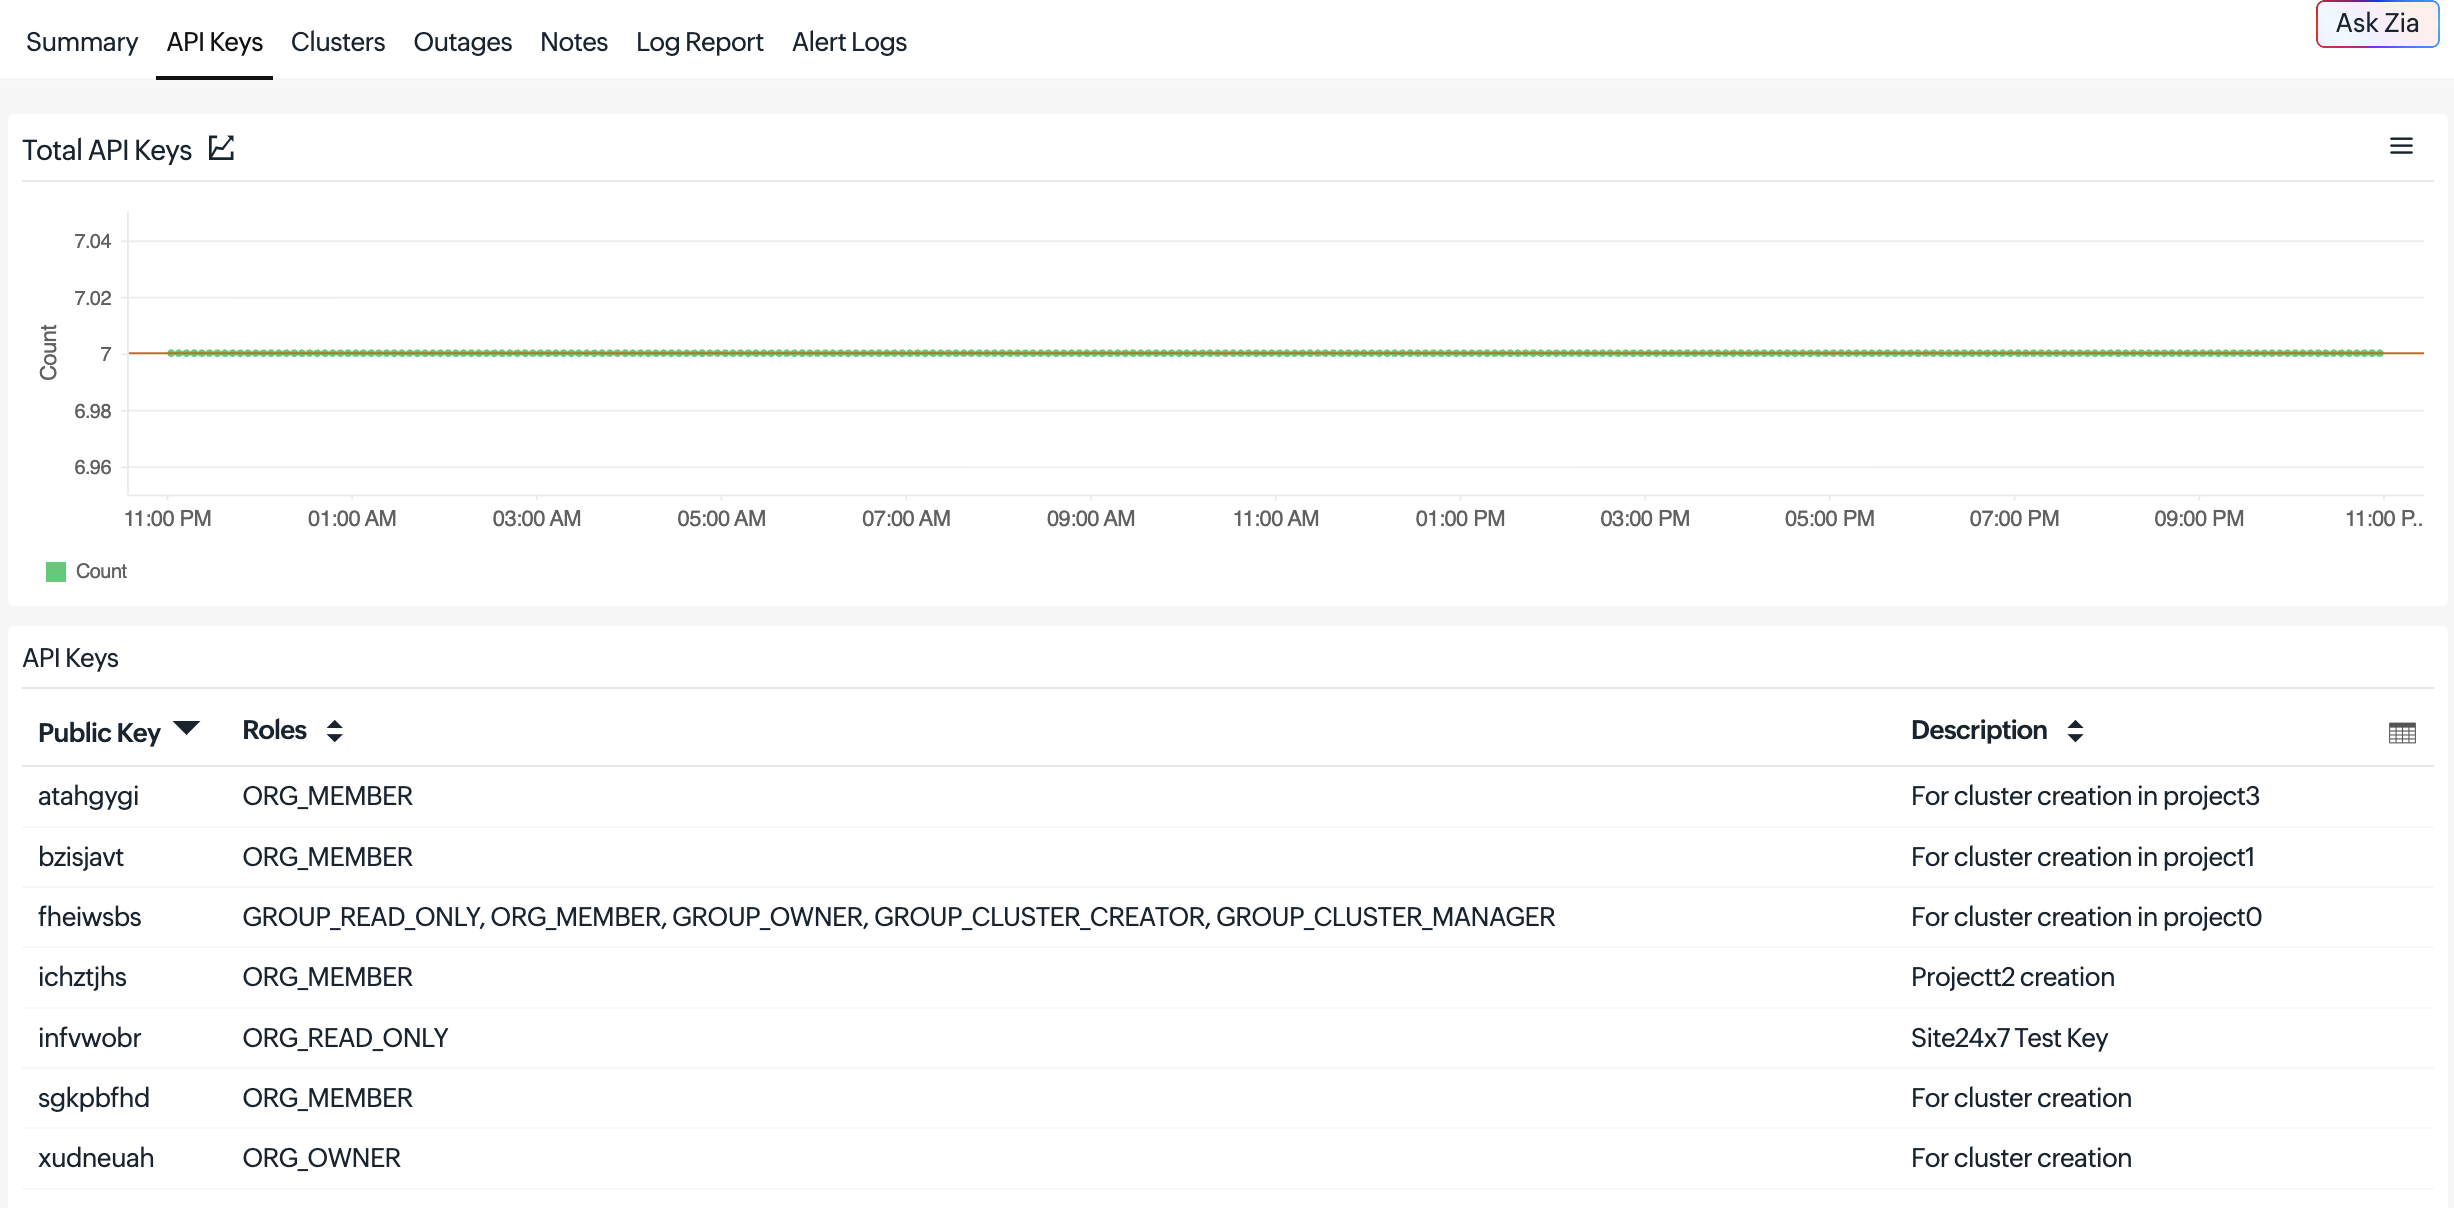
| Field | Description |
|---|---|
| Total API Keys | Displays a graph showing the total number of API keys configured in the MongoDB Atlas organization over time. |
| Public Key | Public key of the API key. |
| Roles | Roles assigned to the API key. |
| Description | Description of the API key. |
Clusters
The Clusters tab displays a graph showing the total number of clusters over time and a table listing the clusters added to Site24x7, along with their configuration details and availability status. Click Discover Cluster to discover and add clusters manually. Click a cluster name to view its associated cluster monitor.
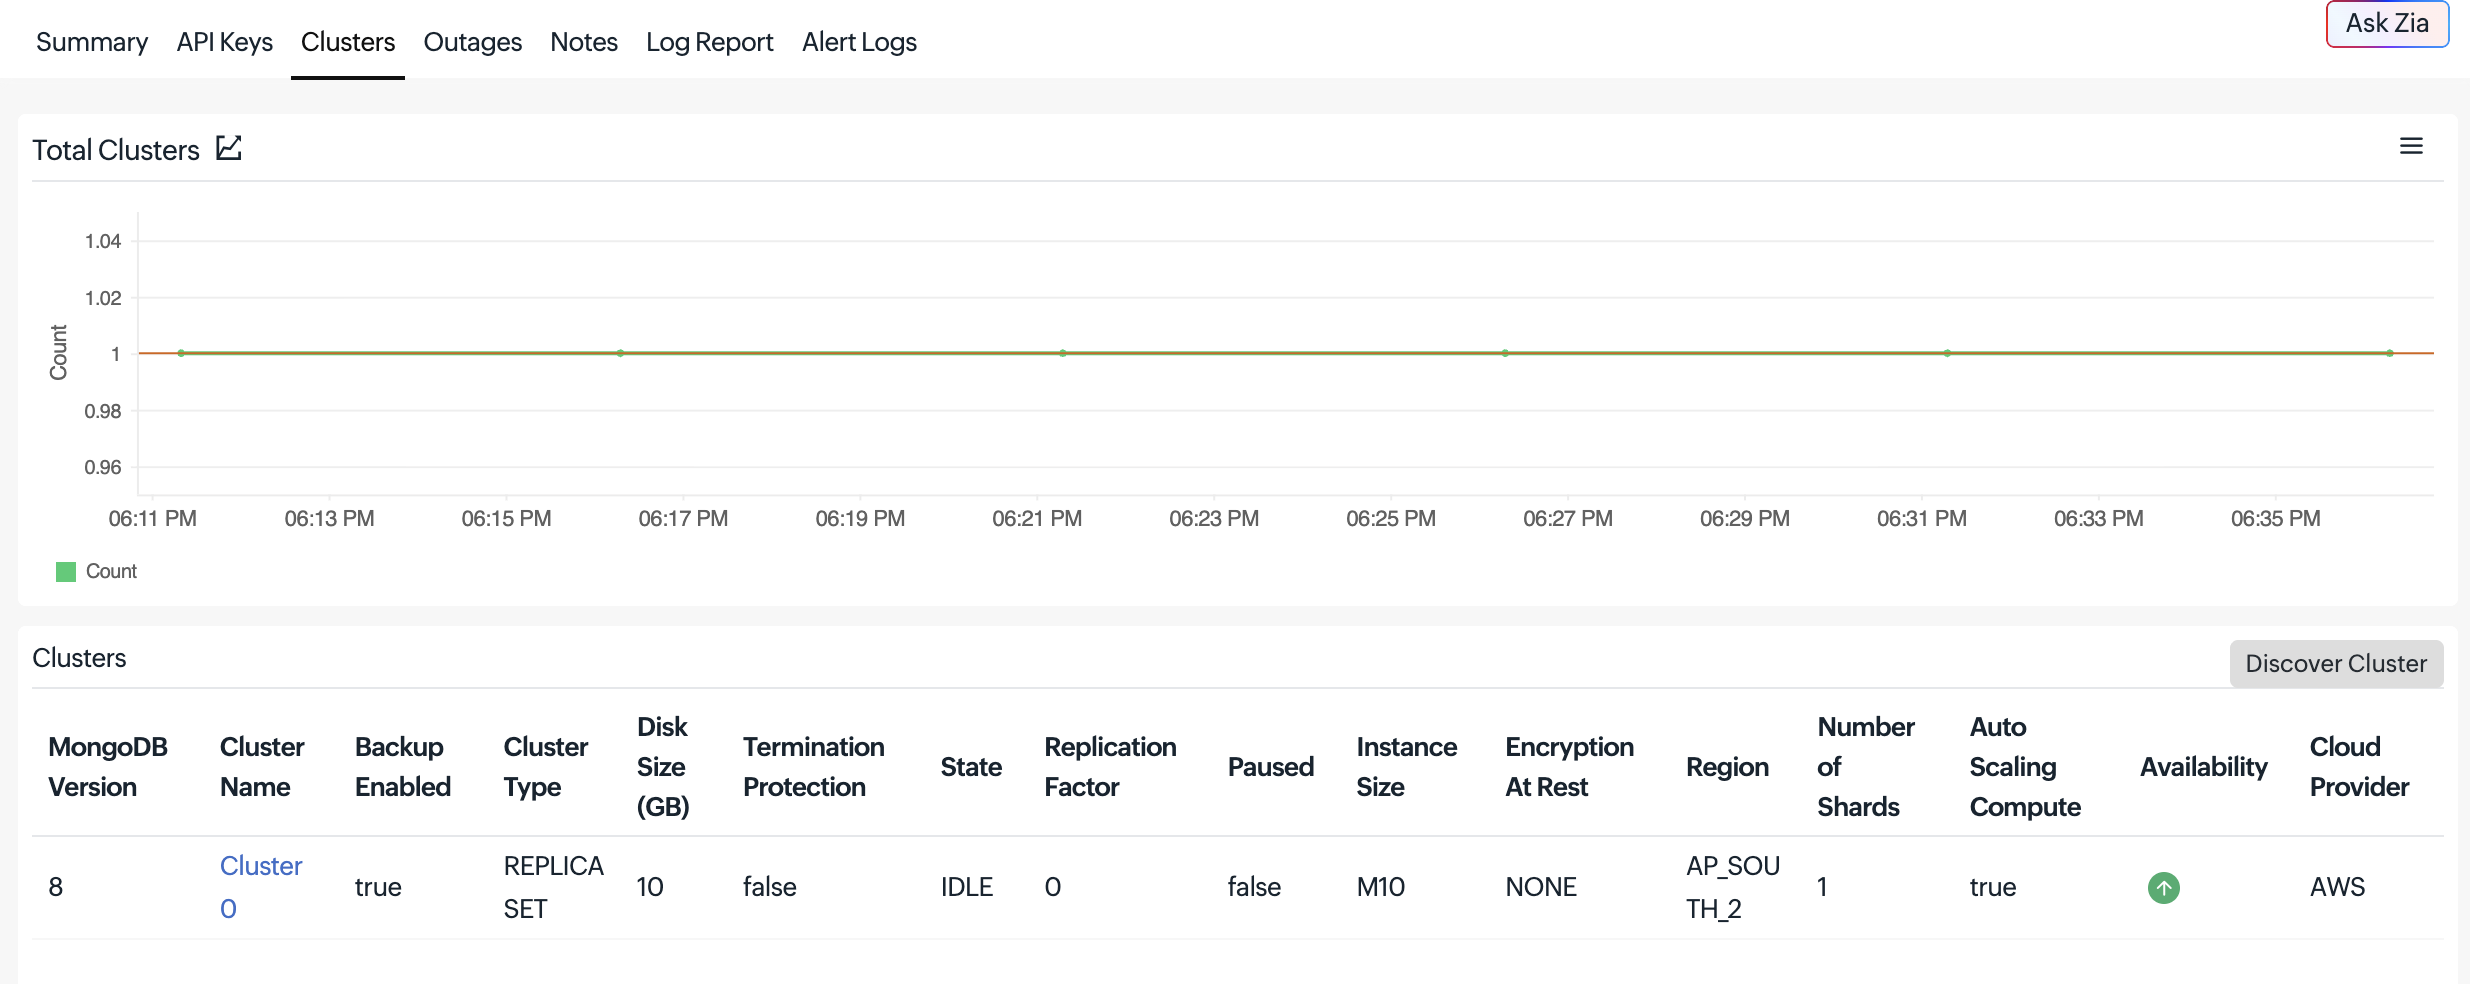
| Field | Description |
|---|---|
| MongoDB Version | MongoDB version running on the cluster. |
| Cluster Name | Name of the discovered cluster. |
| Backup Enabled | Indicates whether backup is enabled for the cluster. |
| Cluster Type | Type of cluster: replica set or sharded. |
| Disk Size (GB) | Allocated disk size of the cluster. |
| Termination Protection | Indicates whether termination protection is enabled for the cluster. |
| State | Current state of the cluster, such as IDLE or UPDATING. |
| Replication Factor | Number of replica set members. |
| Paused | Indicates whether the cluster is paused. |
| Instance Size | Size of the cluster instance. |
| Encryption At Rest | Indicates whether encryption at rest is enabled for the cluster. |
| Region | Region where the cluster is deployed. |
| Number of Shards | Number of shards in the cluster. |
| Auto Scaling Compute | Indicates whether compute auto-scaling is enabled. |
| Availability | Current availability status of the cluster monitor. |
| Cloud Provider | Cloud provider hosting the cluster, such as AWS, Azure, or GCP. |
To learn more about the other tabs, refer to this section.
View your MongoDB Atlas cluster monitor
Click a cluster in the Clusters tab to open its cluster monitor.
Summary
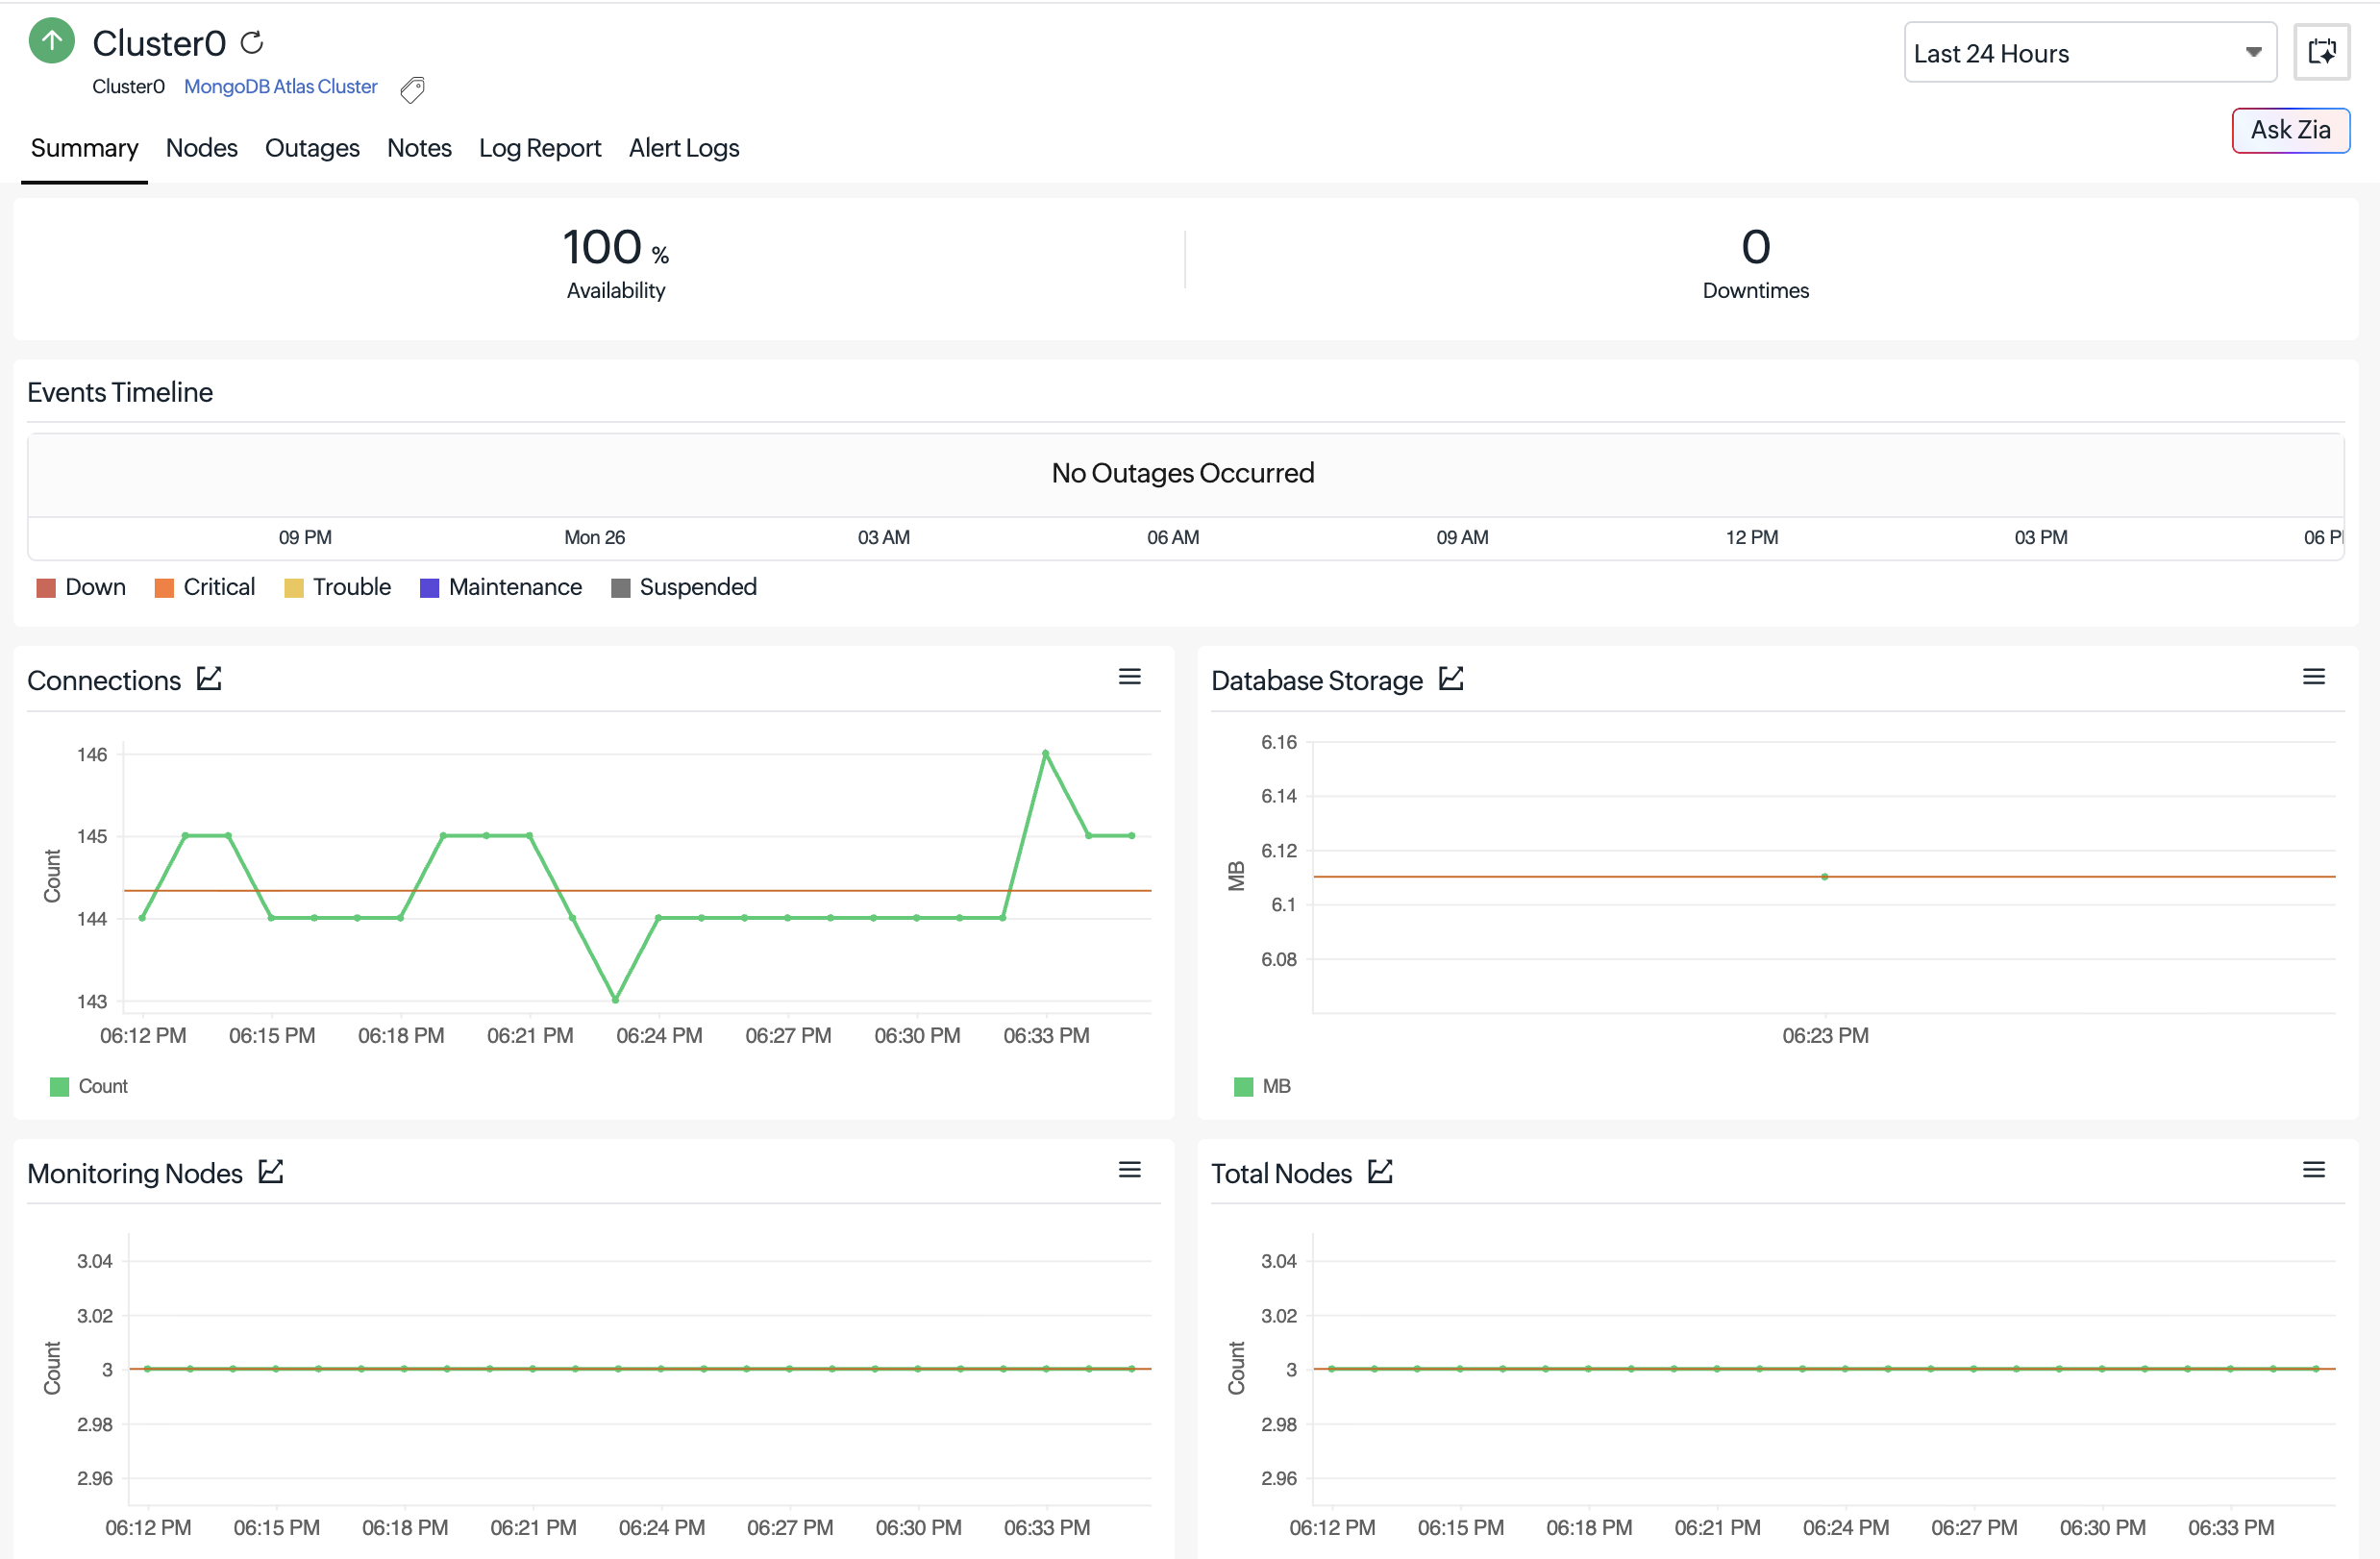
The Summary tab provides an overview of the cluster’s availability, downtime, and performance.
| Metric | Description |
|---|---|
| Availability | Percentage of time the cluster monitor was available during the selected period. |
| Downtimes | Number of downtime occurrences during the selected period. |
| Events Timeline | Displays monitor status changes, including Down, Critical, Trouble, Maintenance, and Suspended. |
| Connections | Current number of connections to the cluster. |
| Monitoring Nodes | Number of nodes that Site24x7 currently monitors in the cluster. |
| Total Nodes | Total number of nodes in the cluster. |
| DB Storage | Total storage used by all databases in the cluster. |
| Network In | Network bytes the cluster receives. |
| Network Out | Network bytes the cluster sends. |
| Network Requests | Number of network requests the cluster serves. |
| Opcounter Insert | Number of insert operations. |
| Opcounter Query | Number of query operations. |
| Opcounter Update | Number of update operations. |
| Opcounter Delete | Number of delete operations. |
| Opcounter Command | Number of commands executed. |
| Opcounter Getmore (no change) | Number of getmore operations (cursor iteration). |
| Documents Returned | Number of documents queries return. |
| Documents Inserted | Number of documents inserted. |
| Documents Updated | Number of documents updated. |
| Documents Deleted | Number of documents deleted. |
| Open Cursors | Total number of open cursors. |
| Database Data Size | Total data size across all databases. |
| Database Index Size | Total index size across all databases. |
| Query Targeting Ratio | Ratio of documents scanned to documents returned. Indicates query efficiency. |
| Cache Fill Ratio | Percentage of the WiredTiger cache that is filled. |
| Dirty Fill Ratio | Percentage of the WiredTiger cache that is dirty and pending flush. |
| System CPU | Percentage of CPU time the host spends in user space. |
| Disk Partition Space Percent Used | Percentage of disk partition space used. |
| Node Down Count | Number of nodes that are down. |
| Node Trouble Count | Number of nodes in the trouble state. |
| Node Critical Count | Number of nodes in the critical state. |
You can configure thresholds for Down Nodes, Trouble Nodes, and Critical Nodes under the cluster monitor’s Threshold Configuration settings.
Nodes
This tab lists the node hostnames mapped to the cluster monitor, along with their availability status. Click a node to open its node monitor.

To learn more about the other tabs, refer to this section.
View your MongoDB Atlas node monitor
The node monitor collects metrics at one-minute granularity, except database-level metrics. The MongoDB Atlas API doesn't return per-minute data for database-level metrics, so Site24x7 collects them once per poll cycle (every five minutes by default).
Performance metrics
This section describes the metrics available under each tab of the MongoDB Atlas node monitor, helping you analyze database operations, query performance, resource utilization, replication, and overall node health.
Summary
This tab provides an overview of the node’s availability, database operations, connections, memory, CPU, cache, and network performance.
| Metric | Description |
|---|---|
| Connections | Current number of connections to this node. |
| Opcounter Query | Number of query operations performed on this node. |
| Opcounter Insert | Number of insert operations performed on this node. |
| Memory Resident | Resident memory used by the mongod process. |
| Cache Fill Ratio | Percentage of the WiredTiger cache currently filled. |
| Dirty Fill Ratio | Percentage of the WiredTiger cache that is dirty and pending flush. |
| Process CPU User | CPU usage by the mongod process (user space). |
| Network In | Network bytes received by this node. |
| Network Out | Network bytes sent by this node. |
| DB Storage | Total storage used by databases on this node. |
| Tickets Available Reads | Number of available read concurrency tickets. |
Databases
This tab displays database-level metrics, including data size, storage usage, collections, indexes, and object counts.
| Metric | Description |
|---|---|
| Index Size | Size of indexes in the database. |
| Collection Count | Number of collections in the database. |
| Data Size | Size of data stored in the database. |
| Object Count | Number of objects or documents in the database. |
| Database Name | Name of the database. |
| Index Count | Number of indexes in the database. |
| Extent Count | Number of extents allocated to the database. |
| Average Object Size | Average size of an object or document in the database. |
| Storage Size | Total storage allocated to the database. |
| View Count | Number of views defined in the database. |
- Click Discover Databases to discover databases and add them for monitoring.
- Click the pencil icon under the Action column to configure thresholds for an individual database.
- To configure thresholds for multiple databases simultaneously, click Threshold Configuration.
- You can also click the delete icon under the Action column to remove a database from monitoring.
Operations
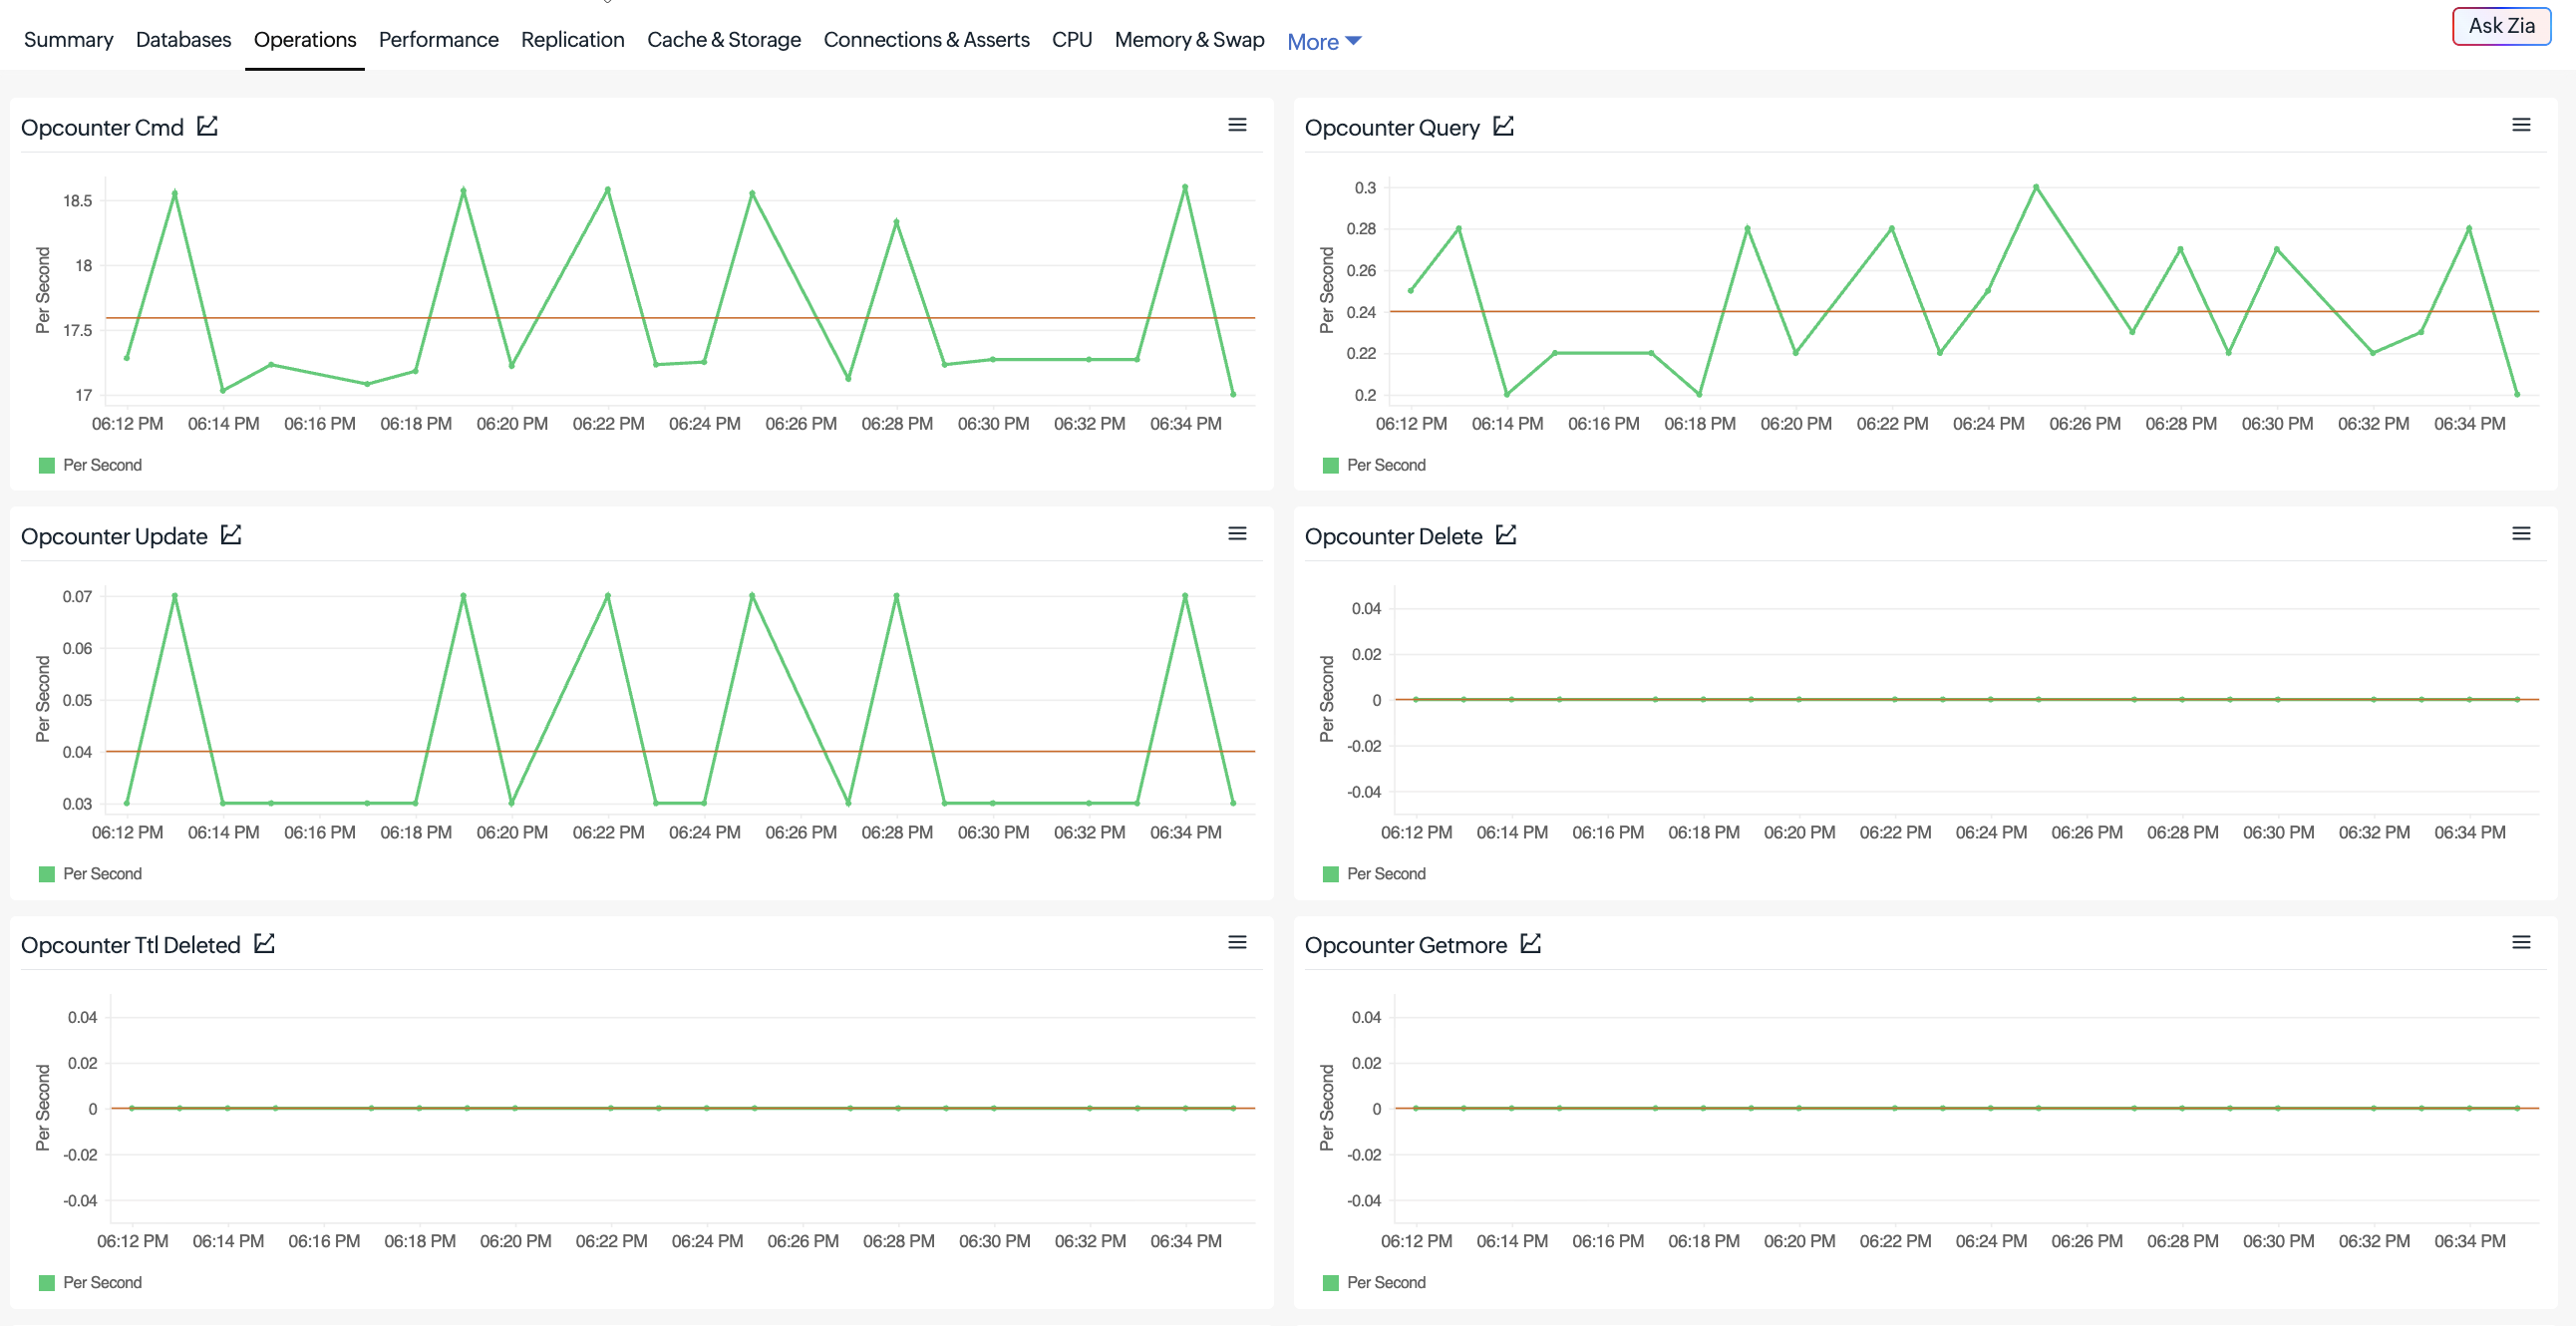
This tab provides insights into database operations, including queries, inserts, updates, deletes, commands, and document activity.
| Metric | Description |
|---|---|
| Opcounter Cmd | Number of commands executed. |
| Opcounter Query | Number of query operations performed. |
| Opcounter Update | Number of update operations performed. |
| Opcounter Delete | Number of delete operations performed. |
| Opcounter TTL Deleted | Number of documents deleted via time-to-live (TTL) index expiration. |
| Opcounter Getmore | Number of getmore operations (cursor iteration). |
| Opcounter Insert | Number of insert operations performed. |
| Opcounter Replication Cmd | Number of replicated commands applied on this node. |
| Opcounter Replication Update | Number of replicated update operations applied on this node. |
| Opcounter Replication Delete | Number of replicated delete operations applied on this node. |
| Opcounter Replication Insert | Number of replicated insert operations applied on this node. |
| Documents Returned | Number of documents returned by queries. |
| Documents Inserted | Number of documents inserted. |
| Documents Updated | Number of documents updated. |
| Documents Deleted | Number of documents deleted. |
| Operations Scan and Order | Number of queries that required an in-memory sort. |
| Operations Queries Killed | Number of queries killed (for example, exceeded limits). |
Performance
This tab displays query execution times, query efficiency, concurrency, throttling, and other performance metrics.
| Metric | Description |
|---|---|
| Operation Execution Time Reads | Average execution time for read operations. |
| Operation Execution Time Writes | Average execution time for write operations. |
| Operation Execution Time Commands | Average execution time for command operations. |
| Query Executor Scanned | Number of index entries or documents scanned by the query planner. |
| Query Executor Scanned Objects | Number of objects scanned by the query planner. |
| Query Targeting Ratio | Ratio of documents scanned to documents returned (query efficiency indicator). |
| Query Targeting Objects Ratios | Ratio of objects scanned to objects returned. |
| Tickets Available Reads | Number of available read concurrency tickets. |
| Tickets Available Write | Number of available write concurrency tickets. |
| Throttled Operations | Number of operations rejected due to throttling. |
| Query Spill To Disk During Sort | Number of sort operations that spilled to disk. |
| Global Lock Current Queue Total | Total number of operations waiting on the global lock. |
| Global Lock Current Queue Readers | Number of read operations waiting on the global lock. |
| Global Lock Current Queue Writers | Number of write operations waiting on the global lock. |
| Page Faults | Number of page faults occurring on this node. |
Replication
This tab provides insights into replication performance, including oplog activity and replication lag.
| Metric | Description |
|---|---|
| Oplog Master Time | Time window covered by the oplog on the primary. |
| Oplog Rate | Rate at which the oplog grows. |
| Oplog Slave Lag Master Time | Replication lag relative to the master's oplog time. |
| Oplog Replication Lag Time | Current replication lag of this node. |
| Oplog Master Lag Time Diff | Difference in lag time compared to the primary. |
The Oplog Slave Lag Master Time, Oplog Replication Lag Time, and Oplog Master Lag Time Diff metrics are available only for secondary nodes. These metrics will not display data for primary nodes.
Cache & Storage
This tab displays cache utilization, database storage, index sizes, and cursor activity.
| Metric | Description |
|---|---|
| Cache Read | Bytes read into the WiredTiger cache. |
| Cache Written | Bytes written from the WiredTiger cache. |
| Cache Dirty | Bytes in the cache that are dirty (modified, pending flush). |
| Cache Used | Total bytes currently used in the cache. |
| Cache Fill Ratio | Percentage of the WiredTiger cache currently filled. |
| Dirty Fill Ratio | Percentage of the WiredTiger cache that is dirty. |
| Database Storage | Total storage used by databases on this node. |
| Database Data Size | Total data size across all databases on this node. |
| Database Data Size (Without System) | Total data size excluding system databases. |
| Database Index Size | Total index size across all databases on this node. |
| Open Cursors | Total number of open cursors. |
| Cursors Timed Out | Number of cursors that timed out. |
Connections & Asserts
This tab provides insights into active connections, network traffic, and database assertions.
| Metric | Description |
|---|---|
| Connections | Current number of connections to this node. |
| Network In | Network bytes received by this node. |
| Network Out | Network bytes sent by this node. |
| Network Requests | Number of network requests handled. |
| Assert Regular | Number of regular assertions raised. |
| Assert Warning | Number of warning assertions raised. |
| Assert Msg | Number of message assertions raised. |
| Assert User | Number of user assertions raised. |
CPU
This tab displays CPU utilization metrics for the MongoDB process and host system, including normalized and peak CPU usage.
Each metric below has a normalized (per core) variant, named with Normalized, and a peak variant, named with the Max prefix, for example, Max Process Normalized CPU User.
| Metric | Description |
|---|---|
| Process CPU User | CPU usage by the mongod process in user space. |
| Process CPU Kernel | CPU usage by the mongod process in kernel space. |
| Process CPU Children User | CPU usage by child processes of mongod in user space. |
| Process CPU Children Kernel | CPU usage by child processes of mongod in kernel space. |
| Process Normalized CPU User / Kernel / Children User / Children Kernel | Normalized (per core) CPU usage of the mongod process and its child processes, in user and kernel space. |
| Max Process CPU User / Kernel / Children User / Children Kernel | Peak CPU usage of the mongod process and its child processes, in user and kernel space. |
| Max Process Normalized CPU User / Kernel / Children User / Children Kernel | Peak normalized CPU usage of the mongod process and its child processes. |
| System CPU User | CPU usage of the host system in user space. |
| System CPU Kernel | CPU usage of the host system in kernel space. |
| System CPU Nice | CPU usage of the host system for niced processes. |
| System CPU IO Wait | CPU time the host system spent waiting for I/O. |
| System CPU IRQ | CPU time the host system spent servicing interrupts. |
| System CPU Soft IRQ | CPU time the host system spent servicing soft interrupts. |
| System CPU Guest | CPU time spent running a virtual CPU for a guest OS. |
| System CPU Steal | CPU time stolen from this VM by the hypervisor for other tasks. |
| System Normalized CPU User / Kernel / Nice / IO Wait / IRQ / Soft IRQ / Guest / Steal | Normalized host system CPU usage for each state above. |
| Max System CPU User / Kernel / Nice / IO Wait / IRQ / Soft IRQ / Guest / Steal | Peak host system CPU usage for each state above. |
| Max System Normalized CPU User / Kernel / Nice / IO Wait / IRQ / Soft IRQ / Guest / Steal | Peak normalized host system CPU usage for each state above. |
Memory & Swap
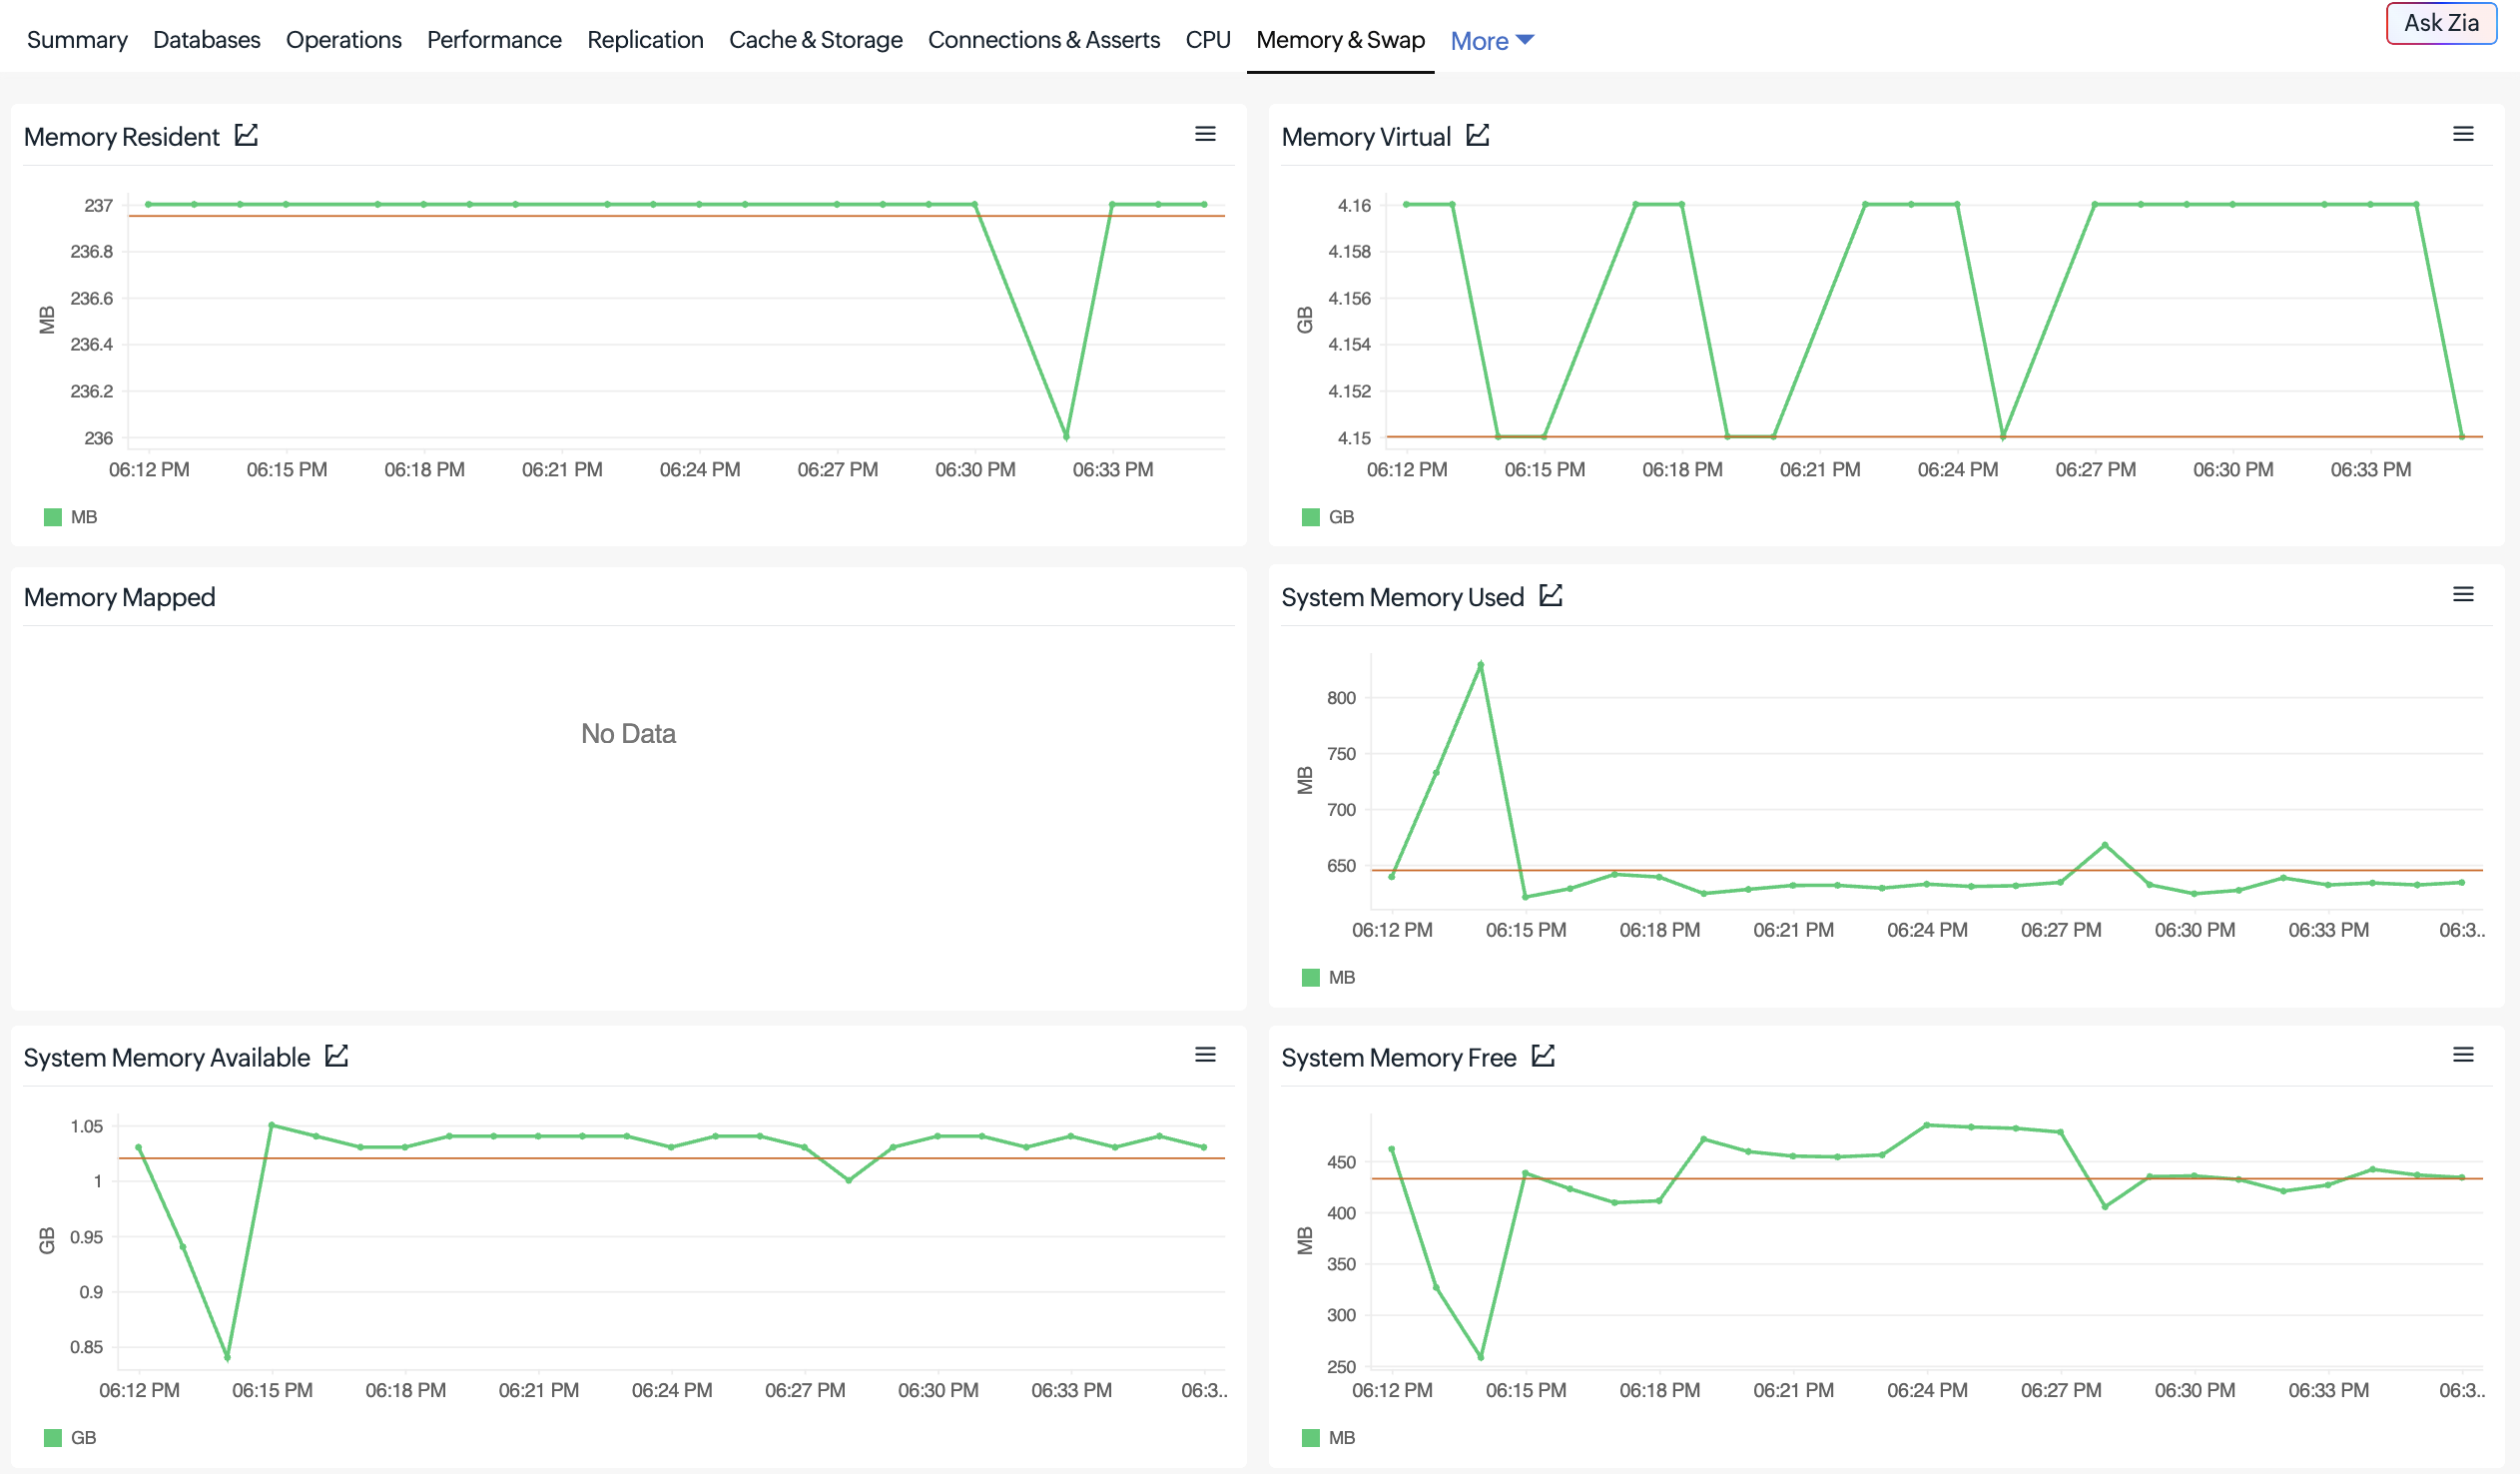
This tab provides insights into memory consumption, available memory, swap usage, and swap I/O activity.
Each host memory and swap metric has a peak variant with the Max prefix, for example, Max System Memory Used.
| Metric | Description |
|---|---|
| Memory Resident | Resident memory used by the mongod process. |
| Memory Virtual | Virtual memory used by the mongod process. |
| Memory Mapped | Memory-mapped size used by the mongod process. |
| System Memory Used | Memory used on the host system. |
| System Memory Available | Memory available on the host system. |
| System Memory Free | Free memory on the host system. |
| System Memory Shared | Shared memory on the host system. |
| System Memory Cached | Cached memory on the host system. |
| System Memory Buffers | Buffer memory on the host system. |
| Swap Usage Used | Amount of swap space used. |
| Swap Usage Free | Amount of swap space free. |
| Swap IO In | Rate of data swapped in from disk. |
| Swap IO Out | Rate of data swapped out to disk. |
| Max System Memory Used / Available / Free / Shared / Cached / Buffers | Peak value of each host memory metric. |
| Max Swap Usage Used / Free | Peak swap space used and free. |
| Max Swap IO In / Out | Peak rate of data swapped in from and out to disk. |
Network
This tab displays network traffic and request metrics for the MongoDB process and host system.
| Metric | Description |
|---|---|
| Network In | Network bytes received by the mongod process. |
| Network Out | Network bytes sent by the mongod process. |
| Network Requests | Number of network requests handled by the mongod process. |
| System Network In | Network bytes received at the host system level. |
| System Network Out | Network bytes sent at the host system level. |
| Max System Network In | Peak network bytes received at the host system level. |
| Max System Network Out | Peak network bytes sent at the host system level. |
Full-Text Search
This tab provides insights into Atlas Search resource utilization, including CPU, memory, and disk usage.
| Metric | Description |
|---|---|
| FTS Process Resident Memory | Resident memory used by the Atlas Search (mongot) process. |
| FTS Process Virtual Memory | Virtual memory used by the Atlas Search process. |
| FTS Process Shared Memory | Shared memory used by the Atlas Search process. |
| FTS Disk Usage | Disk space used by Atlas Search indexes. |
| FTS Process CPU User | CPU usage of the Atlas Search process in user space. |
| FTS Process CPU Kernel | CPU usage of the Atlas Search process in kernel space. |
| FTS Process Normalized CPU User | Normalized CPU usage of the Atlas Search process in user space. |
| FTS Process Normalized CPU Kernel | Normalized CPU usage of the Atlas Search process in kernel space. |
Disk
This tab displays disk performance metrics, including IOPS, latency, throughput, disk space, and queue depth.
| Metric | Description |
|---|---|
| Disk IOPS Read | Read I/O operations per second on the disk partition. |
| Disk IOPS Write | Write I/O operations per second on the disk partition. |
| Disk IOPS Total | Total I/O operations per second on the disk partition. |
| Disk Latency Read | Average read latency on the disk partition. |
| Disk Latency Write | Average write latency on the disk partition. |
| Disk Throughput Read | Read throughput on the disk partition. |
| Disk Throughput Write | Write throughput on the disk partition. |
| Disk Space Free | Free space on the disk partition. |
| Disk Space Used | Used space on the disk partition. |
| Disk Free | Percentage of disk partition space free. |
| Disk Used | Percentage of disk partition space used. |
| Disk Queue Depth | Number of pending I/O requests in the disk queue. |
| Max Disk IOPS Read / Write / Total | Peak read, write, and total I/O operations per second. |
| Max Disk Latency Read / Write | Peak read and write latency on the disk partition. |
| Max Disk Space Free / Used | Peak free and used space on the disk partition. |
| Max Disk Free / Used | Peak percentage of disk partition space free and used. |
Slow Queries
To view Slow Queries data, ensure the required project-level permissions are configured. Refer to the prerequisites for more information.
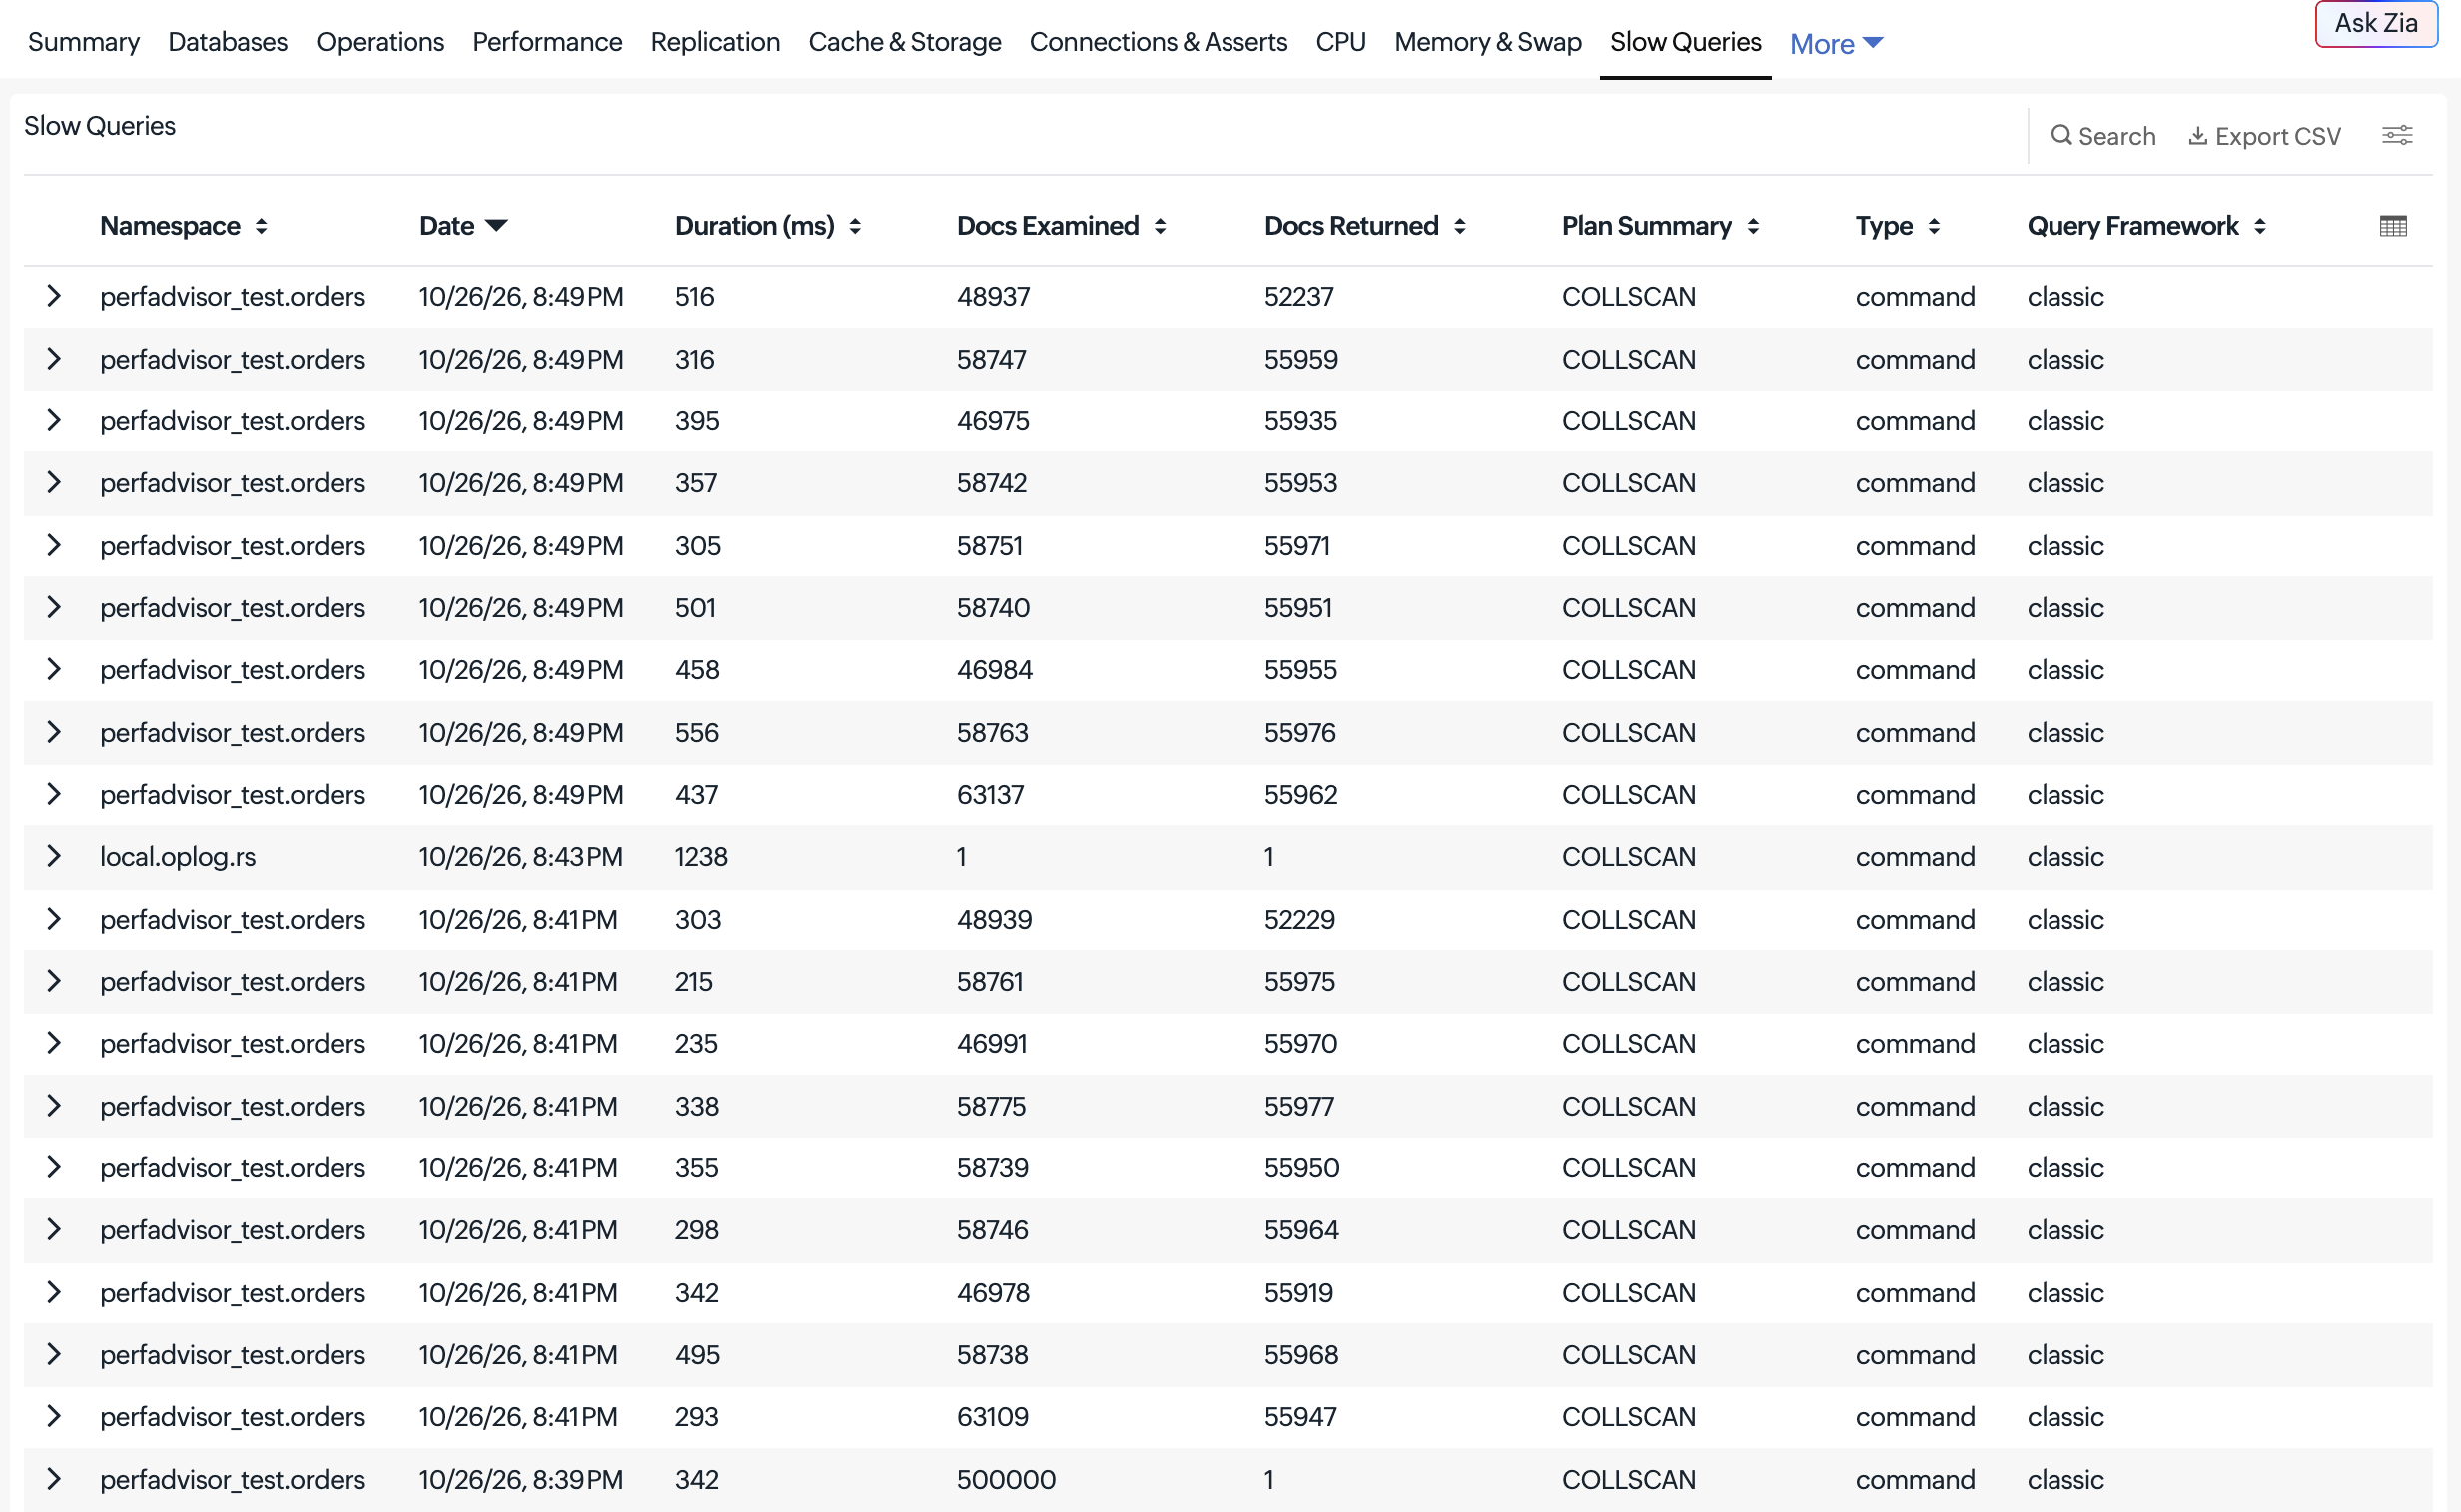
This tab displays slow query logs to help identify queries that may affect database performance.
| Metric | Description |
|---|---|
| Slow Query Log | List of slow query entries captured from the Atlas Performance Advisor (query text, namespace, execution stats). |
Suggested Indexes
This tab displays index recommendations from the Atlas Performance Advisor to help optimize query performance.
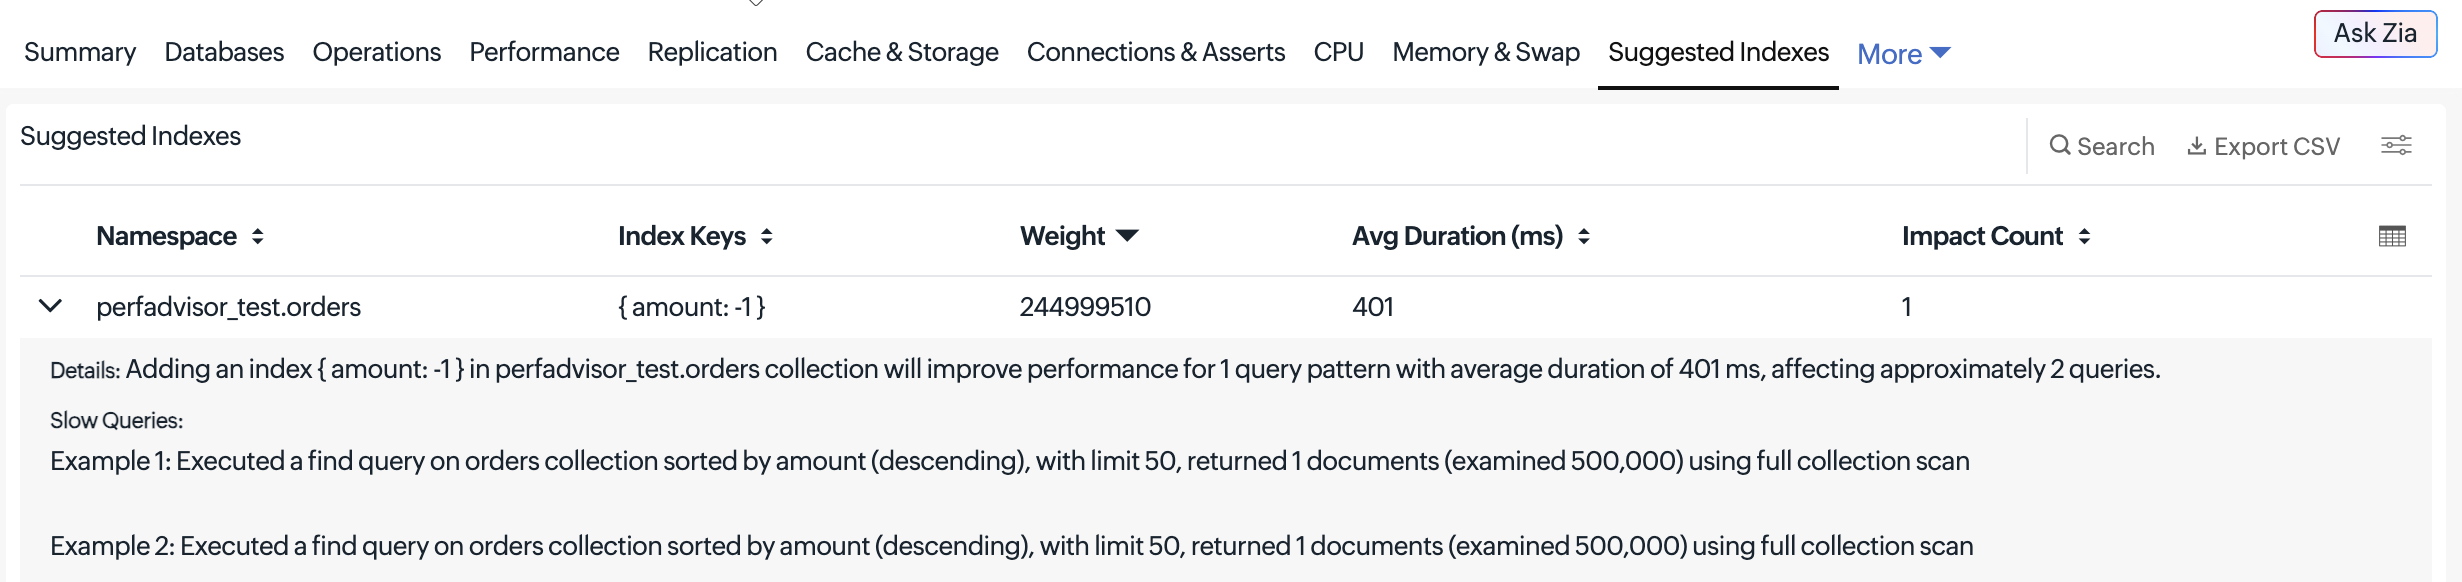
| Metric | Description |
|---|---|
| Suggested Index List | List of index recommendations from the Atlas Performance Advisor (recommended index and impacted collections or queries). |
Other tabs
The MongoDB Atlas Organization, Cluster, and Node monitors also include the following common tabs:
- Outages: Displays the outage history of the cluster monitor, including downtime details and duration.
- Notes: Allows you to add and view notes related to the cluster monitor.
- Log Report: Displays the historical monitoring data collected for the cluster.
- Alert Logs: Displays the alerts generated for the cluster monitor, including alert status and notification details.
-
On this page
- Use cases
- Benefits
- Supported components
- Prerequisites
- Add a monitor in Site24x7
- Add an OAuth provider
- View MongoDB Atlas monitor
- Summary tab
- API Keys tab
- Clusters
- View your cluster monitor
- Summary tab (cluster)
- Nodes tab (cluster)
- View your node monitor
- Performance metrics (node)
- Other common tabs