Performance metrics of an Aruba EdgeConnect SD-WAN monitor
The Aruba EdgeConnect SD-WAN monitor provides detailed performance metrics that help you analyze device health, availability, and resource utilization. These metrics are displayed as graphs and tables for effective monitoring and troubleshooting.
Summary
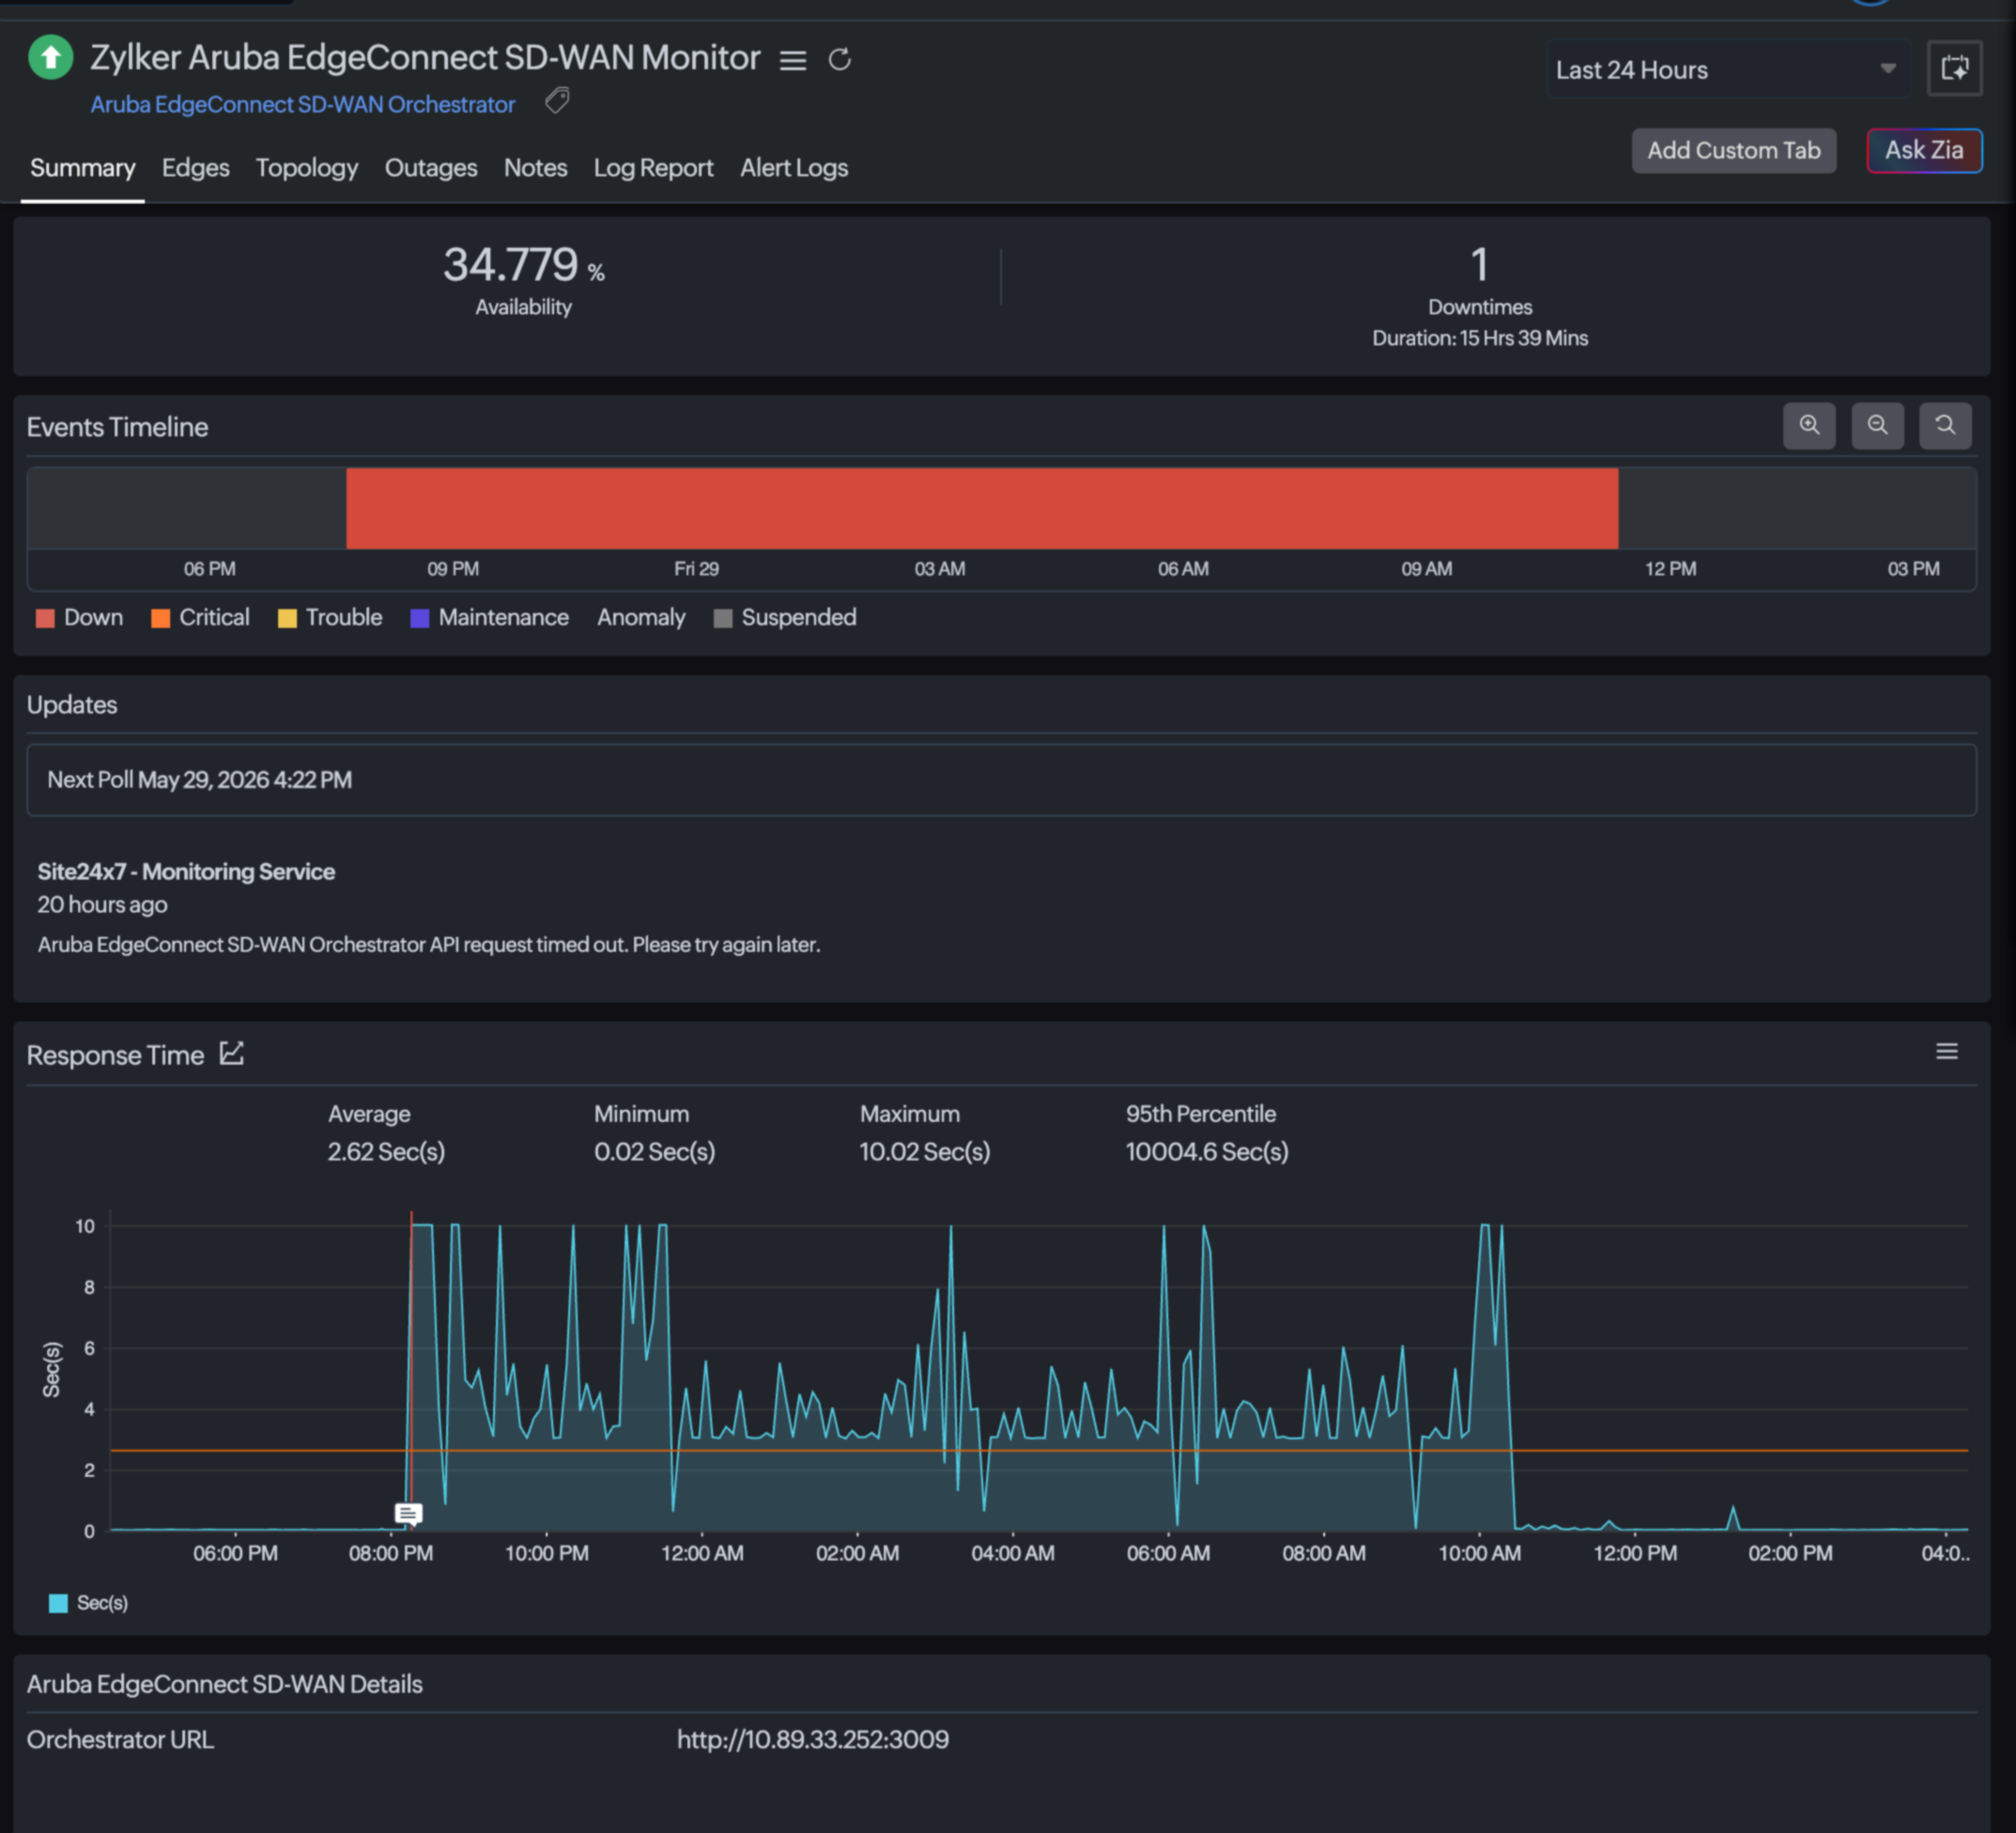
The Summary tab provides an overview of key performance metrics for the selected EdgeConnect SD-WAN monitor.
| Metric | Description |
|---|---|
| Availability | Displays the percentage of time the device is reachable and operational |
| Response Time | Shows the time taken by the device to respond to monitoring requests |
| CPU Utilization | Indicates the percentage of CPU resources currently in use |
| Memory Utilization | Displays the amount of memory consumed by the device |
| Status | Shows the current operational state of the device (Up, Down, Trouble) |
Edges
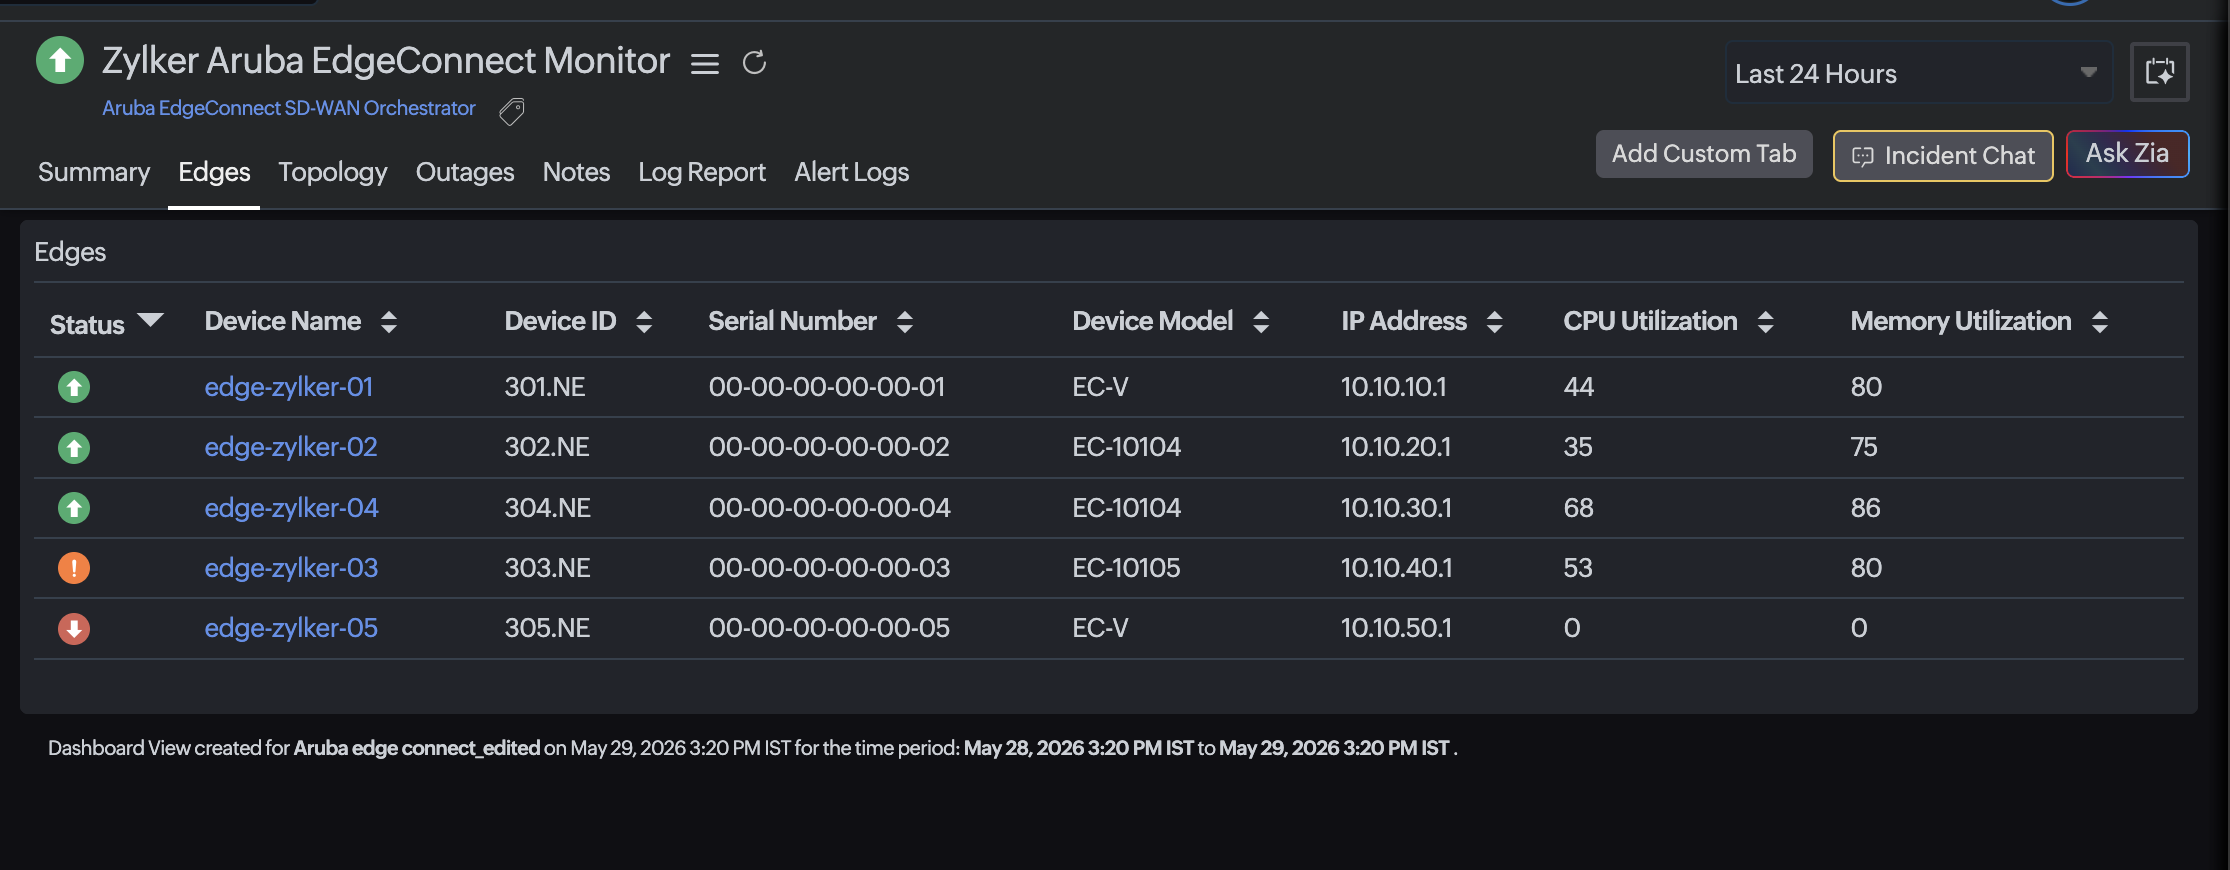
The Edges tab provides device-level performance and inventory details for all EdgeConnect devices associated with the SD-WAN monitor. Click an Edge name to view detailed metrics for the Edges.
| Attribute | Description |
|---|---|
| Device ID | Unique identifier assigned to the EdgeConnect device |
| Serial Number | Manufacturer-assigned serial number of the device |
| Device Model | Specifies the EdgeConnect device model |
| IP Address | Shows the IP address of the device |
| CPU Utilization | Displays the percentage of CPU usage for the device |
| Memory Utilization | Indicates the percentage of memory consumption |
Related articles
-
On this page
- Summary
- Edges
- Related articles