Outages Report
Outages Report helps you access all the outages related to your monitors over a specific period of time, on a single dashboard view. Outages are captured and made visible right on the home screen to make sure you're always made aware of any critical issues. This report includes the downtime details like incident start and end times, duration of outage and the monitor name along with the reason for downtime for quick incident troubleshooting. You can click the ![]() icon to mark an outage as maintenance, edit comments, or even delete any outages if it's irrelevant.
icon to mark an outage as maintenance, edit comments, or even delete any outages if it's irrelevant.
Generate your Outage Report
- Log in to Site24x7.
- Navigate to Home > Outages
- Fill the following fields:
- Resource Type: Choose the resource for which you want to view the outages. (Monitor, Monitor Group, Tag, All Monitors.)
- Time Period: Choose the desired Time Period from the drop-down.
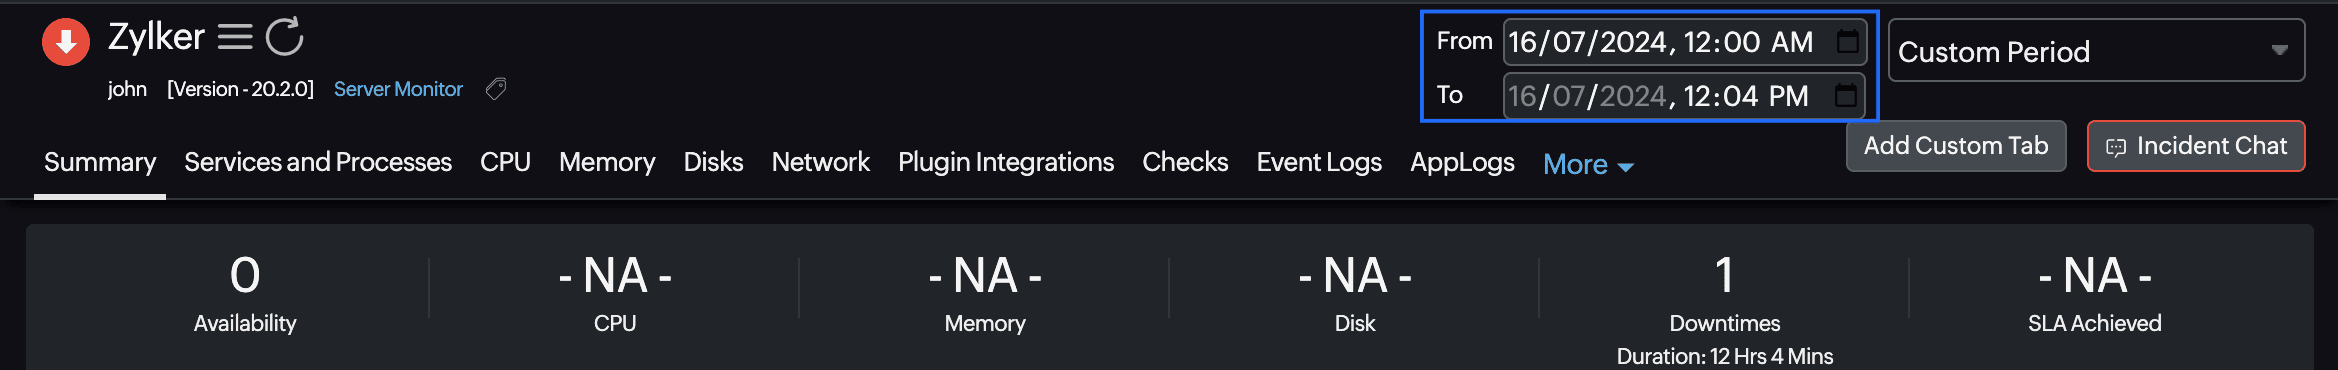
You can generate reports for the last 1, 6, 12, 24 hours, today to as long as a year back. Additionally, you can also generate report for a custom time period. - Date Range: If you choose custom period in the Time Period drop-down, then you can choose the Date Range for you which want to view data for the outage within that time outage period. Once you set a custom date range, you can click on the desired monitor to view the report, and the same date range will be applied in the monitor details page in the top band.
- Bulk Action: Select multiple outages to perform bulk action. You can choose to add a comment for all the selected outages, mark them as maintenance, or delete them.
- Status icon: Click the status icon to view the status of the bulk action task.
- Add Outage: You can choose to add an outage manually with the Add Outage option. Instantly gain insights into all outages related to your monitors over a specific period using Ask Zia. Get a summary of details like incident start and end times, outage duration, monitor name, and the reason for downtime to troubleshoot incidents quickly and efficiently.
- Share This: You can use Share This option to export the reports as CSV, PDF, or via email notifications.
NoteYou can opt to view the reasons and the latest comments on the outage by clicking the filter column icon by navigating to Home > Outages > filter column icon. You can choose to see both, one of those, or neither.
- Click the
 icon to perform more actions on the outages.
- Click Mark as Maintenance to mark a specific outage period as maintenance.
- After you mark a downtime as maintenance, Site24x7 will add a note in ManageEngine ServiceDesk Plus On-Demand indicating that the monitor has been marked as maintenance, if the monitor has an open ticket. On the Monitor Details page, you can revert the maintenance to an outage, if needed.
- You can also mark a monitor in Down status as maintenance and revert it to an outage directly in the ManageEngine ServiceDesk Plus On-Demand portal and this will be updated as a note to the open ticket.
- Click Add/Edit Comments to add and edit the reason under Comments section.
Note- During any detected outage, Site24x7 will auto-populate the reason for downtime under the Recent Comments section. Anyone, irrespective of user roles, can edit/delete these system generated comments.
- You can edit and delete any comment that you'd added. However, Super Admin/Admin roles will only have the privilege to delete comments, and not edit them.
- Click Mark as Maintenance to mark a specific outage period as maintenance.